Categories
Forex Basic Strategies Forex Daily Topic

Trade Ranges Like A Pro with this Effective Forex Trading Strategy

Introduction

The market does not move in random directions. It either trends or consolidates. As many would not know, the market is like a closed circle, and the same states keep repeating over and over again. Thus, in trading, one must learn how to become pro at reading these market states.

On that same note, we shall be going over an effective strategy when the market is in a consolidation/ranging state. However, before jumping right into the strategy, it is important to understand the basics and related concepts.

What is a consolidation phase in a market?

There are several ways to comprehend the consolidation phase of the market. There is logical reasoning behind the occurrence of this state, and is not simply a random pattern that shows up quite often.

The consolidation state is that phase of the market when the market moves in a sideways direction. This state is also referred to as a range. The reason for its occurrence is related to the strength between bulls and bears.

Comprehending a Range

There are two parties in the market – the bulls and the bears. Their strength is what describes the state of the market. In a trending market, either of the parties is powerful. For instance, if the market is going up, it simply means that the bulls control the market. In a consolidation state, both bulls and bears show equal strength. The bulls show strength by pushing the market higher, while the bears show power by taking the price right back down. As a result, the prices in both directions – which we refer to as a range.

How to draw a range?

To trade this range strategy, it is vital to understand how a range is drawn. A range is made up of two levels:

  • Support
  • Resistance

Thus, drawing the correct support and resistance levels will result in a perfect range.

Another point considered is the size of the range. The larger the range, the better. The other small consolidations in the market are ignored. Following is an example of how we pick an ideal range.

In the above example, both are ranges as the market is moving in a sideways direction. However, we do not consider range-1 as a range for our strategy. This is because a single line going up and down fails to depict the market’s price action.

Supply and Demand Range Strategy

What is the usual approach to trading a range? It is to buy at the support and sell at the resistance. But we’re going to step the game a little bit. The supply and demand range strategy uses the same principles of a typical range, in addition to other factors.

Step by step procedure to trade the Supply and Demand Range Strategy:

  1. Find a legitimate range in the market. Mark the Support and Resistance levels appropriately.
  2. Determine the direction of the market prior to the range.
  3. Find a potential supply/demand level.
  4. Get in when the market breaks through the range and reaches the supply/demand zone.

Buy Example

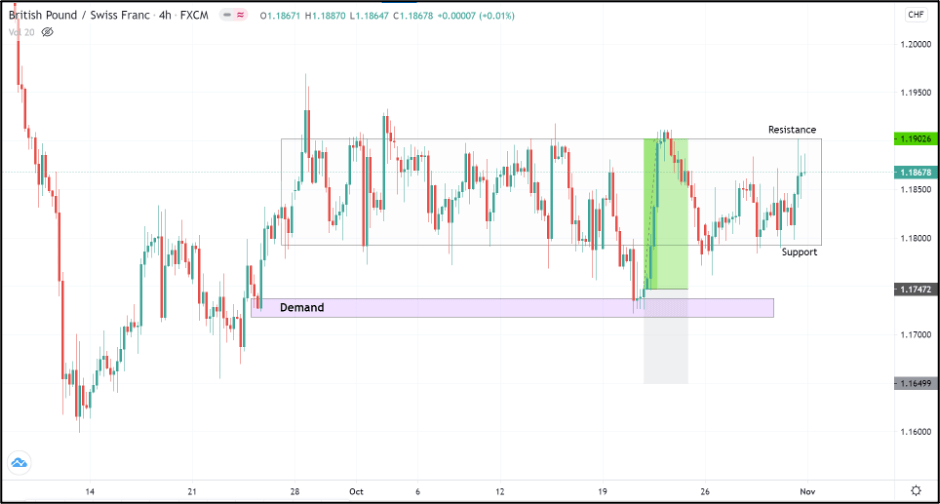
Consider the below chart of GBPCHF on the 4H timeframe. We see that the market has been ranging between 1.1902 and 1.1800. Observe that the support and resistance levels have been marked by cutting off the false market breakouts.

To trade this market, our job is not simply to hit the buy at the support and sell at the resistance. As mentioned, we take into account the preceding direction and the supply and demand levels around it.

The direction of the market prior to the range was an upside, indicating that the bulls were in control previously. A point to note is that, despite the market being in a range, it does not change the fact that the bulls are still powerful. Thus, we rather look for buying opportunities than shorting signals.

To do so, we wait for the price to drop below the bottom of the range and hold at any one of the demand zones. Once the market begins to reverse its direction from south to north around the demand zone, we can go long. The same scenario has been illustrated in the chart below.

Placements

Stop Loss – Well below the demand zone would be decent.

Take Profit – Top of the range would be an ideal spot to take profits.

Sell Example

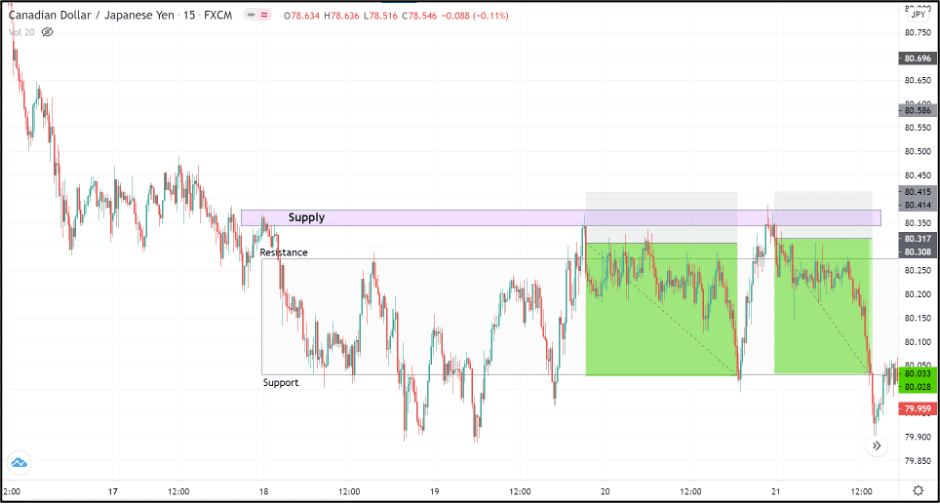
Consider the chart of CAD/JPY on the 15min timeframe shown below. The recent market price action depicts that the market is moving sideways. The market’s overall trend is down, indicating that the bears are in control of the market.

Since the scenario is opposite to the previous example, we wait for the market to break through the resistance and reach any potential supply level. In the below example, we can see that the price broke through the resistance twice reacted off from the supply, as shown. Thus, we can look for entries when the market begins to switch direction to the downside.

Placements

Stop Loss – Above the supply zone

Take Profit – Bottom of the range

Conclusion

The only way to trade a range is not by buying and selling from the top and bottom of the range. It can be professionally traded with the application of other factors. And this range strategy particularly dealt with the strength of the bulls and bears and the concept of supply/demand.

We hope you were able to comprehend our Supply and Demand Range strategy. Do test them out for yourself and let us know your results in the comments below. Happy trading!

Categories
Forex Course

162. Currency Crosses Are Trendier Than You Think

Introduction

Currency crosses are a combination of major and commodity currencies without the US Dollar. Therefore, it is an exciting source of earning money when the US dollar moves within a correction. However, the global economic activity has been increasing day by day, and many business activities are happening without the intervention of the US dollar that might make the cross-currency trading trendy.

Is Cross Currency Trading Profitable?

In every international transaction, the US dollar plays a vital role as it is the reserve currency of every country. Moreover, the valuation of commodities and agricultural products are made through the US dollar. Therefore, most of the trading volume in the forex market comes through the US dollar only. As a result, many traders think it is often hard to profit in trading currency pairs where there is no US dollar.

However, the real scenario is not the same. Currency crosses are an extensive way of earning money from the forex market. If the US dollar remains corrective, most US dollar-related pairs will make less movement, which would be difficult to anticipate the price for traders.

On the other hand, if the Eurozone and Australia’s economic activity moves well, the EURAUD pair will provide a decent movement without the intervention of the US dollar. Nowadays, as the businesses are expanding, cross-currency trading became profitable day by day.

Cross Currencies are Trendy

In financial market trading, portfolio diversification is an essential way to ensure maximum safety of the investment. If one trading instrument does not perform well, there are other instruments to make a profit from. It is the best way to keep the investment active even if some trading instrument is moving within a correction. Therefore, it is best to trade in cross currency pairs when the US dollar is moving within the correction.

On the other hand, cross pairs do not require the US trading session every time. If our technical and fundamental analysis allows, we can profit from London and Asian trading session by any cross pairs like GBPJPY, EURAUD, etc.

Summary

In the above section, we have seen how trading in a cross pair can be profitable. Moreover, every currency pair has some unique characteristics that a trader should understand. A trading strategy’s profitability depends on how a trader is implementing the strategy with strong money management.

[wp_quiz id=”86502″]
Categories
Forex Course

140. Market Environment – Summary

Introduction

In a few of the past course lessons, we have discussed some of the most crucial topics related to the Forex market environment. Starting from the ‘state of the market,’ we have understood what trending and ranging markets are. We also have differentiated the concepts of retracements and reversals, which are vital for identifying accurate entries and exits.

One of the most valuable things we have comprehended is to identify ways for spotting potential market reversals. Finally, we understood how professional traders read different market environments and states. The fundamental purpose of this summary article is this – There is a possibility of you understanding these concepts better once you finish all the course lessons in this section.

Hence, this article will focus on summarizing everything we have learned till now regarding the Market Environment.

The Market States

We have discussed the different ways in which the market moves. Essentially, the price action of a particular asset class moves in three different ways.

Trend | Range | Channel

With clear examples, we have discussed how this movement happens and what we should understand when the price moves in a particular direction. More info related to this can be found here.

Trading the Forex market when it is trending!

In this chapter, we have taken you through the concept of trending market. Uptrend and downtrend concepts have been clearly explained. We also have used Indicators like ADX and Moving Averages to trade the trending market accurately. Please go through this to recall those strategies.

What should we do when the market is ranging? 

We have comprehended the various ways of identifying the ranging market. We also used the Support/Resistance strategy & ADX indicator to trade ranges effectively. Once you try trading a ranging market by yourself, the way you read this article will change, and it will all start making sense. Hence, going through it once again now is important.

Retracements & Reversals

In the next couple of articles, we have drawn down clear differences between Retracements and Reversals. Here, we understood what we must do in the situation of a reversal or a retracement. Then, we have moved on to learn how to trade a reversal in the most effective way possible. In this lesson, we have taken the help of Fibonacci Levels to identify potential market reversals and trade them accordingly.

Finally, we ended this course by understanding how most of the professional Forex traders read and trade different market states. We consider this one of the most useful and valuable articles in this course as we have shared some of the most simple yet effective trading techniques. We also used accurate risk management techniques to protect your capital while trading the market using these techniques. You can go through them again here.

We hope these techniques helped you in becoming a better trader. In our upcoming course lessons, we will be understanding Breakouts, Fakeouts, and everything related to these topics. Cheers!

Categories
Forex Harmonic

The Deep Crab Pattern

Harmonic Pattern Example: Bearish Deep Crab

The Deep Crab Pattern    

The Deep Crab is a variant of the regular Crab pattern. It is still a 5-point extension, and it still has the endpoint (D) at the 161.8% extension of XA, but the AB=CD importance is a little different.

The most distinguishing component of this pattern is the importance of the specific 88.6% retracement point of B. Along with the Crab Pattern, the Deep Crab Pattern presents an especially extended and long move towards D.

Carney stressed that the Crab and Deep Crab represent significant overbought and oversold conditions, and reaction after completion is often sharp and quick. It is the opinion of many traders and analysts that the Crab Pattern and Deep Crab represent some of the fastest and profitable patterns out of all harmonic patterns.

Deep Crab differences from the Crab

  1. BC leg projection is not as extreme as the Crab.
  2. B must be at least an 88.6% retracement. Common to move more than 88.6% retracement level not above/below X (not above X in a Bearish Deep Crab and not below X in a Bullish Deep Crab).
  3. AB=CD pattern variations are more important in the Deep Crab Pattern.
  4. The BC leg is a minimum of 224% but can extend to 361.8%.

Sources: Carney, S. M. (2010). Harmonic trading. Upper Saddle River, NJ: Financial Times/Prentice Hall.  Gilmore, B. T. (2000). Geometry of markets. Greenville, SC: Traders Press.  Pesavento, L., & Jouflas, L. (2008). Trade what you see: how to profit from pattern recognition. Hoboken: Wiley.

Categories
Forex Basic Strategies

Understanding The N-period Narrow Range Trading Strategy

Introduction

There are three states in the market – trend state, channel state, and range state. A trending market is the one where the market makes higher highs or lower lows, and a ranging market is a state where the price goes through a consolidation phase. The channels can be considered as a particular case of range as they work similarly to a range, but are tilted.

What is consolidation?

To understand this strategy, we must first understand the concept of consolidation. Consolidation is a technical term in trading where the market loses momentum and starts to move in the form of a range.

A common tendency of the market is that, when the price starts to move in a range and begins to consolidate, it prepares blast in one of the sides. So, people always keep an eye on currency pairs, which are in a consolidation phase.

N-Period Narrow Range

In the N-period narrow range, the period N takes two values –4 and 7. So, we have the 4-period narrow range and the 7-period narrow range. These two are also referred to as the NR4 (Narrow Range 4) and the NR7 (Narrow Range 7).

The NR4 and NR7 trading strategy

This strategy is basically a modified range breakout strategy where the market consolidates in the beginning and then blasts out of a narrow range.

In NR4, number 4 refers to the period under consideration. That is, for NR4, the last four days are taken into consideration, and for NR7, the last seven days are taken into account.

What is the NR4 and NR7 strategy?

It is a breakout trading technique where we consider the last four or sever days to apply this strategy. And in these four or seven days, we compare the range of all these days and determine if the current day is an NR4 or NR7 day. Once we obtain the NR4 or NR7 day, we gear up to go long or short.

Calculating the range

Firstly, to trade this strategy, consider the candlestick chart on the daily timeframe. The range of a particular day is calculated as the difference between the high price and the low price.

What is the NR4 day and the NR7 day?

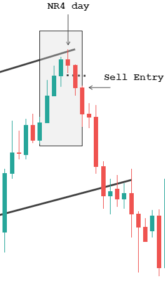
NR4 day

In layman’s terms, the least fluctuated day (4th day) in the recent four days is called the NR4 day. Technically, it is the day whose range is the smallest out of the previous four trading days.

NR7 day

Similarly, when the 7th day in the last seven days moves the least number of pips, it is referred to as the NR7 day.

How to trade the NR4/NR7 strategy?

Following is a set by step procedure to trade this strategy:

  1. Find the high and low of the last few days (seven for NR7 and four for NR4).
  2. Calculate the range (high – low) for each day under consideration.
  3. Compare these range values with the previous days.
  4. Determine if the present day is an NR4 or NR7 day. If so, then wait for the price to break out of the high or low of the NR4/NR7 day.

If the market breaks above the high, then it is an indication for a buy, or if it breaks below the low, then it is an indication for a sell.

Illustration to trade the N-period Narrow Range

Trading the NR4/NR7 strategy is simple. But, as far as the consistency of this strategy is concerned, one can make more out of this strategy only when the NR4/NR7 day appears in the right location. Hence, understanding ‘where’ the NR4/NR7 occurs is very vital. So, let’s consider a few examples to support this statement.

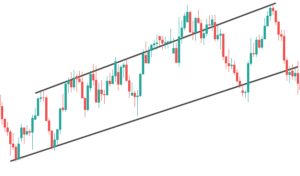
Below is the chart of USD/CAD on the Daily timeframe. We can clearly see that the market is moving in a channel state. Now, to trade this strategy, we blend it with the working of a channel.

Trading a channel is pretty straightforward. When the price is at the bottom of the channel, we look for buying opportunities, and when it is at the top of the channel, we look for short-selling opportunities. With this mind, we try spotting the NR4/NR7 days in these regions.

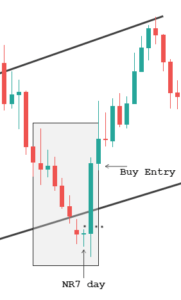
Below is the magnified image of the chart where we’re going to analyze the market. Initially, the market came down rolling until the bottom of the channel and began to hold down there. And the candle which held at the bottom turned out to be the NR7 day as it has the smallest range compared to the previous six days. This is an indication that the market (sellers) is slowing down. Later, the market blasts up north and breaks the high of the NR7 day. Therefore, now we can prepare to go long.

And as we can see, the trade performs exceptionally well. This is because the location was in favor of the NR7 day.

Continuing with the same chart, the market which was at the bottom of the channel now moves up to the top of the channel. During this up move, the market loses its momentum every step of the way and ends up giving us the NR4 day at the top of the Channel. Hence, once the price breaks below the low of the NR4 candle, we can go for the short sell. And as a result, the market does break through the NR4 day and heads down south.

Bottom line

Trading in the markets is not an easy task. There is no indicator, pattern, or strategy that can consistently work standalone. There are several other considerations that should be made before getting into a trade. For example, in the above trades, we saw how we combined the NR4/NR7 with the concept of channels and made a profit from them. Also, for any strategy, you trade, make sure that there is logical reasoning behind taking the trade. We hope you find this strategy informative. If you have any questions, please let us know in the comments below.

Categories
Forex Indicators

Five Great Things you’ve Never Heard about Bollinger Bands


Everybody knows Bollinger Bands, that kind of rivery thing surrounding prices. But almost nobody knows what to do with them. Maybe we can help a bit with that.

1 – Bollinger Bands and Trends

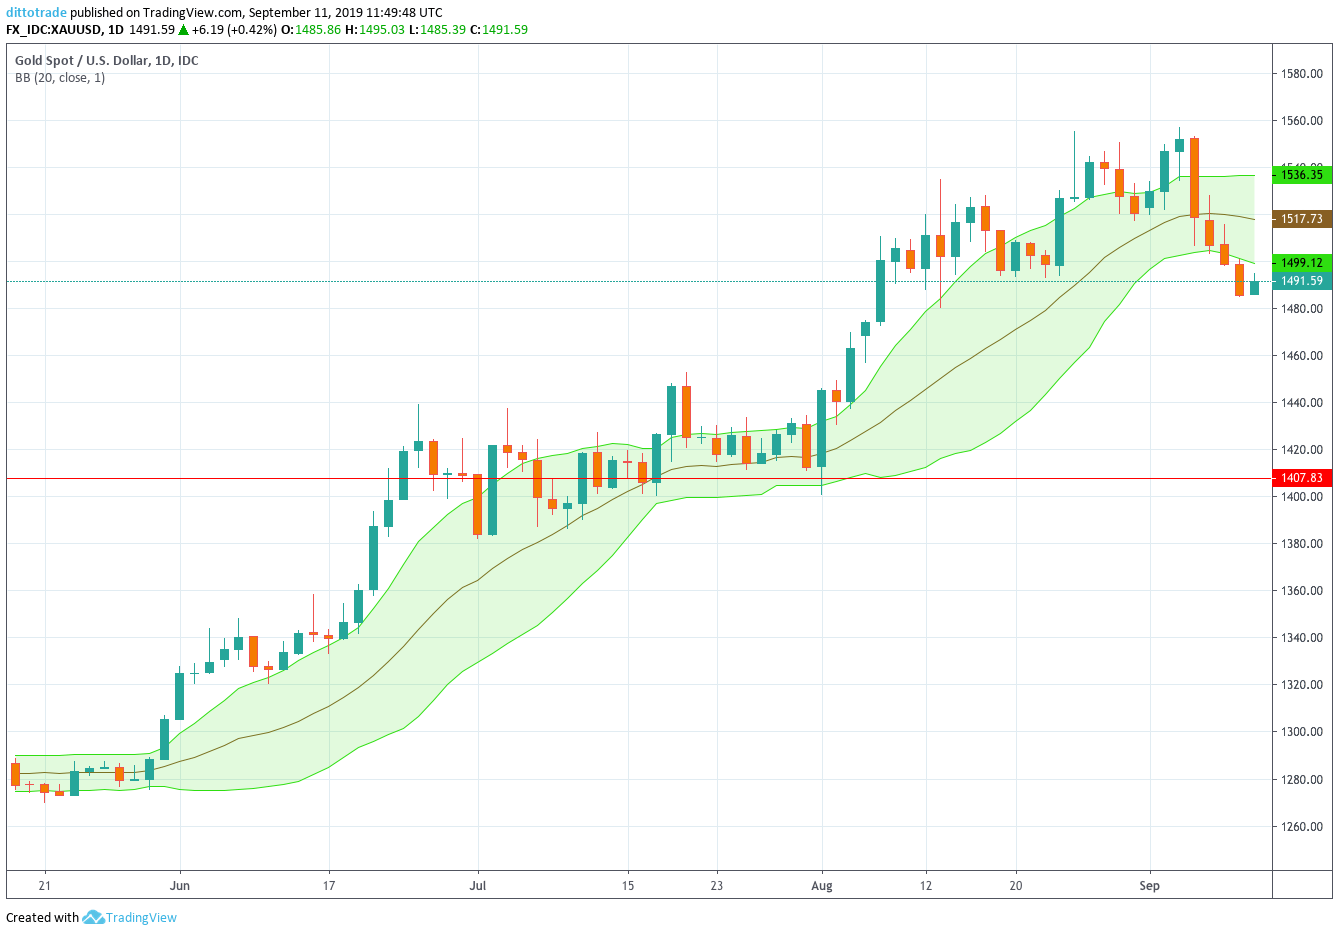
Bollinger Bands are based on Moving Averages. Therefore the central line is the 20-period moving average. As a corollary, if the price of an asset is above the mid-BB-Line, it usually is trending UP. Conversely, if it is below the mid-BB-Line, it tends to be trending down.

Fig 1 – Uptrends see prices moving near the +1 Bollinger line

2 – Bollinger Bands Are more Useful Customized

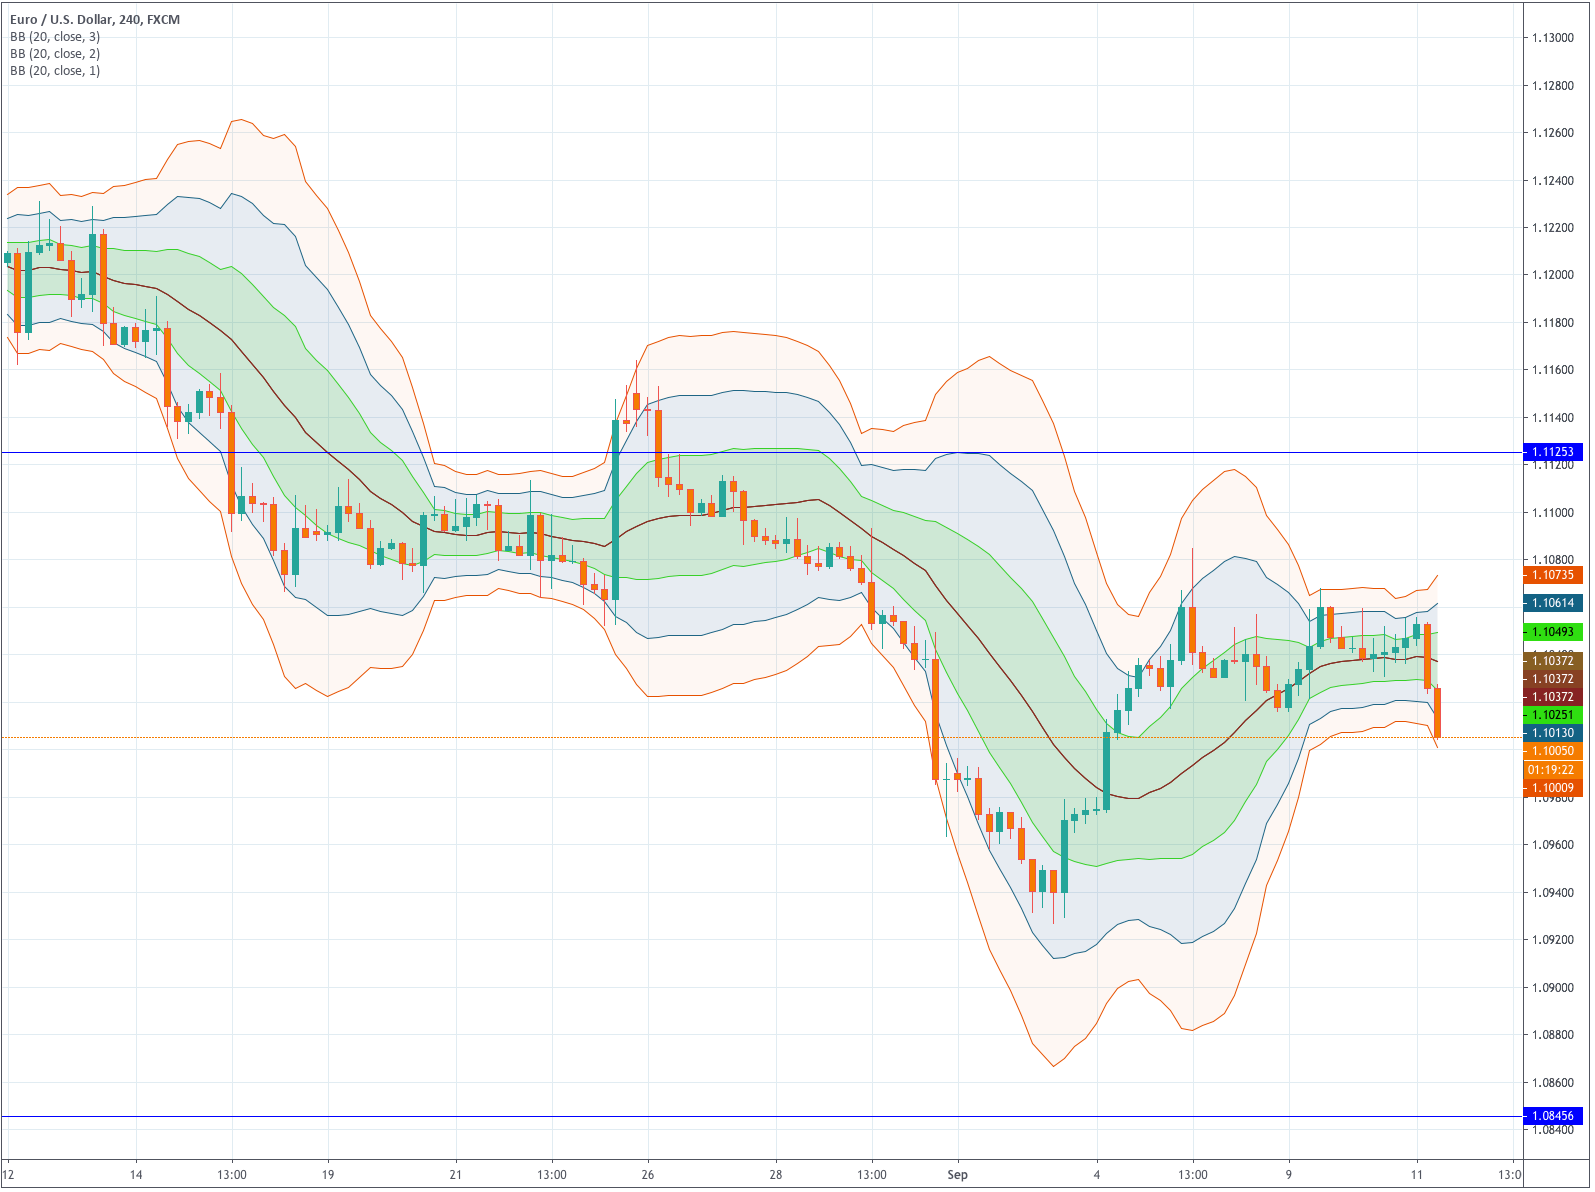
There is no need to use only the standard 2-StDev Bollinger bands. We, as traders, can create different band types. In my case, I use to draw 1-StDev and 3-StDev bands. The reason will come clear in the next bullet point.

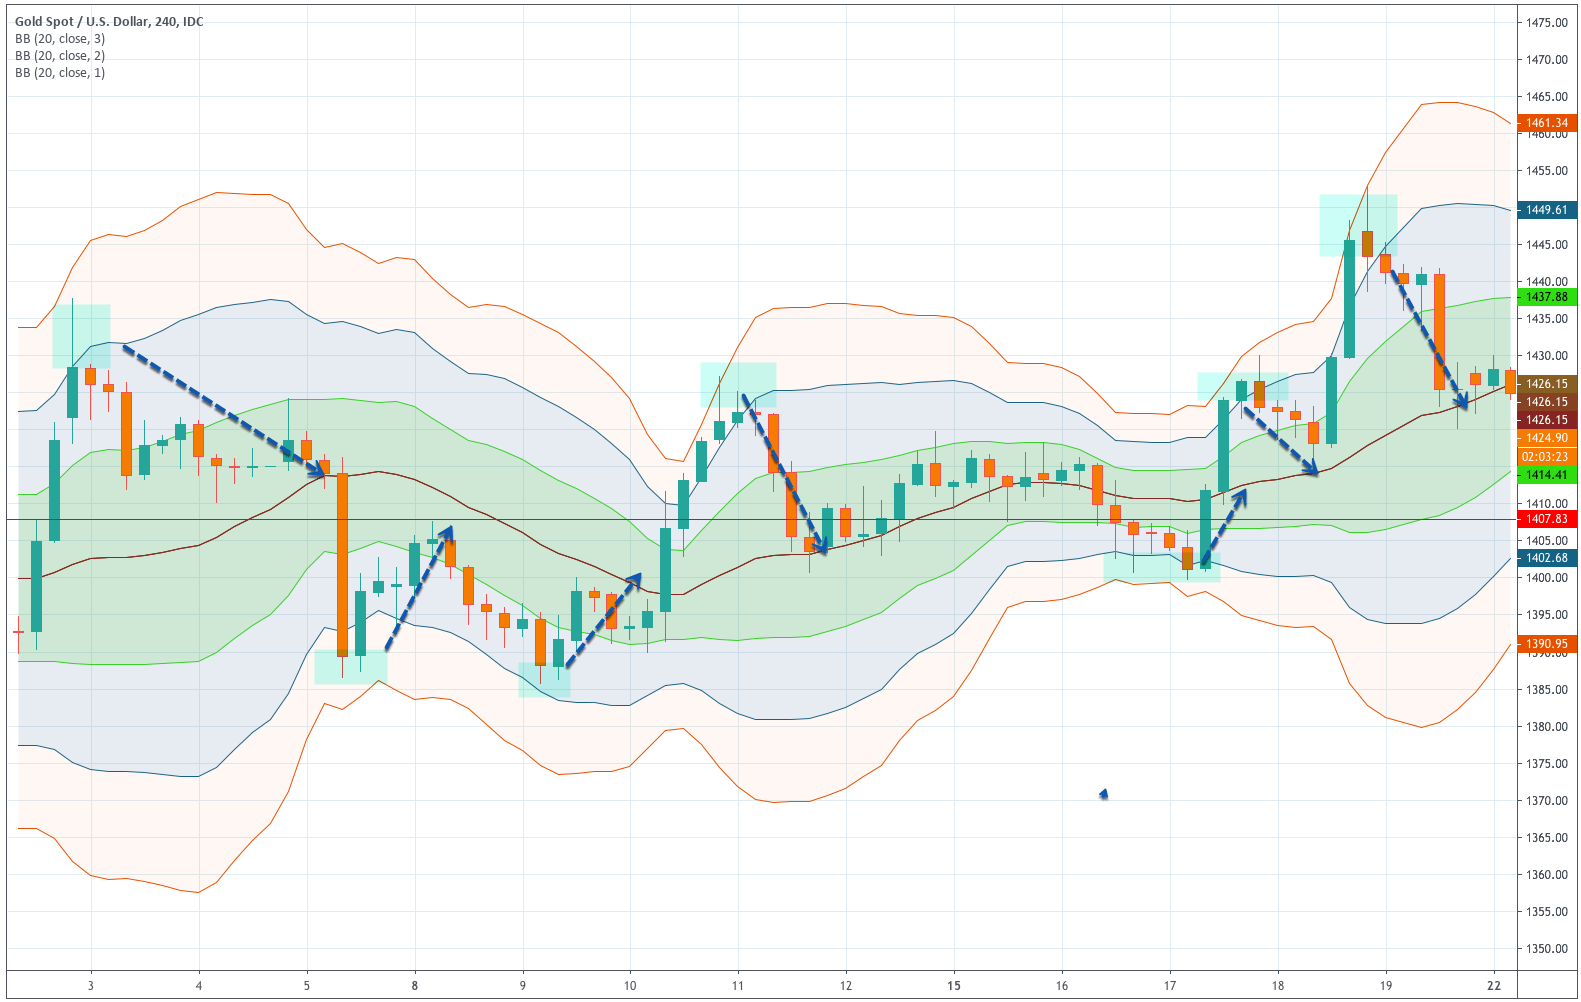
Fig 2 – 1,2 and 3 sigma Bollinger Bands as a Map of the Price Action

3 – Bands and Price Action

Bollinger Bands maps the price action. By that, I mean we can assess how much the price is away from the mean. If we think of the mean price as the consensus of value at a particular moment, Bollinger bands help evaluate if the asset is overpriced or underpriced and profit from that information. That is so because the lines are pictured at a standard distance from the mean.

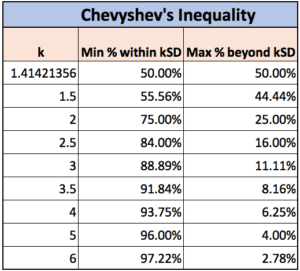
There is one theorem about a broad class of probability distributions called Chebyshev’s inequality (also called Bienaymé–Chebyshev inequality). The Chevyshev’s inequality guarantees that there is a minimum of data values within a certain distance from the mean value of a distribution. And it does not need to be a normal or bell-shaped distribution for this theorem to hold. It only needs to have a finite average.

From these figures, we can see that if we spot prices moving beyond the +2 Bollinger line, there is a 75% chance the price moves back. If that price extension goes to the +3 BB-Line the chance of it retracing is 89% and so on. That applies to the negative side as well so, prices below -2BB-line and -3BBline have 75% and 89% chance of reversing.

That means Bollinger bands are terrific overbought and oversold indicators. Consequently, it pays to have visible at least a couple of bands in our charts. There bands: +1, +2 and +3 Sigma bands will map your price action beautifully.


4 – Prices Tends to Visit the Mean

From the extremes, the price tends to find support on its Mean price. That means the price tends to visit the mean Bollinger line before resuming the trend (of course, this also happens when the trend changes). One recurring pattern is for the price to move beyond +2 BB-line, creating one or two candlesticks with a large upper wick and closing lower. Then, the following candles move steadily back (or sideways) to visit the mid-BB line, and then start a new leg up. That also applies to downward trends. The price moves below the -2BB-line and even the -3BBline and then creates a large lower wicked candlestick to, then, move back to the mean.

Since the mean is a moving average, the mean continues moving up or down in the subsequent bars, so, it is not uncommon that the price moves quite horizontally as can be seen on the chart.


5- From Impulses to Corrections

Bollinger Bands warns about pauses and the end of a trend. It also warns about the continuation of the trend.

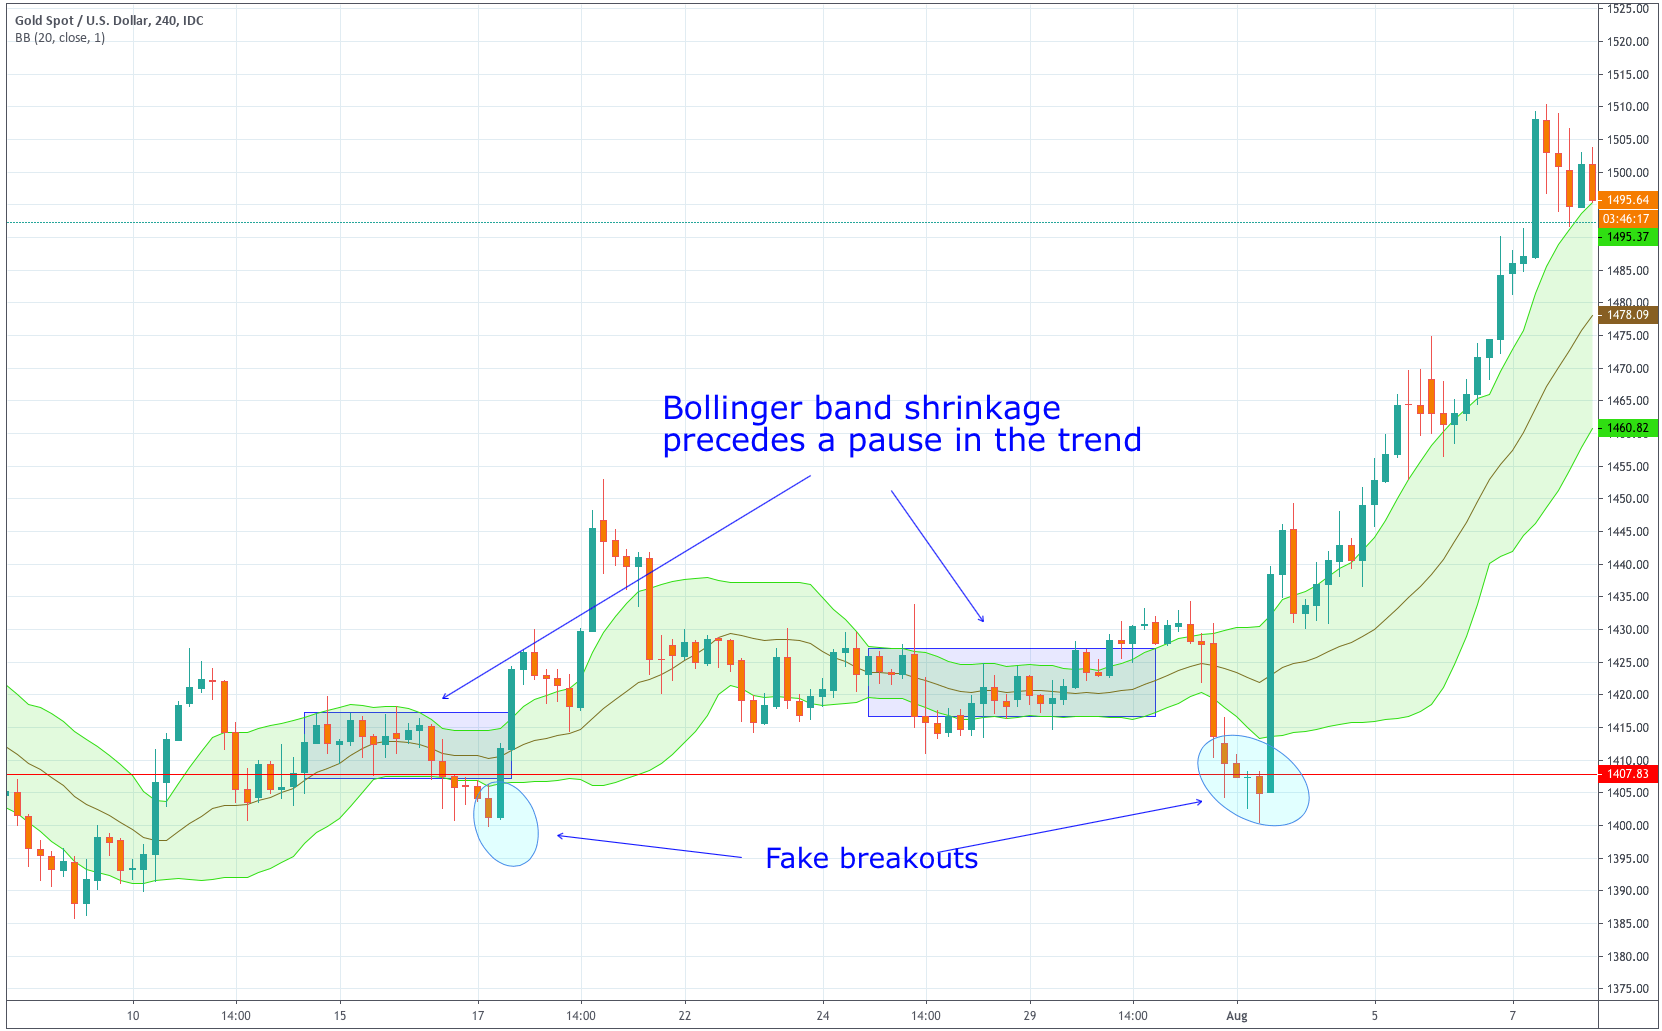
Bollinger Bands expand with volatility and shrink with le lack of it. When we spot that the Bollinger bands are starting to shrink, it is almost sure the trend has stopped moving. It might be a consolidation period or a reversal. Therefore, band shrinkage is a flag for traders to take some profits out of the table.

Sideways range-bound movements make the bands shrink. When a breakout of the range occurs, the bands expand, signaling a new period of increased volatility and price movements.