Introduction
In the previous chapter, we understood the different states that exist in the market, which were trends, ranges, and channels. In this and the upcoming lessons, we shall go over each one of the types in detail.
What is a Trending Market?
A trending market is the type of market where the prices move in one specific direction. Of course, the prices change the direction temporarily, but the overall direction will still be in one direction.
Since there are two directions in the market, there are two types of trends: one facing upward and the other facing downward. The former is referred to as an uptrend, and the latter is called a downtrend. Having that said, there are some rules and criteria to confirm a market is trending.
How to Identify a Trend?
There are quite a number of ways to identify and confirm a trend. One can use price action patterns or technical indicators to identify if a market is trending.
Price Action pattern
The concept of highs and lows on the price charts is used to determine if the market is trending upwards or downwards.
Uptrend
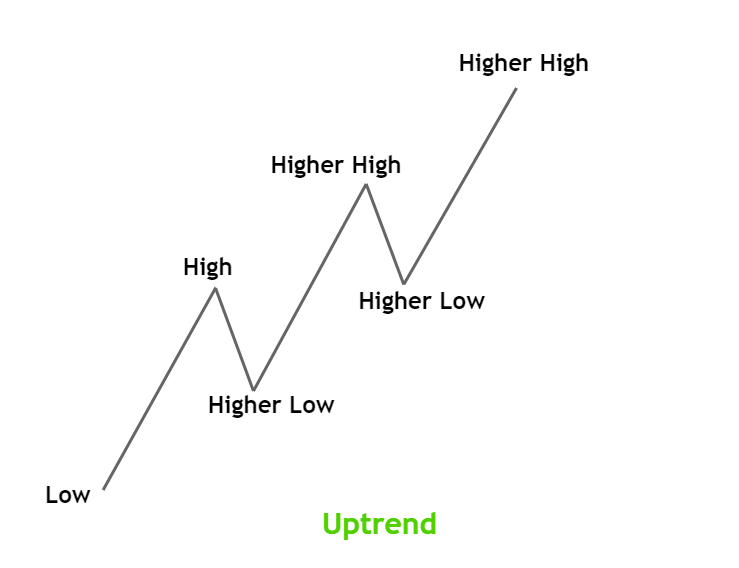
In an uptrend, the market makes higher highs and higher lows. Multiple sequences of this pattern confirm that the market is trending up.
Downtrend
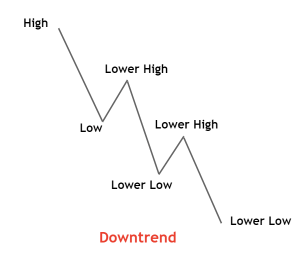
In a downtrend, the price makes multiple sets of lower lows and lower highs.
ADX Indicator
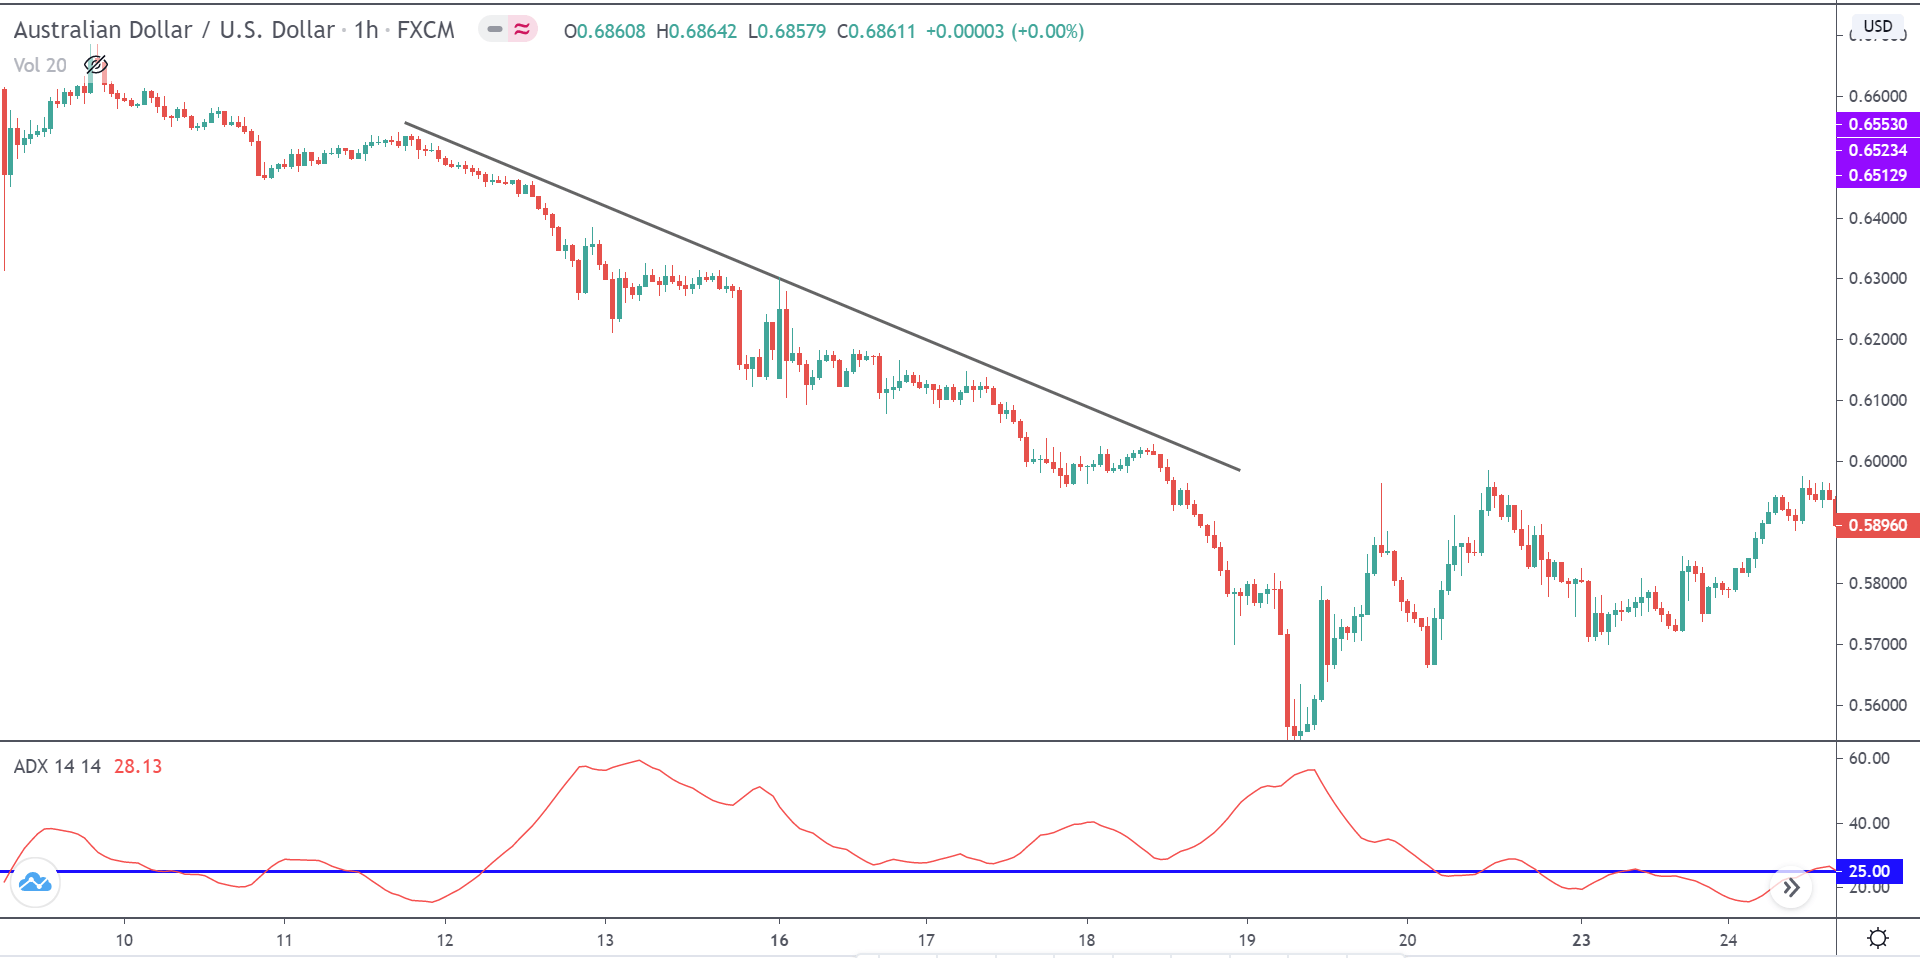
Another way to determine if a market is trending is by applying the Average Directional Index (ADX) indicator. It was created by J. Welles Wilder, where the indicator has values between ranging between 0 and 100. The magnitude of the value determines the strength of the trend. The larger the number is, the stronger the trend.
Typically, a value greater than 25 indicates that the market is in a strong trend, either uptrend or downtrend. It is a non-directional indicator, where the value is always positive irrespective of the direction.
Note that ADX is a lagging indicator and does not really determine the future of the market. Thus, it cannot be employed for timing your entries and exits.
Moving Average
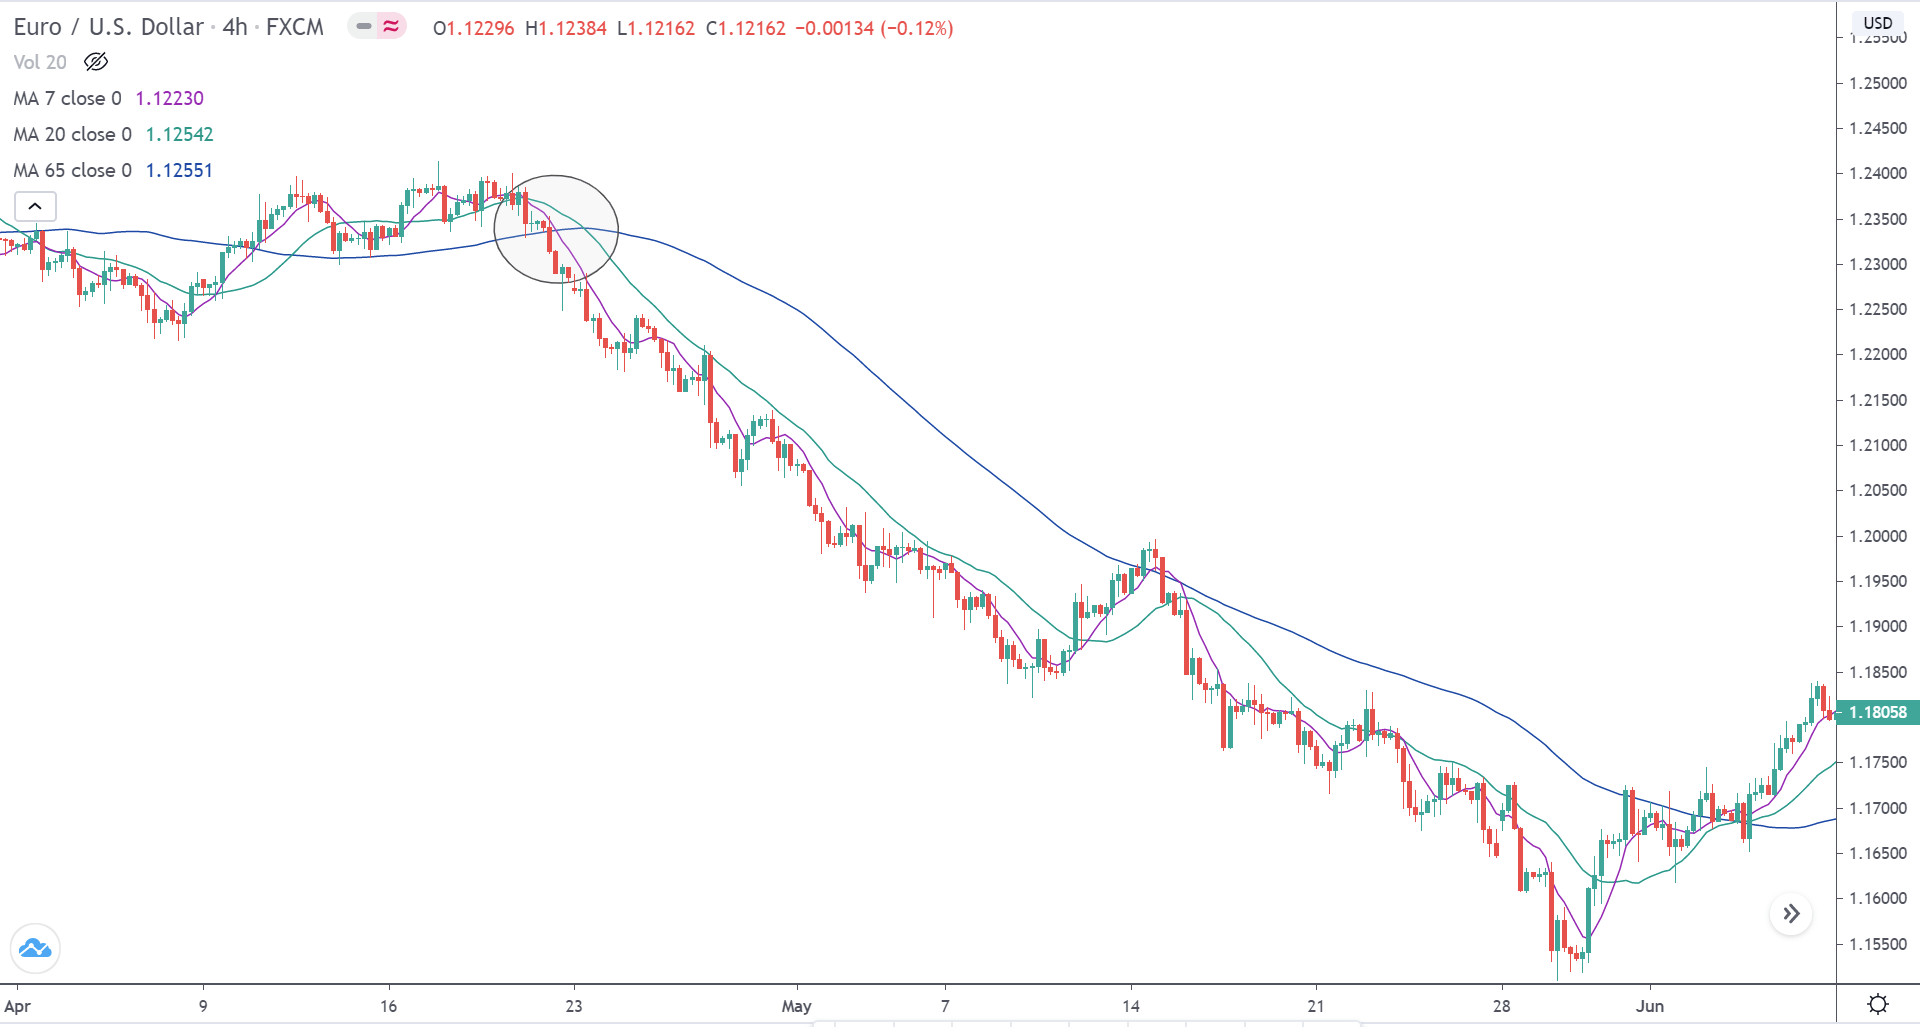
Simple moving averages can also be used to determine if the market is in a trending state. Add the 7 period, 20 period, and the 65-period MAs on the price chart. When all three MAs compresses and fans out, and if 7 period MA is below the 20-period MA and 20 period MA is below the 65-period MA, then it confirms that the market is in a downtrend.
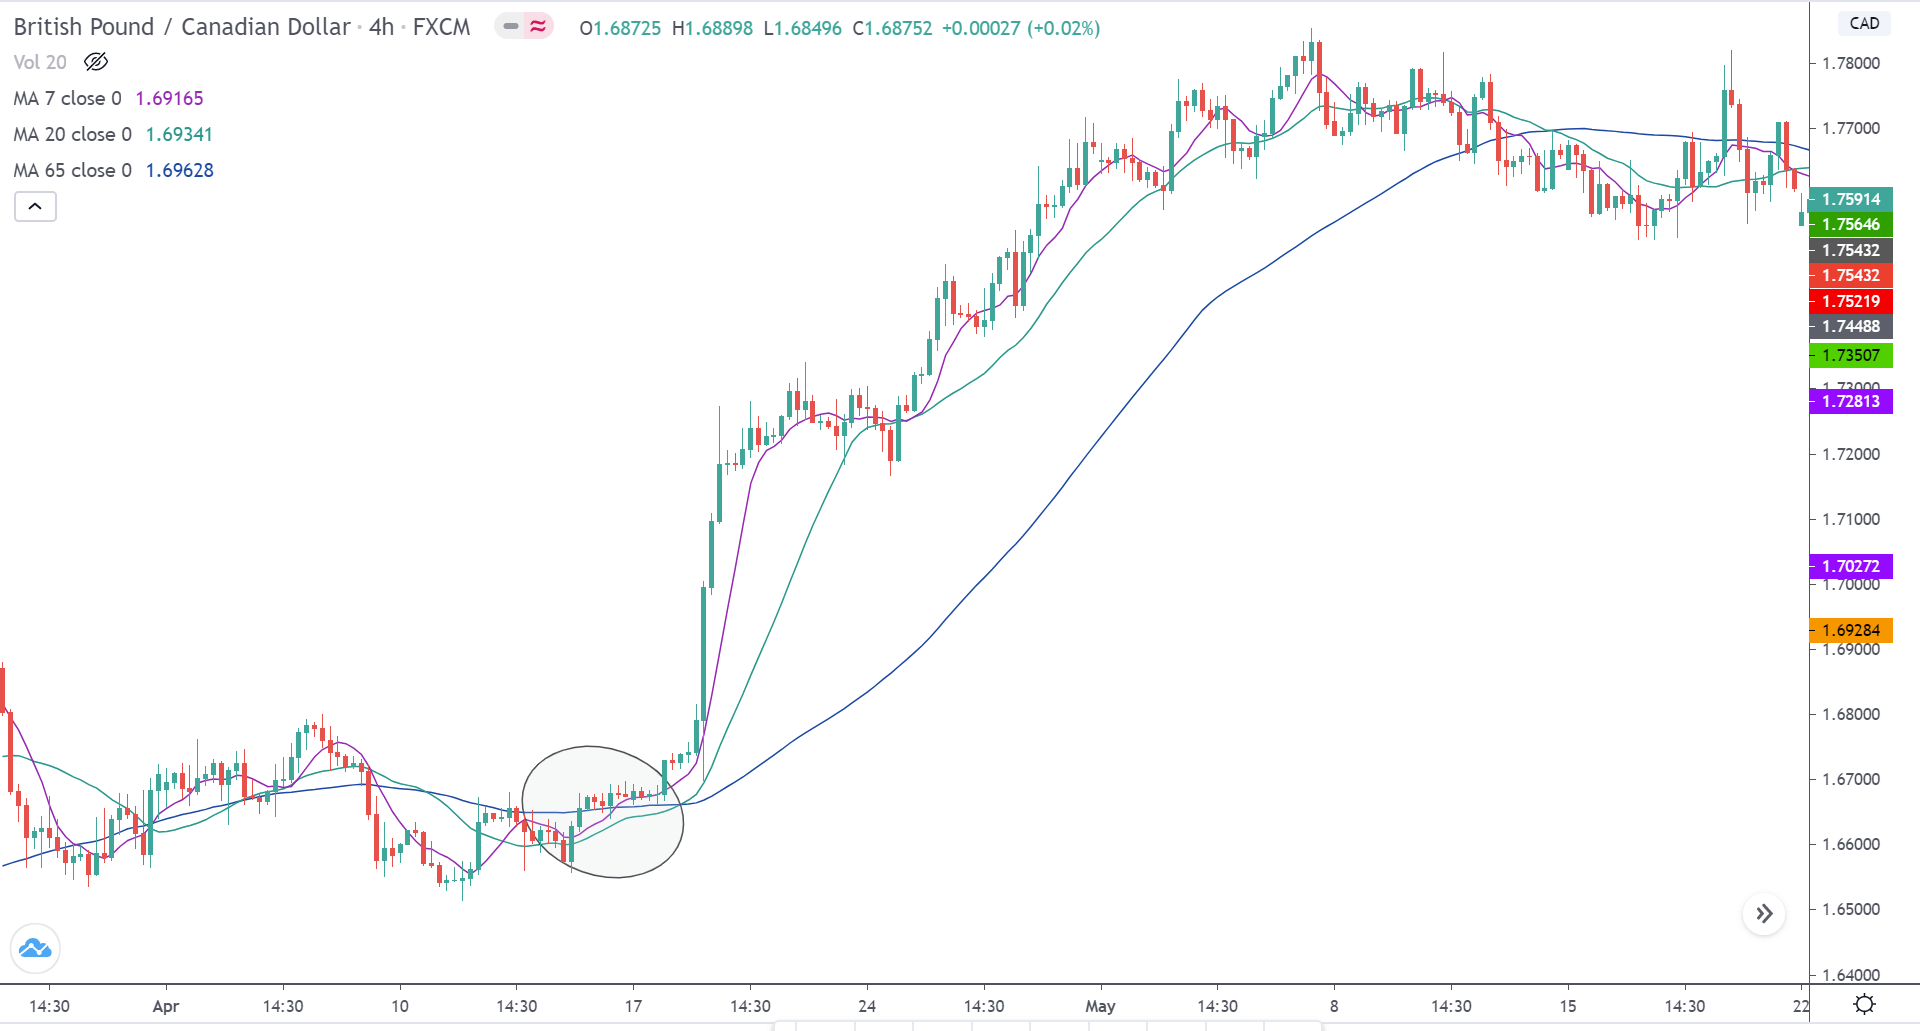
Conversely, if the 7 period MA is above the 20 period MA and the 20 period MA is above the 65-period MA, then the market is officially in an uptrend.
These were some of the most popular techniques to identify and verify whether the market is trending. However, they are not strategies to trade a trend. Nonetheless, they can be used to give heads up to any trend trading strategies. [wp_quiz id=”78831″]


