Categories
Forex Course

135. All About The Trending Market

Introduction

In the previous chapter, we understood the different states that exist in the market, which were trends, ranges, and channels. In this and the upcoming lessons, we shall go over each one of the types in detail.

What is a Trending Market?

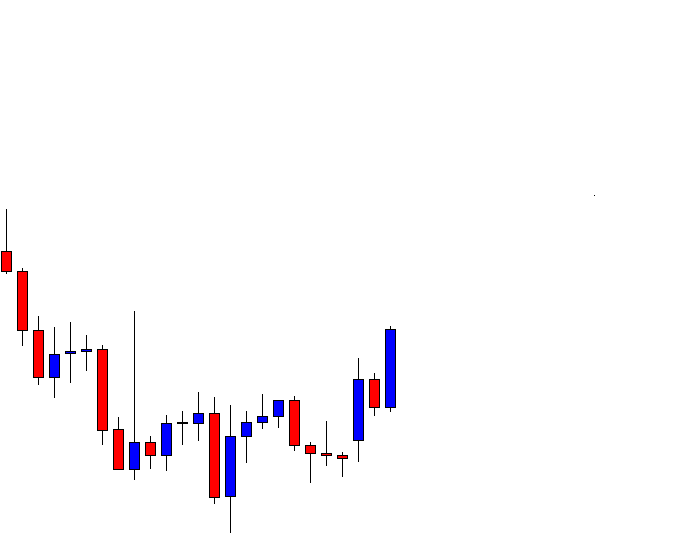
A trending market is the type of market where the prices move in one specific direction. Of course, the prices change the direction temporarily, but the overall direction will still be in one direction.

Since there are two directions in the market, there are two types of trends: one facing upward and the other facing downward. The former is referred to as an uptrend, and the latter is called a downtrend. Having that said, there are some rules and criteria to confirm a market is trending.

How to Identify a Trend?

There are quite a number of ways to identify and confirm a trend. One can use price action patterns or technical indicators to identify if a market is trending.

Price Action pattern

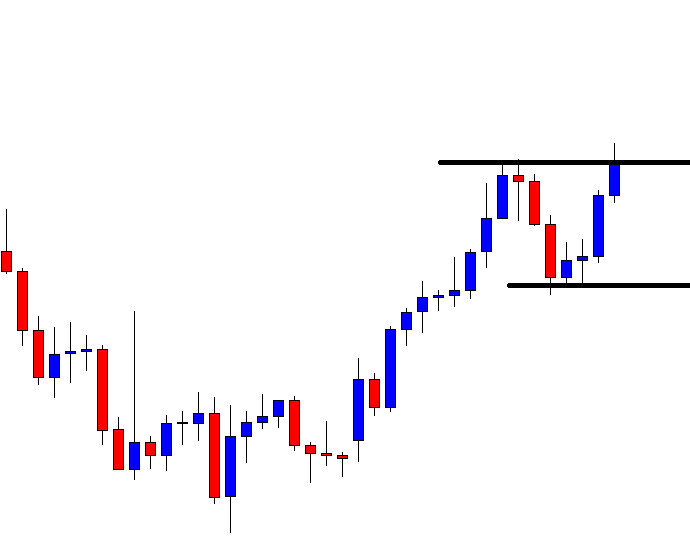
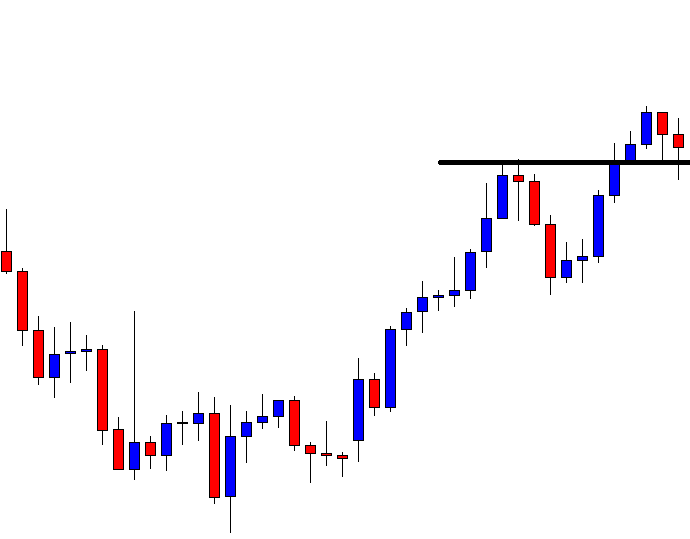
The concept of highs and lows on the price charts is used to determine if the market is trending upwards or downwards.
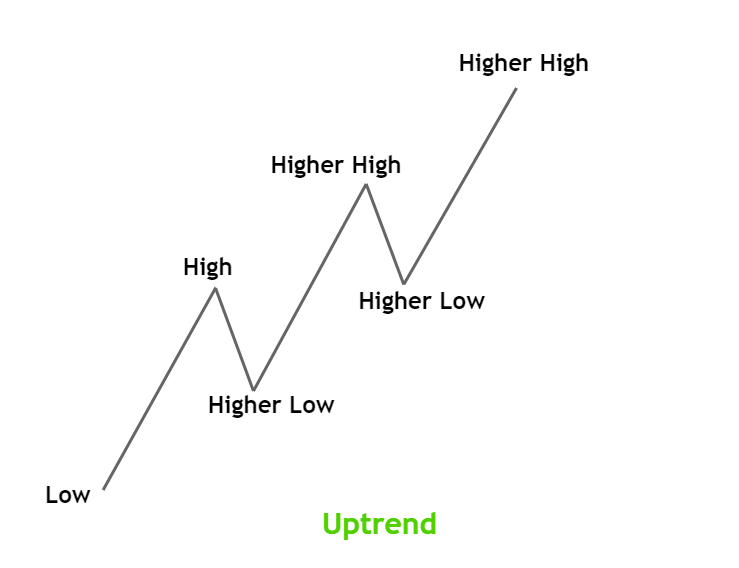
Uptrend

In an uptrend, the market makes higher highs and higher lows. Multiple sequences of this pattern confirm that the market is trending up.
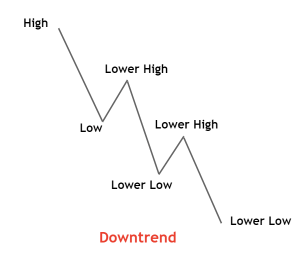
Downtrend

In a downtrend, the price makes multiple sets of lower lows and lower highs.

ADX Indicator

Another way to determine if a market is trending is by applying the Average Directional Index (ADX) indicator. It was created by J. Welles Wilder, where the indicator has values between ranging between 0 and 100. The magnitude of the value determines the strength of the trend. The larger the number is, the stronger the trend.

Typically, a value greater than 25 indicates that the market is in a strong trend, either uptrend or downtrend. It is a non-directional indicator, where the value is always positive irrespective of the direction.

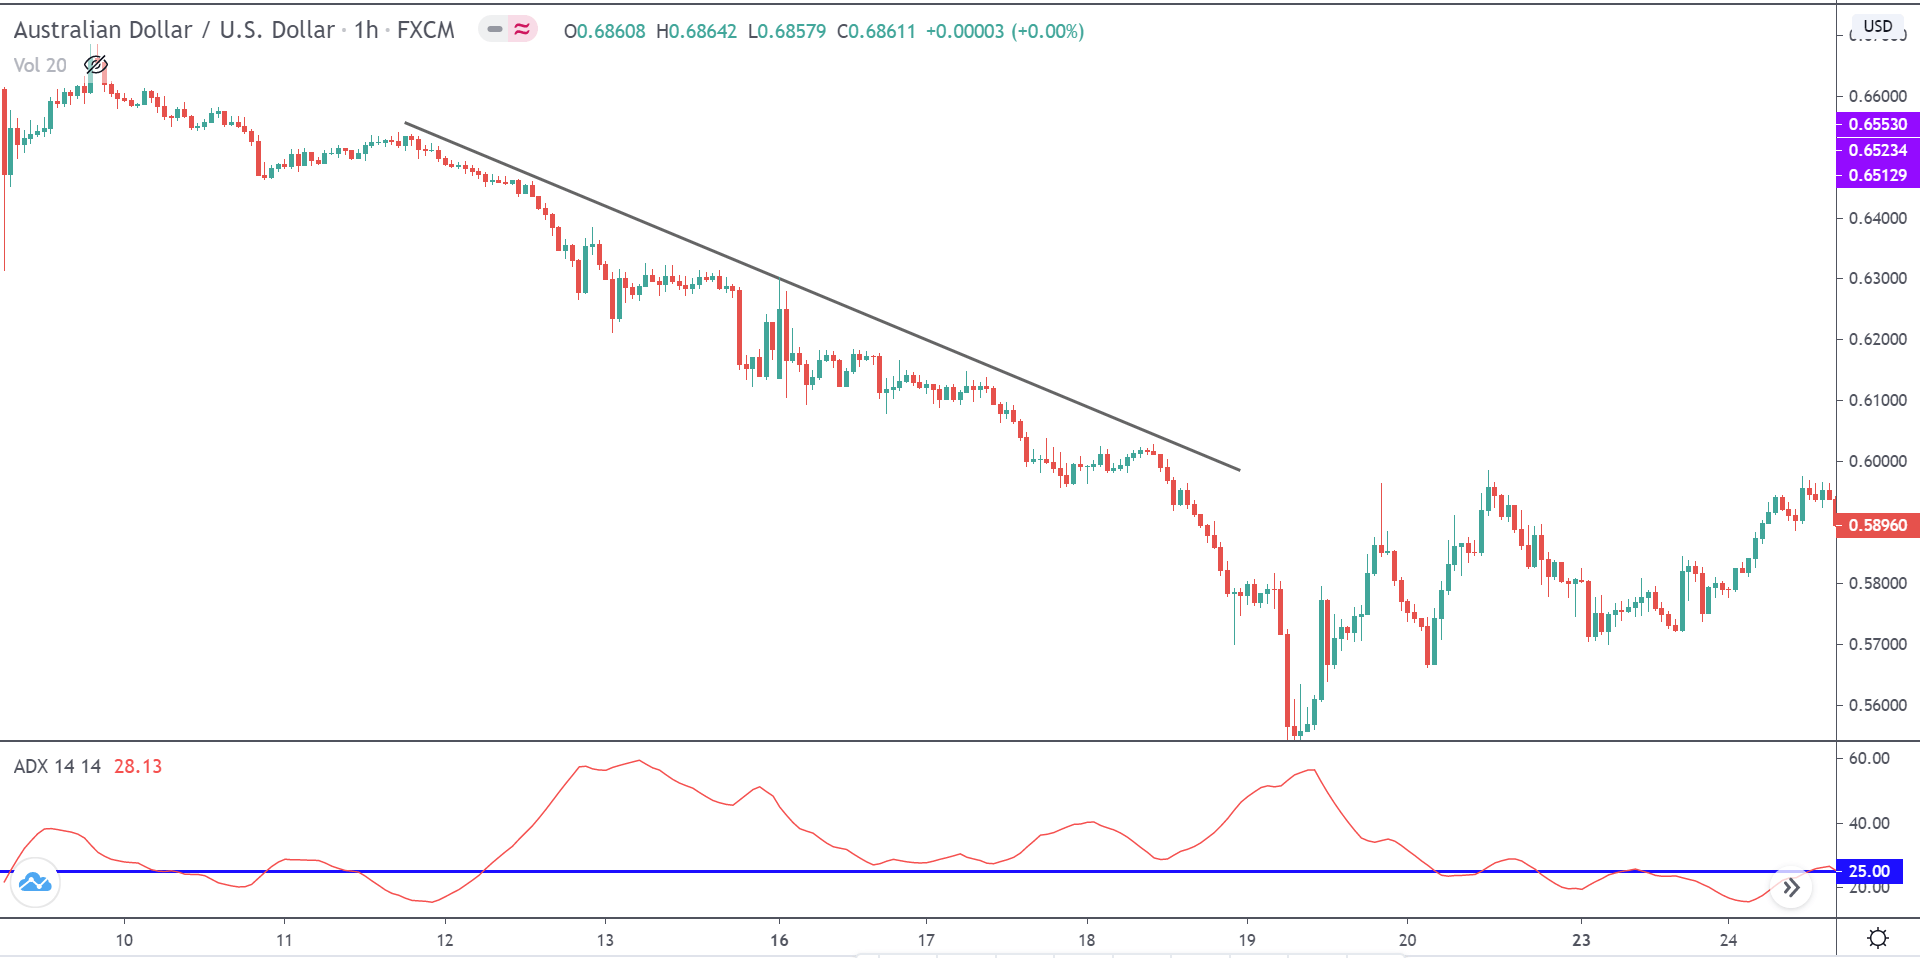
Note that ADX is a lagging indicator and does not really determine the future of the market. Thus, it cannot be employed for timing your entries and exits.

Moving Average

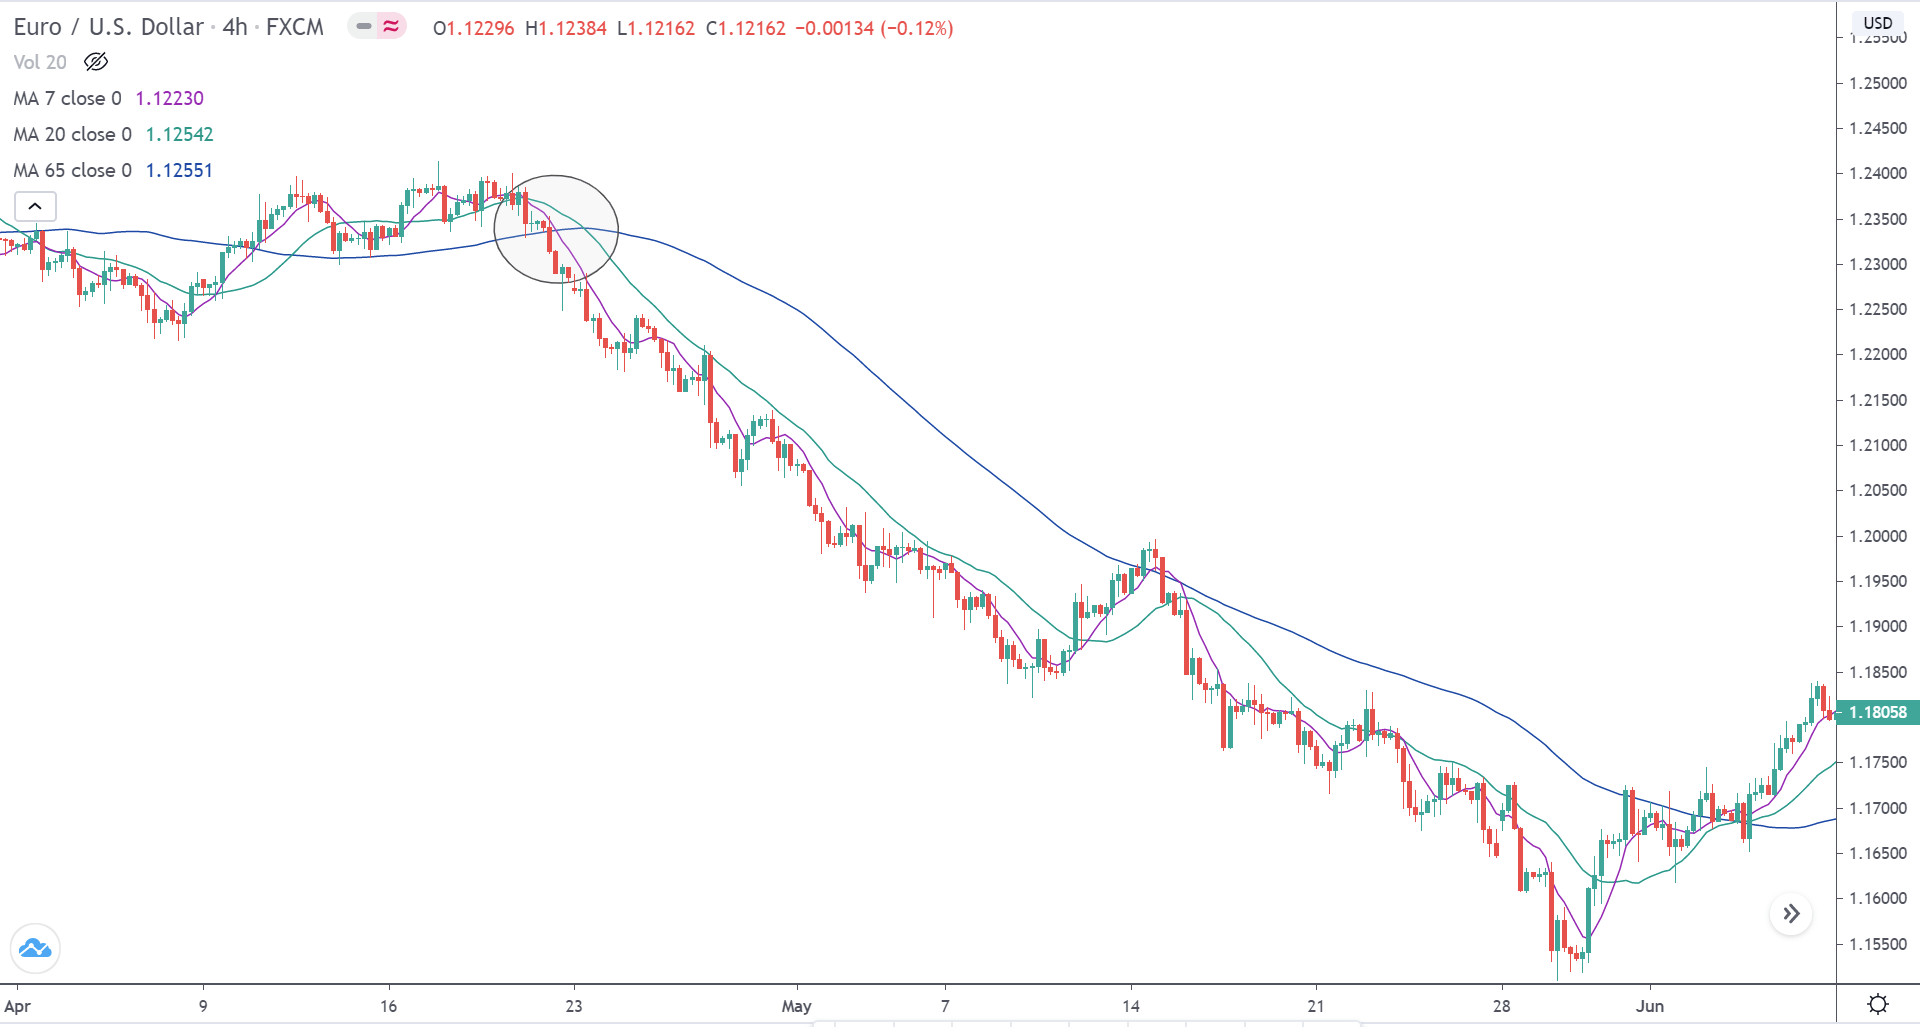
Simple moving averages can also be used to determine if the market is in a trending state. Add the 7 period, 20 period, and the 65-period MAs on the price chart. When all three MAs compresses and fans out, and if 7 period MA is below the 20-period MA and 20 period MA is below the 65-period MA, then it confirms that the market is in a downtrend.

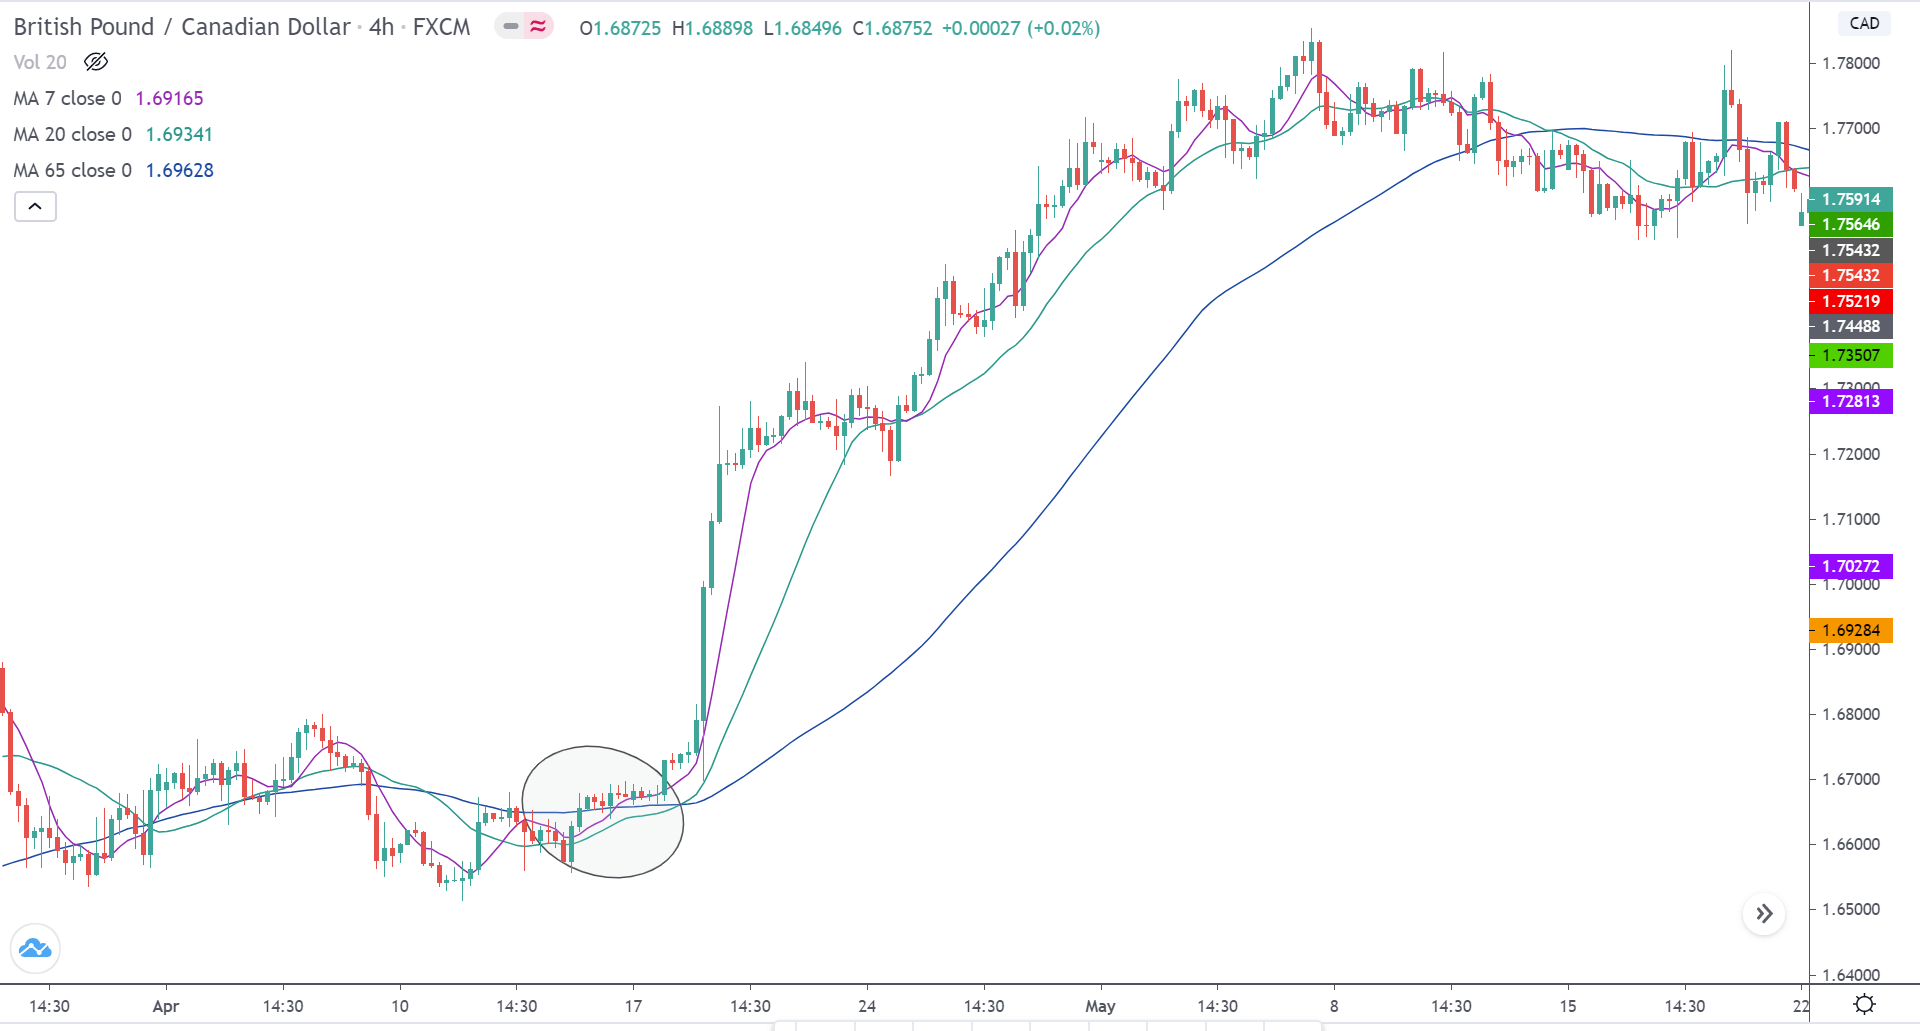
Conversely, if the 7 period MA is above the 20 period MA and the 20 period MA is above the 65-period MA, then the market is officially in an uptrend.

These were some of the most popular techniques to identify and verify whether the market is trending. However, they are not strategies to trade a trend. Nonetheless, they can be used to give heads up to any trend trading strategies.

[wp_quiz id=”78831″]
Categories
Forex Daily Topic Forex Price-Action Strategies

Example of a Breakout Unfit for an Entry


In today’s lesson, we are going to demonstrate an example of a breakout on the H4 chart. The chart shows that the price heads towards the North with good momentum. It makes a bullish breakout upon consolidation. However, the breakout is not the kind that the breakout traders look for. Thus, this is going to be an example which we should skip taking entry. Let us now have a look at what happens.

The chart shows that it produces a bullish candle followed by a bearish inside bar. The next candle comes out as a bullish engulfing candle. Do you notice something here? Yes, this is an entry for the buyers. However, this is not where we concentrate today. Let us proceed to the next chart to dig out the main story.

The price keeps going towards the North. The buyers are to wait for the price to consolidate and produce another bullish engulfing candle to offer them entry. The way it has been going, it seems that the buyers hold the key and dominate over the sellers.

The price makes a bearish correction and finds its support. The first bullish reversal candle comes out as a bullish inside bar. This is not a strong bullish reversal candle. It produces three more bullish candles but the price does not make a breakout at the level of resistance. The last candle closes within the level of resistance, which is a point to be noticed. It means even the next candle makes a breakout, it would be a breakout right from the level of resistance.

The next candle closes well above the level of resistance. This is a breakout but not the kind of breakout that the breakout buyers wait for. The price is trending towards the upside; it consolidates and makes a bullish breakout. These three equations suggest that the buyers may take a long entry. They must not forget that the breakout candle does not make an explicit breakout. If a breakout takes place by one bullish engulfing candle that brings momentum. Over here, it needs four candles to make the breakout. Moreover, the breakout candle forms right at the level of resistance (now support). The buyers may restrain themselves from taking such entry. Let us find out what the price does next.

The price comes back to the breakout level. This is what usually happens when the price does not make a breakout with an A+ breakout candle. The price may still head towards the North, but 1 out of 3 times, it may come back in and hits the stop loss. Thus, to have winning consistency, we might as well skip taking entry in such price action.

Categories
Forex Course

46. Analyzing the Forex Market: Sentimental Analysis

Introduction

Have you come across the saying that 95% of the traders lose money in Forex, and only a handful of 5% succeed? As a matter of fact, this statement is entirely true. Though trading in the Forex market is no different from doing business in the real market, most of the Forex traders find it challenging to succeed in trading. This is because, in the real world business, there is hardly any relation between business and emotions, whereas, the Forex market is closely related to human psychology.

Many traders trade based only on fundamental analysis or technical analysis and ignore the existence of the sentiment involved in trading. This is the reason we have the concept of 95% and 5%.

Why is there sentiment entailed in trading?

To answer this particular question, we’ll have to understand the core basics of trading.

Firstly, what is trading? Trading, according to the textbooks, is the process of buying and selling of products. Or in simple terms, it is the process where a seller sells his products to a buyer, or a buyer buys products from a seller.

Now, the point one must note here is that to buy or sell a product, both parties (buyer and seller) are obligatory. Without a buyer, the existence of a seller is useless, and without a seller, the presence of a buyer is pointless.

And this above concept is the answer to the above question. Let us understand how.

There is an end number of traders trading the Forex market. The logic for buying and selling is the same as the real-world market. That is, a trade cannot be completed without the presence of both parties. For example, if you want to buy a currency pair, then you mandatorily need a seller to sell it to you. And if there are no sellers in the market to sell it at your desired price, then your buy order will remain pending (incomplete).

Broadly speaking, traders can be segregated into two types. The first set of traders includes large banks, hedge funds, mutual funds, and big-time investors who move the market. And the second set comprises small retail traders who do not have the capability (enough capital) to drive the market.

How do big players always win?

Big players are the ones who always win in the market. And they make this possible by bringing in emotions in trading. Let us understand this with an example.

Let’s say a currency pair is in an uptrend from a month. At this point in time, what do you think the whole world is thinking? As obvious as it gets, most retail traders are looking at it as a buy. Now, since everyone (big players and retail traders) are looking to buy, there is no seller to sell it to them. This situation, in turn, creates loads of pending orders in the market. So, the masterminds (big players) start to become the sellers in the market to the retail buyers. And this continuous selling by the big players causes the market to drop pretty drastically.

Seeing this drastic fall in the market, all retail traders who were buying get stopped out, and the rest begin to look it as a sell. And once the retail traders start to sell, the big players buy it from these sellers (retail traders). Hence, from this, the market again starts to head north. This is how big players bring in emotion in the minds of the public, manipulate them in the market.

Finally, we can conclude by saying psychology plays a major rule when it comes to trading in the Forex market. And the sentimental analysis is all about learning more about psychological trading. So in our further lessons, we will be discussing a lot more on these topics.

[wp_quiz id=”57167″]