Categories
Forex Basic Strategies

Top 3 Terrific Ways To Trade Price Channels Like A Pro

Introduction

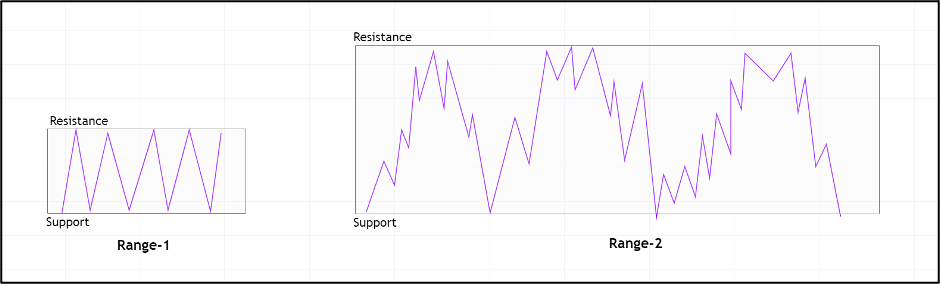
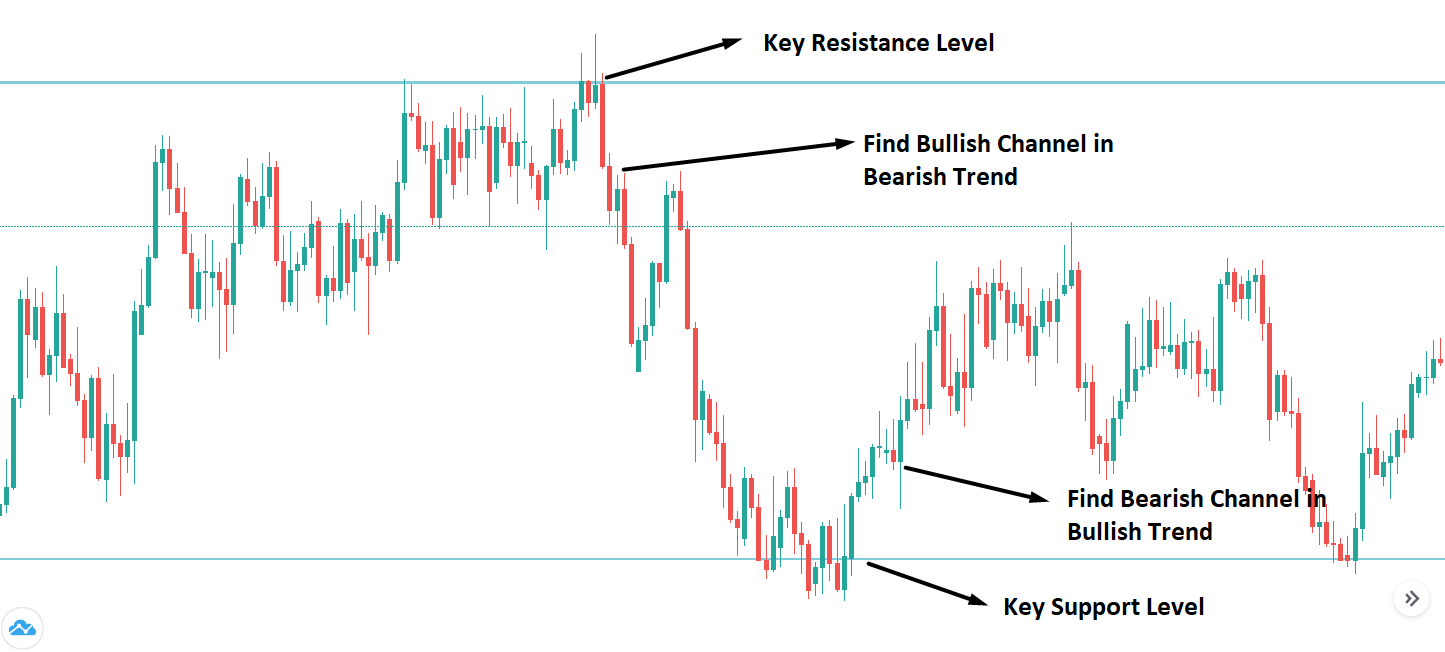
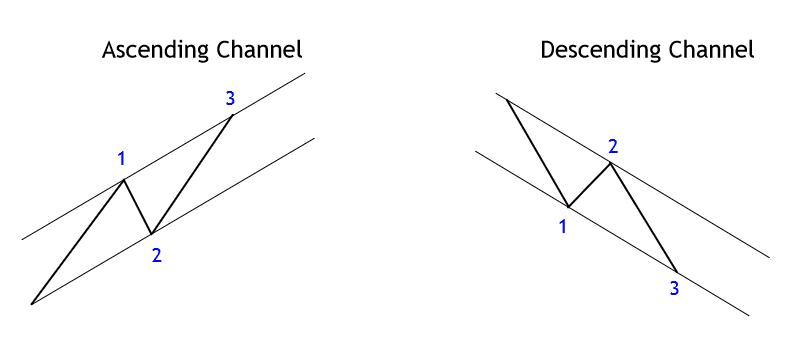
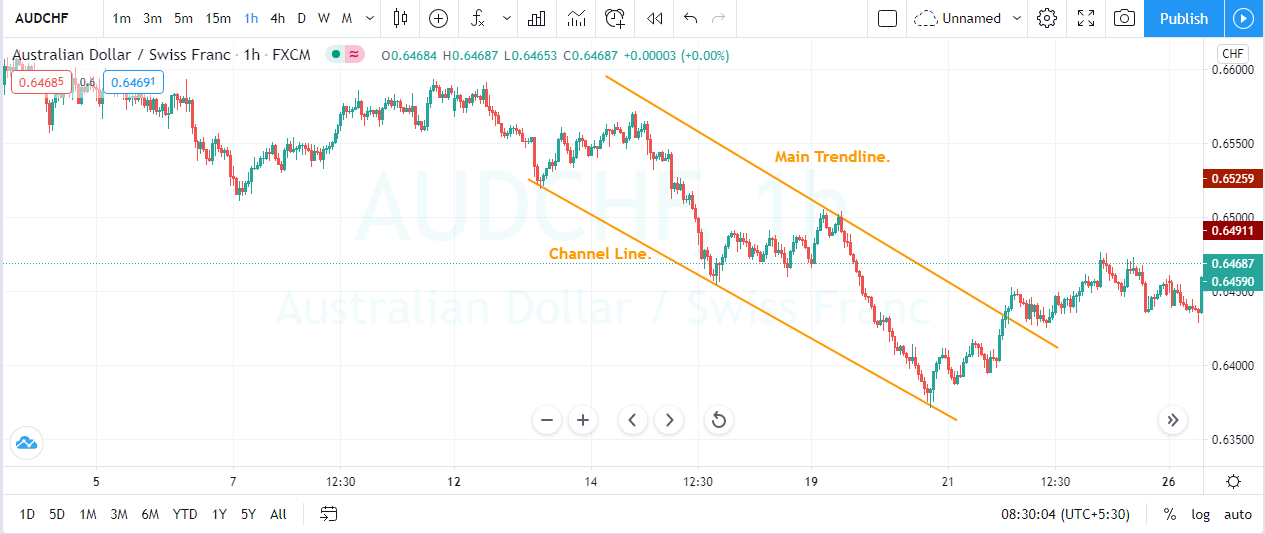
A price channel is a state of the market that slopes up or down bounded by a trendline above and below the asset’s price. The upper trend line acts as a resistance to the price, while the lower trend line acts as support. The price channel helps traders maintain the focus on the price alone, unlike the other trading tools, which are plotted directly over the price chart. In an uptrend, as long as the price advances and moves within the channel, the underlying asset trend is considered bullish. The break below the channel line is a sign of the trend being reversed. Two main components of the price channel are the Main Trend Line & the Channel Line.

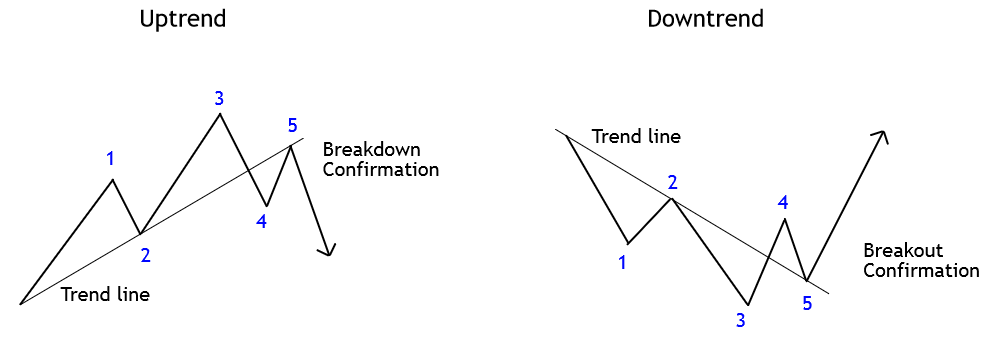
Main Trend Line – It takes a minimum of two to three points on the price chart to draw the trend line. The line sets the tone for the price slop as well as the trend. To draw a bearish trend line, we need at least three reaction points at the highs. To draw a bullish trend line, we also need two to three reaction lows on the price chart.

Channel Line – After drawing the main trend line, we draw the channel line parallel to the main trend line. For drawing the channel line, we also need two to three reaction highs and reaction lows in accordance with the trend. This channel line also acts as a support in an uptrend and resistance in a downtrend.

Trading Strategies To Trade The Price Channel

Trends + Channel

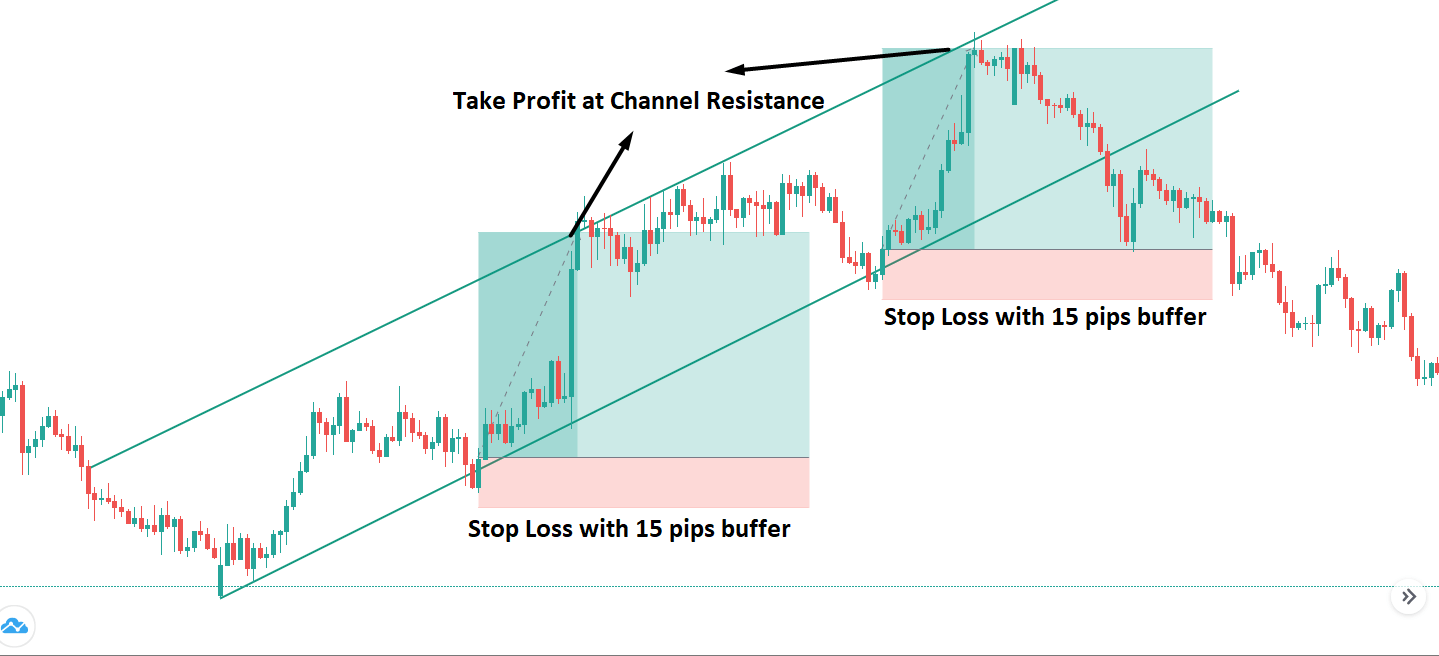
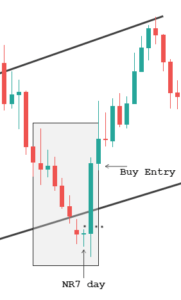
Channels are perfect to trade the pullback markets. It is advisable to look for the price channel that is sloping at a healthy angle. Don’t try to trade the steep or flat channels as they won’t provide good trading opportunities.

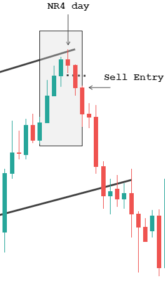
Firstly find a trending market and mark at least two reactions of highs and lows. For taking buy entries, wait for the price to touch the channel line and for selling trades, wait for the prices to touch the main trend line. Remember not to trade both buy and sell opportunities in an up-trending market. This approach is used by amateur traders who fail most of the time as we are going against the flow.

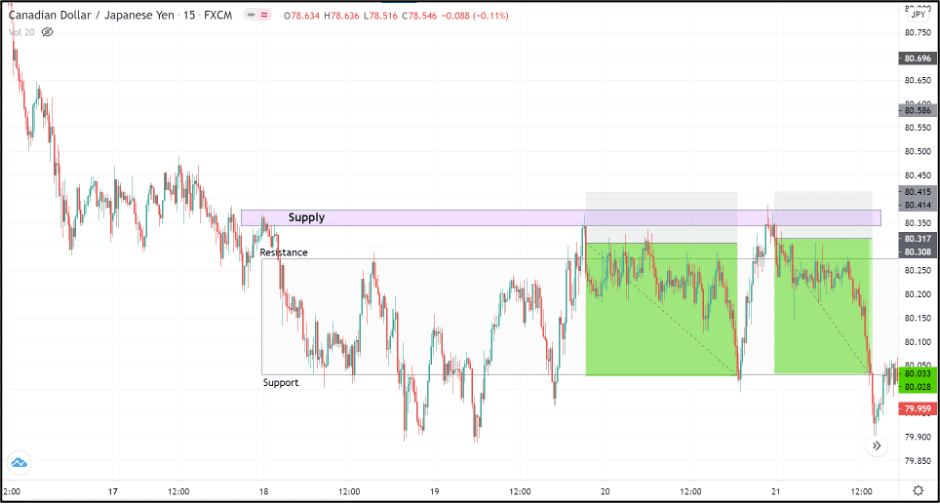
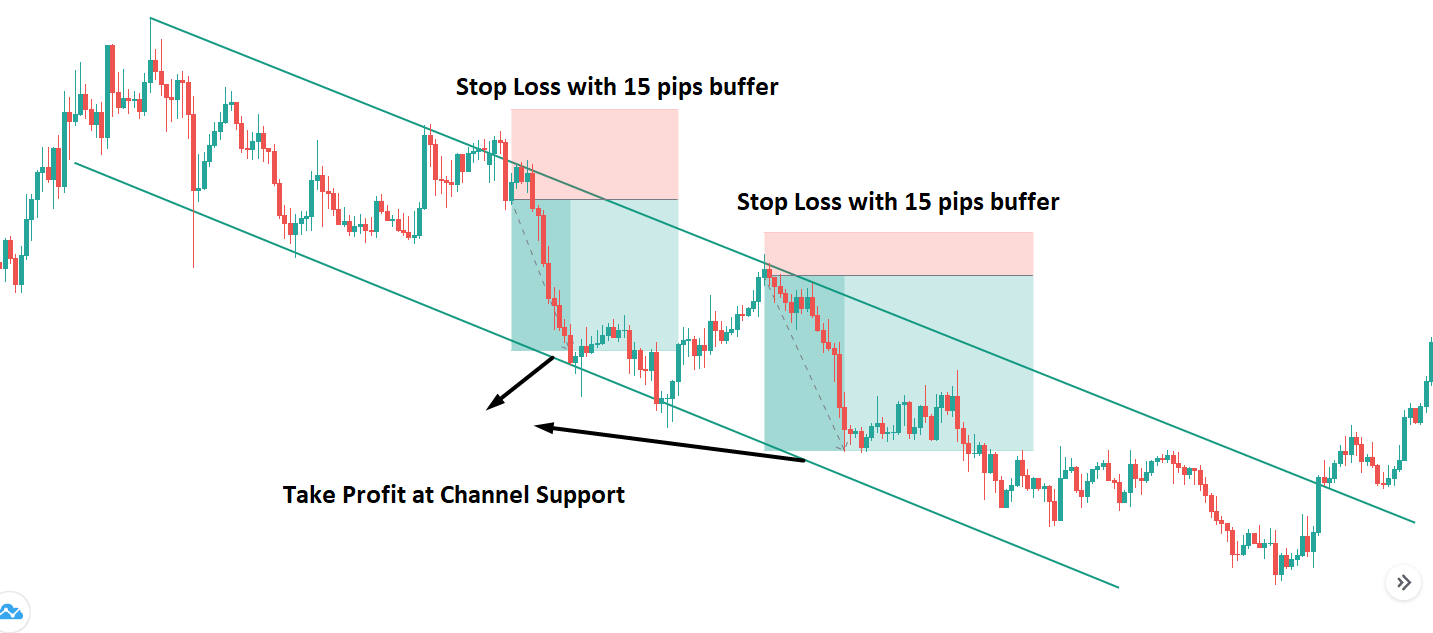
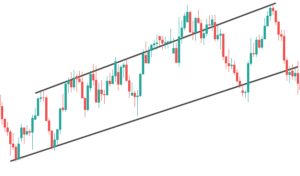
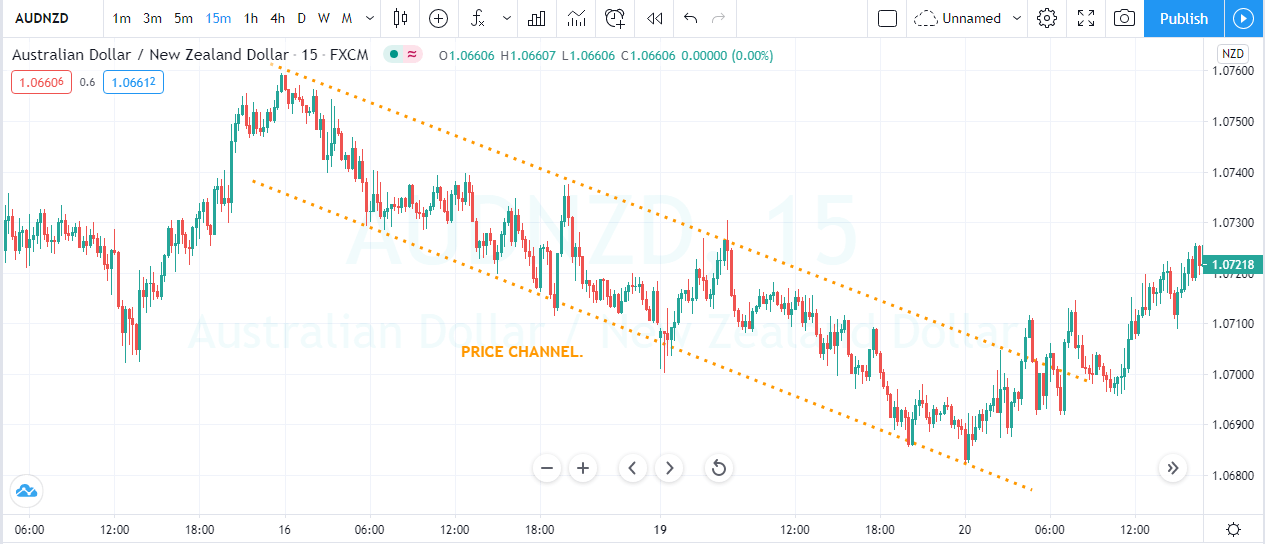
The price chart below indicates the price channel on the AUD/NZD forex pair.

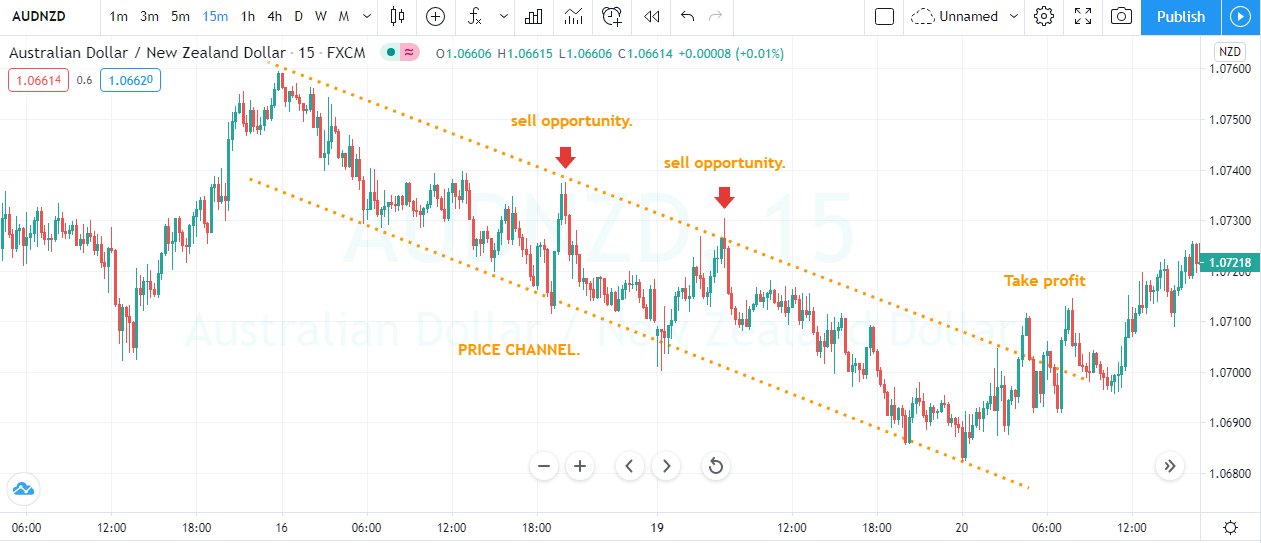
The price gave the first selling opportunity on the 16th of May and the second trade was around 19th May. These trades printed a brand new lower low, and we closed our trades when the prices broke the channel.

Reversals + Channels 

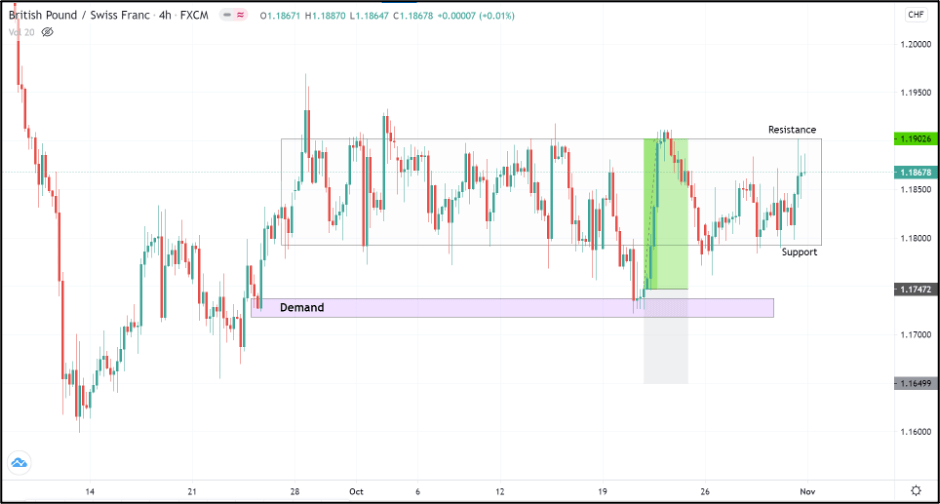
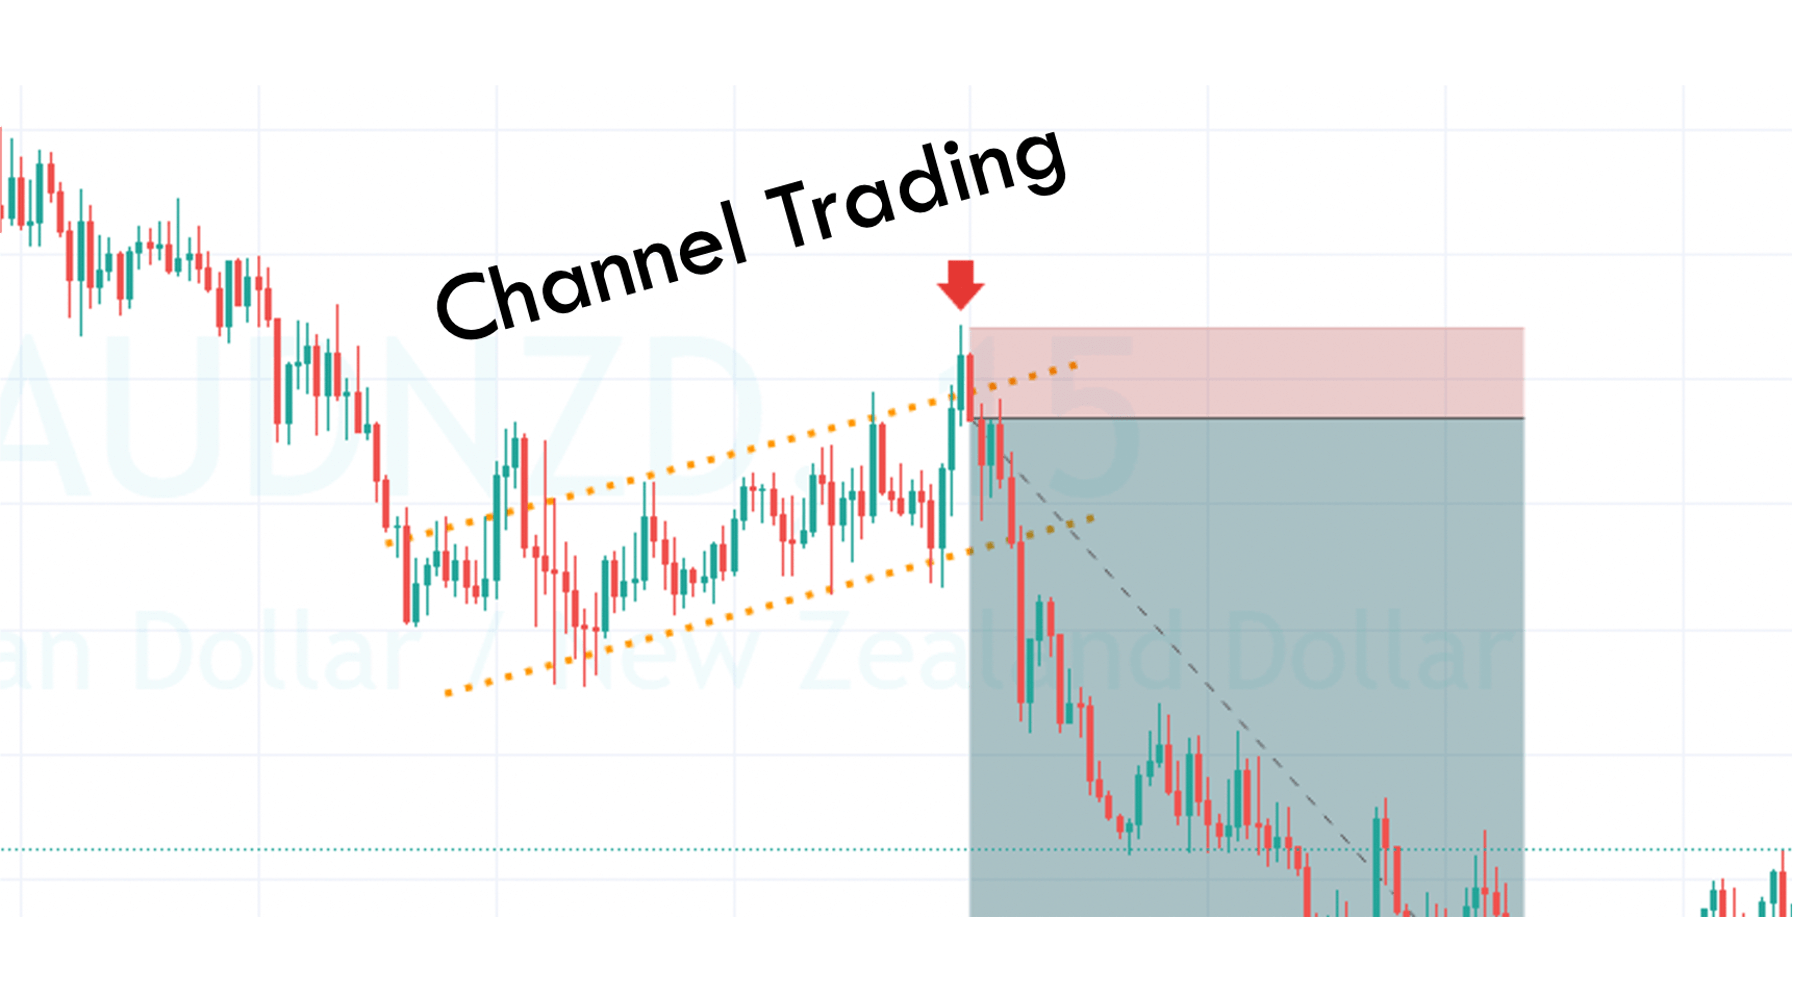
In this strategy, we need two timeframes to find accurate trading opportunities. Look for an uptrend on the higher timeframe and then see the same chart on a lower timeframe. On the lower timeframe, let the price to pull back enough. When the prices gave enough pullback, draw the price channel on that pullback. If the prices break below the channel line (in an uptrend) and get knocked back immediately, it is a sign for us to go long. When this happens, we can expect a brand new higher high.

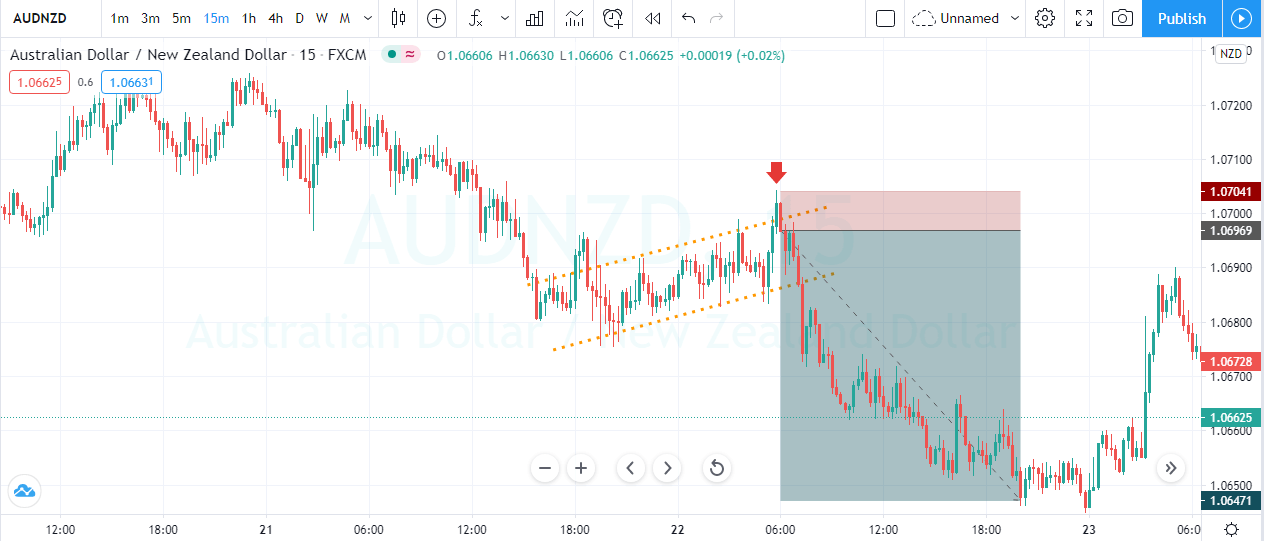
As you can see in the image below, the pair was in an overall downtrend. During the pullback phase, price action tries to break the price channel but get knocked back immediately. It means that some buyers are trying to take the price higher, but the aggressive sellers are grabbing the opportunity to fill a few more orders. After the fake-out, prices held inside the price channel for a bit, and after a few hours, we witnessed a brand new lower low.

Breakouts + Channel

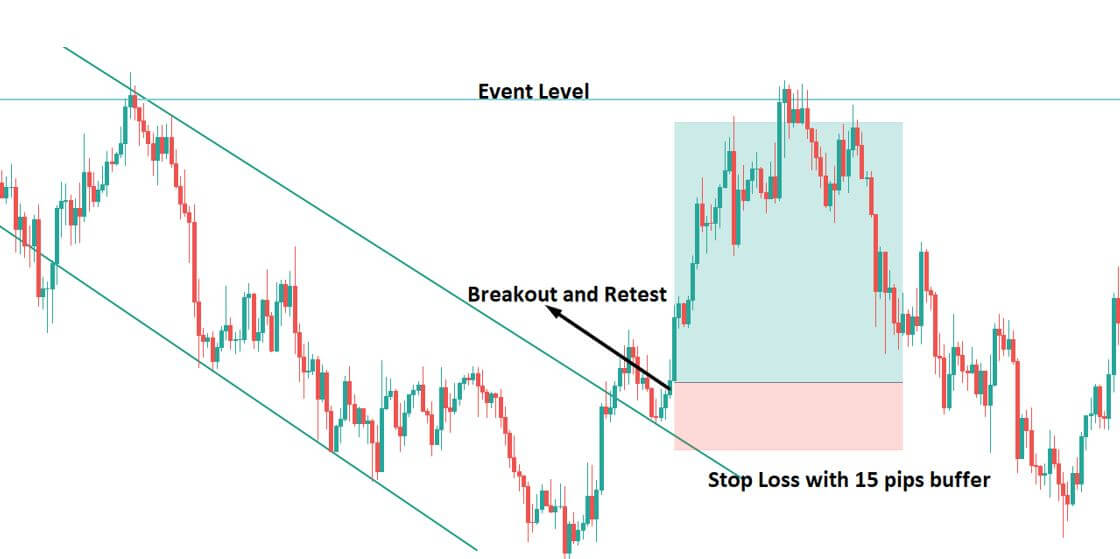
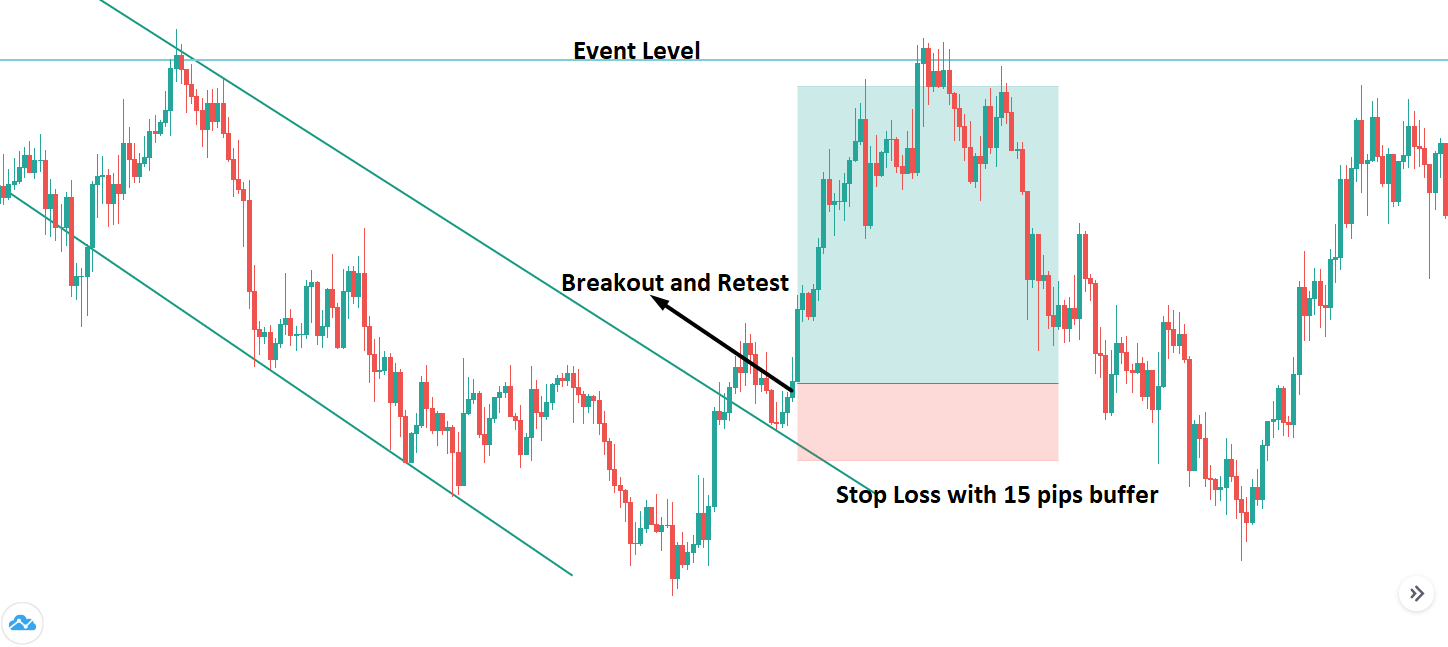
Breakout trading is the most common yet effective approach to take high probability trades. Firstly, find an up-trending market and draw a price channel. Wait for the price to approach any significant level and break below the price channel to take the trade. When the price action goes below the channel line, it is a sign for us to go short. Similarly, in a downtrend, draw the price channel and let the price approach any significant level to take the breakout trade. After the breakout, go long and place the stops just below your entry. If the price holds after the breakout, it is a great sign to take the trade.

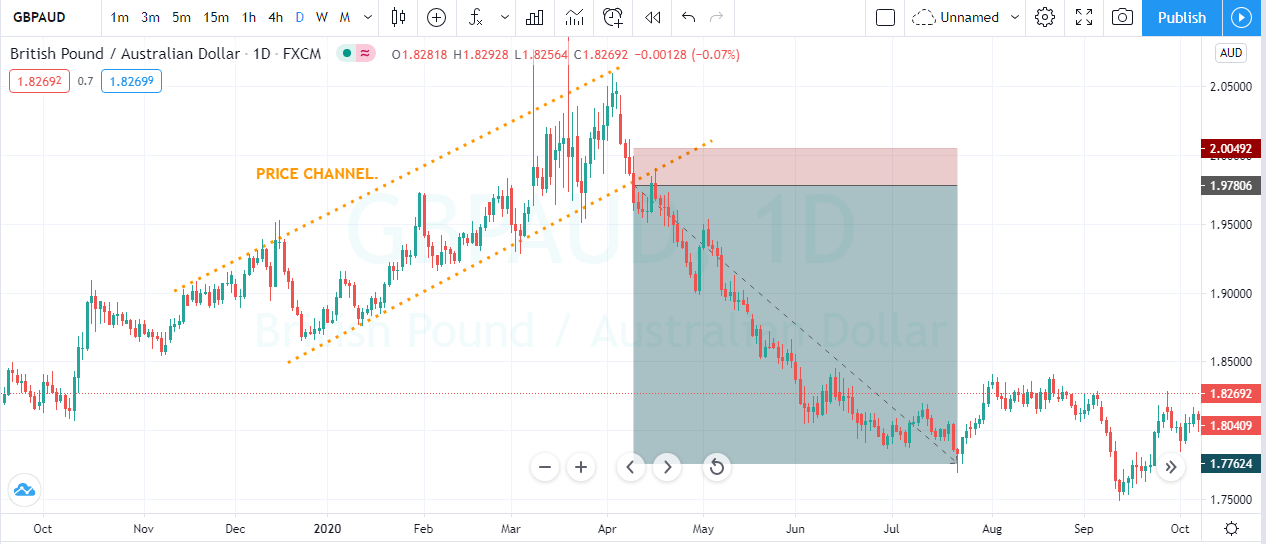
The image below represents a sell trade in the GBP/AUD Forex pair. As you can see, the prices were in an uptrend, and when the sellers broke below the price channel, we took a sell trade. We choose a smaller stop-loss order as the channel line also acts as dynamic support to the prices. For booking profits, a higher timeframe support area was a perfect place.

Conclusion

Trading Channels are effective as they provide numerous trading opportunities when the market is moving in that state. You can use all the mentioned ways stated above to trade a channel or use the method that best works for you. When trading, the channel always trade with the trend. Do not over trade whatsoever. If you get used to it, sooner or later, you will blow your trading account. Don’t do this. Instead, always follow the trend. The trend is your friend. Let the market pullback to the channel line to trade with the trend. Another approach is to wait for the prices to break the channel to trade the reversals. These simple approaches are healthier ways to grow your trading account while trading channels. All the best!

Categories
Forex Basic Strategies Forex Daily Topic

Trade Ranges Like A Pro with this Effective Forex Trading Strategy

Introduction

The market does not move in random directions. It either trends or consolidates. As many would not know, the market is like a closed circle, and the same states keep repeating over and over again. Thus, in trading, one must learn how to become pro at reading these market states.

On that same note, we shall be going over an effective strategy when the market is in a consolidation/ranging state. However, before jumping right into the strategy, it is important to understand the basics and related concepts.

What is a consolidation phase in a market?

There are several ways to comprehend the consolidation phase of the market. There is logical reasoning behind the occurrence of this state, and is not simply a random pattern that shows up quite often.

The consolidation state is that phase of the market when the market moves in a sideways direction. This state is also referred to as a range. The reason for its occurrence is related to the strength between bulls and bears.

Comprehending a Range

There are two parties in the market – the bulls and the bears. Their strength is what describes the state of the market. In a trending market, either of the parties is powerful. For instance, if the market is going up, it simply means that the bulls control the market. In a consolidation state, both bulls and bears show equal strength. The bulls show strength by pushing the market higher, while the bears show power by taking the price right back down. As a result, the prices in both directions – which we refer to as a range.

How to draw a range?

To trade this range strategy, it is vital to understand how a range is drawn. A range is made up of two levels:

  • Support
  • Resistance

Thus, drawing the correct support and resistance levels will result in a perfect range.

Another point considered is the size of the range. The larger the range, the better. The other small consolidations in the market are ignored. Following is an example of how we pick an ideal range.

In the above example, both are ranges as the market is moving in a sideways direction. However, we do not consider range-1 as a range for our strategy. This is because a single line going up and down fails to depict the market’s price action.

Supply and Demand Range Strategy

What is the usual approach to trading a range? It is to buy at the support and sell at the resistance. But we’re going to step the game a little bit. The supply and demand range strategy uses the same principles of a typical range, in addition to other factors.

Step by step procedure to trade the Supply and Demand Range Strategy:

  1. Find a legitimate range in the market. Mark the Support and Resistance levels appropriately.
  2. Determine the direction of the market prior to the range.
  3. Find a potential supply/demand level.
  4. Get in when the market breaks through the range and reaches the supply/demand zone.

Buy Example

Consider the below chart of GBPCHF on the 4H timeframe. We see that the market has been ranging between 1.1902 and 1.1800. Observe that the support and resistance levels have been marked by cutting off the false market breakouts.

To trade this market, our job is not simply to hit the buy at the support and sell at the resistance. As mentioned, we take into account the preceding direction and the supply and demand levels around it.

The direction of the market prior to the range was an upside, indicating that the bulls were in control previously. A point to note is that, despite the market being in a range, it does not change the fact that the bulls are still powerful. Thus, we rather look for buying opportunities than shorting signals.

To do so, we wait for the price to drop below the bottom of the range and hold at any one of the demand zones. Once the market begins to reverse its direction from south to north around the demand zone, we can go long. The same scenario has been illustrated in the chart below.

Placements

Stop Loss – Well below the demand zone would be decent.

Take Profit – Top of the range would be an ideal spot to take profits.

Sell Example

Consider the chart of CAD/JPY on the 15min timeframe shown below. The recent market price action depicts that the market is moving sideways. The market’s overall trend is down, indicating that the bears are in control of the market.

Since the scenario is opposite to the previous example, we wait for the market to break through the resistance and reach any potential supply level. In the below example, we can see that the price broke through the resistance twice reacted off from the supply, as shown. Thus, we can look for entries when the market begins to switch direction to the downside.

Placements

Stop Loss – Above the supply zone

Take Profit – Bottom of the range

Conclusion

The only way to trade a range is not by buying and selling from the top and bottom of the range. It can be professionally traded with the application of other factors. And this range strategy particularly dealt with the strength of the bulls and bears and the concept of supply/demand.

We hope you were able to comprehend our Supply and Demand Range strategy. Do test them out for yourself and let us know your results in the comments below. Happy trading!

Categories
Forex Basic Strategies

Dynamic Channel Trading Using The Concepts Of Price Action!

Introduction

In forex, the dynamic channel trading is a profitable strategy that forms with standard trendlines. It indicates a potential move to identify the market direction both to the downside and upside. On the other hand, price action is a method to identify the price direction based on price behavior. Therefore, we can create a profitable trading strategy by reading the price action from any channel support and resistance level.

In general, traders use price channel as a technical analysis tool that helps to identify the potential market movement. The dynamic channel moves like a zigzag by creating lower lows and higher highs. In Forex trading, we usually have two types of dynamic channels:

  • An upward or ascending channel
  • Downward or descending channel

Dynamic Channel Identification

We can easily identify the dynamic channel by connecting the swing lows or swings highs they create. In an upwards dynamic channel, it will move with the price with a higher high formation.

Similarly, in a downward dynamic channel, it will move with the price by creating lower lows.

In the image above, we can see that the higher highs and the lower lows connected through straight lines. The dynamic price channel shows a significant movement from down to upside in the trend line. The trendline below the price may work as a dynamic support level, and the trendline above the price may work as a dynamic resistance level.

Besides the dynamic channel, we will use the concept of price action by measuring what buyers and sellers are doing in the market. Any slower and corrective movement from the dynamic channel support and resistance would indicate a possibility of a potential market reversal.

Later on, we will use the appropriate reversal candlestick from that area to enter a trade. In this trading strategy, we can make a profit when the price is trading within the channel, or it breaks out from the channel. However, we will filter out the unusual false movement by reading the price action.

Bullish Dynamic Channel Trading Strategy

In the bullish channel continuation trade setup, we will identify the price that is moving upside within the channel.

Identify the Price Location

Central banks and big financial institutes drive the price of a currency pair. Therefore, institutional traders focus on long timeframes mostly, as it provides the most reliable price direction. Therefore, we will move to the daily or weekly timeframe and identify the location of the price. We will consider channels that only meets the following condition:

⚠️ An upward channel should move within an uptrend above a key support level.

Entry

In an upside movement of a price channel, there will be new higher highs. Therefore, we need to identify a price channel where the price moves down towards channel support with a corrective speed. We will enter the trade as soon as the price rejects the channel support with a reversal candlestick formation.

Stop Loss

In a bullish channel trading, the stop loss would be below the reversal candlestick with 10 to 15 pips buffer.

Take Profit

The primary aim of the taking profit would be the immediate channel resistance. However, we have to read the price action to make a trading decision regarding the take profit.

If the price starts to move with an impulsive bullish pressure, it can go beyond the channel resistance. In that case, we can take some partial closing 10-15 pips below the channel resistance and wait for the price to test any event level.

Bearish Dynamic Channel Trading Strategy

In the bearish channel continuation trade setup, we will identify the price that is moving downside within the channel.

Identify the Price Location

Based on the price action context, we will move to the daily or weekly timeframe and identify the price’s location. We will consider channels that only meets the following conditions:

⚠️ A downward channel should move within a downtrend from a key resistance level.
Entry

In the downward price channel, there will be lower lows. Therefore, we need to identify a price channel where the price is moving down towards a channel resistance with a corrective speed. Therefore, we will read the price action and enter the trade as soon as it rejects the channel resistance with a reversal candlestick pattern.

Stop Loss

In the bearish channel trading, the stop loss would be above the reversal candlestick with 10 to 15 pips buffer.

Take Profit

The primary aim of the taking profit would be the immediate channel support. However, we have to read the price action to make a trading decision regarding the take profit.

If the price starts to move with an impulsive bearish pressure, it can go beyond the channel support. In that case, we can take some partial closing 10-15 pips above the channel support and close the rest of the amount at the next event level.

Channel Breakout Trading Strategy

In forex trading, when the price crossed (above or below) the channel, there is a profitable trading strategy. For making the trade sustainable, we need to identify the speed of the breakout. When institutions or banks enter the market, we see such massive breakout from the channel support or resistance.

Entry

After a massive breakout from a dynamic channel, we will wait for a correction. The correction indicates that the massive breakout would be strong. We will wait until the price moves to the channel support or resistance level with a corrective speed and enter the trade as soon as it rejects the level with a reversal candlestick formation.

Stop Loss

Setting a stop loss is similar to the channel continuation trade setup. You can put your stop loss above or below the reversal candlestick with 10 to 15 pips buffer.

Take Profit

The primary target of the channel breakout is the immediate event level. However, you can extend the take profit by reading the price action. If the power of the breakout is strong, the price may move beyond the immediate event level.

Conclusion

The Forex market is a competitive trading market where trade management is a key element for a forex trader. No trading strategy can assure you a confirmed profit. Therefore, it is recommended to use not more than 2% risk per trade and move the stop-loss at breakeven as soon as the price creates new lows or highs.

Categories
Forex Course

140. Market Environment – Summary

Introduction

In a few of the past course lessons, we have discussed some of the most crucial topics related to the Forex market environment. Starting from the ‘state of the market,’ we have understood what trending and ranging markets are. We also have differentiated the concepts of retracements and reversals, which are vital for identifying accurate entries and exits.

One of the most valuable things we have comprehended is to identify ways for spotting potential market reversals. Finally, we understood how professional traders read different market environments and states. The fundamental purpose of this summary article is this – There is a possibility of you understanding these concepts better once you finish all the course lessons in this section.

Hence, this article will focus on summarizing everything we have learned till now regarding the Market Environment.

The Market States

We have discussed the different ways in which the market moves. Essentially, the price action of a particular asset class moves in three different ways.

Trend | Range | Channel

With clear examples, we have discussed how this movement happens and what we should understand when the price moves in a particular direction. More info related to this can be found here.

Trading the Forex market when it is trending!

In this chapter, we have taken you through the concept of trending market. Uptrend and downtrend concepts have been clearly explained. We also have used Indicators like ADX and Moving Averages to trade the trending market accurately. Please go through this to recall those strategies.

What should we do when the market is ranging? 

We have comprehended the various ways of identifying the ranging market. We also used the Support/Resistance strategy & ADX indicator to trade ranges effectively. Once you try trading a ranging market by yourself, the way you read this article will change, and it will all start making sense. Hence, going through it once again now is important.

Retracements & Reversals

In the next couple of articles, we have drawn down clear differences between Retracements and Reversals. Here, we understood what we must do in the situation of a reversal or a retracement. Then, we have moved on to learn how to trade a reversal in the most effective way possible. In this lesson, we have taken the help of Fibonacci Levels to identify potential market reversals and trade them accordingly.

Finally, we ended this course by understanding how most of the professional Forex traders read and trade different market states. We consider this one of the most useful and valuable articles in this course as we have shared some of the most simple yet effective trading techniques. We also used accurate risk management techniques to protect your capital while trading the market using these techniques. You can go through them again here.

We hope these techniques helped you in becoming a better trader. In our upcoming course lessons, we will be understanding Breakouts, Fakeouts, and everything related to these topics. Cheers!

Categories
Forex Chart Basics

How to Establish a Trading Strategy Using Trend Lines and Channels

Introduction

On financial markets, the price moves basically in three types of trends identified as bullish, bearish, and sideways. Both trend lines as channels allow the “trend following” investor to recognize if the market’s direction changed or if the price action accelerated.

In this educational article, we’ll review how trend lines and channels can help establish a trading strategy.

Trend Lines and Trend Channels

In a price chart, the trend can be described as a price variation across time in a specific and identifiable direction. A trend is said to be bullish when the price creates a succession of higher peaks and higher valleys. On the contrary, in a bear trend, the price action tends to create a sequence of lower peaks and lower valleys. If the market runs in a consolidation stage, developing an overlapped structure, the price moves in a sideways or lateral trend.

When the price action develops an uptrend, the chart analyst projects the trend line connecting the lower highs sequence. In a bearish trend, it is customary that the projection links the lower highs sequence. The following figure illustrates how to trace a trend line. 

In the above figure, the 1-2-3 sequence represents the movement developed by the price action in an uptrend (left) and downtrend (right). When price breaks below (or above) of the trend line, as shown in (4), the price action reveals the potential change in the primary trend. The confirmation of this change comes determined by the retracement that experiences the price, which here tests the trend line and continues in the new trend’s direction, making a higher high.

Trend channels could be considered as a dynamic price range that follows the rhythm of a trend; this technical formation could be bullish or bearish. To draw a trend channel, it’s necessary three points, in an uptrend, two lows and one peak. The channel baseline is the trend line that connects the origin of the movement with the second low. The upper line will be the projection of the baseline traced from the peak between two lows as exposes the following figure.

In an uptrend, the breakout after the second low completion (see figure 01) provides a confirmation signal of the bullish trend continuation. This entry setup for the third movement has its potential target located at the upper line of the channel, acting as a dynamic resistance.

Phi-Channels

Phi-channels is a different type of channel and varies from the trend channel. The main difference with trend channels is that on Phi-channels, the guideline connects the extremes from the origin of the movement with the top of the move identified as 3. Then, parallel lines are projected, creating the channel, using point 2 to trace the channel’s parallel line, as shown in the next figure. 

The resulting projection provides potential turning points, which could offer entry setups combined with other technical tools.

Conclusions

In this educational article, we have seen the use of trend lines and channels that can help establish a trading strategy based on tracking the trend.

In general, the use of trend lines and channels is aimed at seeking to take advantage of the continuity of the trend over the turn of the market’s direction. In this sense, it is convenient to recall the Dow Theory principle, which states that a trend will remain in effect until there is confirmation of its change.

In this context, the use of Phi-channels provides potential areas where the price could react to continue the course of the primary trend, although its use should be supported with other analysis tools.

In the next article, we will look at how to apply the analysis tools to create trading signals.

Suggested Readings

  • Fischer, R., Fischer J.; Candlesticks, Fibonacci, and Chart Patterns Trading Tools; John Wiley & Sons; 1st Edition (2003).
Categories
Forex Basic Strategies

Understanding The N-period Narrow Range Trading Strategy

Introduction

There are three states in the market – trend state, channel state, and range state. A trending market is the one where the market makes higher highs or lower lows, and a ranging market is a state where the price goes through a consolidation phase. The channels can be considered as a particular case of range as they work similarly to a range, but are tilted.

What is consolidation?

To understand this strategy, we must first understand the concept of consolidation. Consolidation is a technical term in trading where the market loses momentum and starts to move in the form of a range.

A common tendency of the market is that, when the price starts to move in a range and begins to consolidate, it prepares blast in one of the sides. So, people always keep an eye on currency pairs, which are in a consolidation phase.

N-Period Narrow Range

In the N-period narrow range, the period N takes two values –4 and 7. So, we have the 4-period narrow range and the 7-period narrow range. These two are also referred to as the NR4 (Narrow Range 4) and the NR7 (Narrow Range 7).

The NR4 and NR7 trading strategy

This strategy is basically a modified range breakout strategy where the market consolidates in the beginning and then blasts out of a narrow range.

In NR4, number 4 refers to the period under consideration. That is, for NR4, the last four days are taken into consideration, and for NR7, the last seven days are taken into account.

What is the NR4 and NR7 strategy?

It is a breakout trading technique where we consider the last four or sever days to apply this strategy. And in these four or seven days, we compare the range of all these days and determine if the current day is an NR4 or NR7 day. Once we obtain the NR4 or NR7 day, we gear up to go long or short.

Calculating the range

Firstly, to trade this strategy, consider the candlestick chart on the daily timeframe. The range of a particular day is calculated as the difference between the high price and the low price.

What is the NR4 day and the NR7 day?

NR4 day

In layman’s terms, the least fluctuated day (4th day) in the recent four days is called the NR4 day. Technically, it is the day whose range is the smallest out of the previous four trading days.

NR7 day

Similarly, when the 7th day in the last seven days moves the least number of pips, it is referred to as the NR7 day.

How to trade the NR4/NR7 strategy?

Following is a set by step procedure to trade this strategy:

  1. Find the high and low of the last few days (seven for NR7 and four for NR4).
  2. Calculate the range (high – low) for each day under consideration.
  3. Compare these range values with the previous days.
  4. Determine if the present day is an NR4 or NR7 day. If so, then wait for the price to break out of the high or low of the NR4/NR7 day.

If the market breaks above the high, then it is an indication for a buy, or if it breaks below the low, then it is an indication for a sell.

Illustration to trade the N-period Narrow Range

Trading the NR4/NR7 strategy is simple. But, as far as the consistency of this strategy is concerned, one can make more out of this strategy only when the NR4/NR7 day appears in the right location. Hence, understanding ‘where’ the NR4/NR7 occurs is very vital. So, let’s consider a few examples to support this statement.

Below is the chart of USD/CAD on the Daily timeframe. We can clearly see that the market is moving in a channel state. Now, to trade this strategy, we blend it with the working of a channel.

Trading a channel is pretty straightforward. When the price is at the bottom of the channel, we look for buying opportunities, and when it is at the top of the channel, we look for short-selling opportunities. With this mind, we try spotting the NR4/NR7 days in these regions.

Below is the magnified image of the chart where we’re going to analyze the market. Initially, the market came down rolling until the bottom of the channel and began to hold down there. And the candle which held at the bottom turned out to be the NR7 day as it has the smallest range compared to the previous six days. This is an indication that the market (sellers) is slowing down. Later, the market blasts up north and breaks the high of the NR7 day. Therefore, now we can prepare to go long.

And as we can see, the trade performs exceptionally well. This is because the location was in favor of the NR7 day.

Continuing with the same chart, the market which was at the bottom of the channel now moves up to the top of the channel. During this up move, the market loses its momentum every step of the way and ends up giving us the NR4 day at the top of the Channel. Hence, once the price breaks below the low of the NR4 candle, we can go for the short sell. And as a result, the market does break through the NR4 day and heads down south.

Bottom line

Trading in the markets is not an easy task. There is no indicator, pattern, or strategy that can consistently work standalone. There are several other considerations that should be made before getting into a trade. For example, in the above trades, we saw how we combined the NR4/NR7 with the concept of channels and made a profit from them. Also, for any strategy, you trade, make sure that there is logical reasoning behind taking the trade. We hope you find this strategy informative. If you have any questions, please let us know in the comments below.