Categories
Forex Basic Strategies

Two Ways To Trade The ‘Descending Top’ Chart Pattern Like A Pro

Introduction

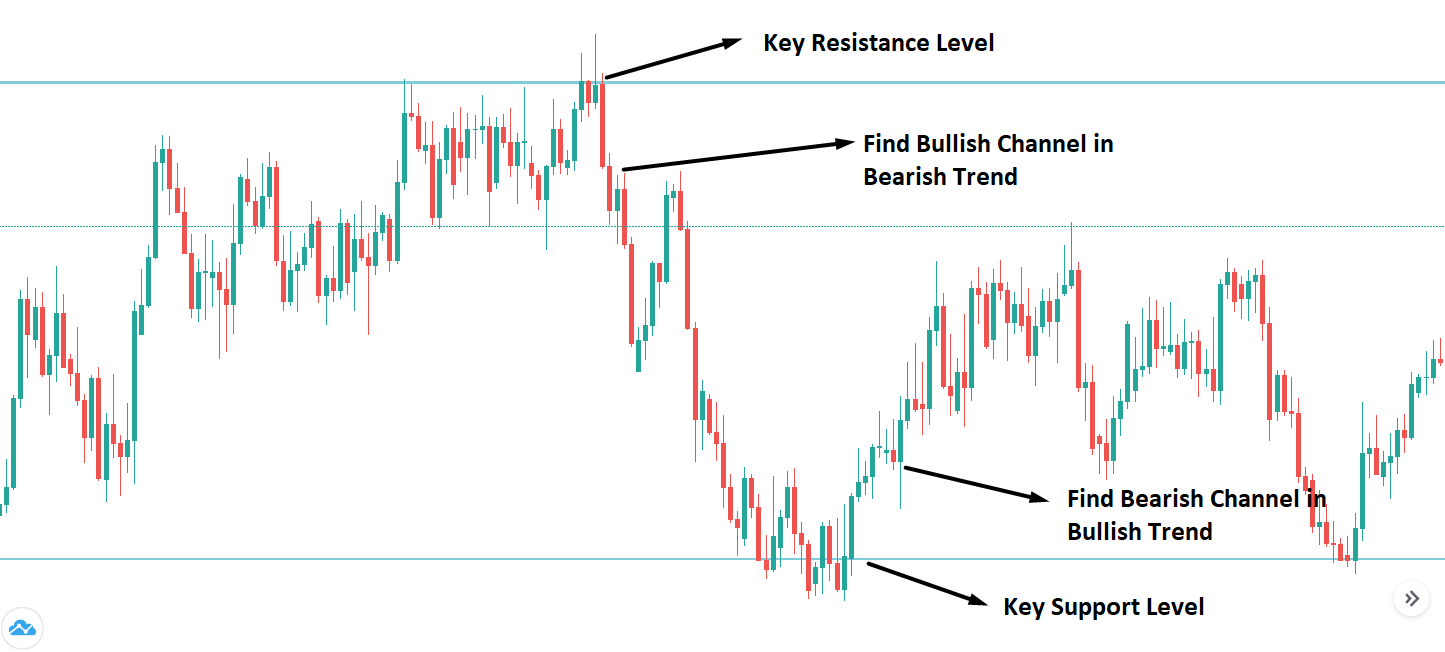
The Descending Top is a technical chart pattern that frequently appears on the Forex price charts. Each peak of the price in this pattern is lower than its previous peak. The descending top chart pattern’s appearance indicates a downtrend in the market, and we must only look for sell trades at that point.

This pattern can be recognized when the first peak is lower than the second peak and the second peak is lower than the third peak. For instance, if the first peak is at 88.00, and the price drops down to 83.00, then the second peak at 85.00, and drop to 80.00, and if the next peak is below 85.00, we can see the descending top pattern forming on the chart, and we should then looks out for selling trade in an underlying asset.

If the next peak is higher than the previous peak, instead of being lower, the pattern gets invalidated, and the market goes up, or it will consolidate. We will often witness the descending top pattern on lower timeframes, and we should not be expecting this pattern to form on the higher timeframes. The reason is that in a higher timeframe, the pullback is very less, and even the trend soon comes to an end.

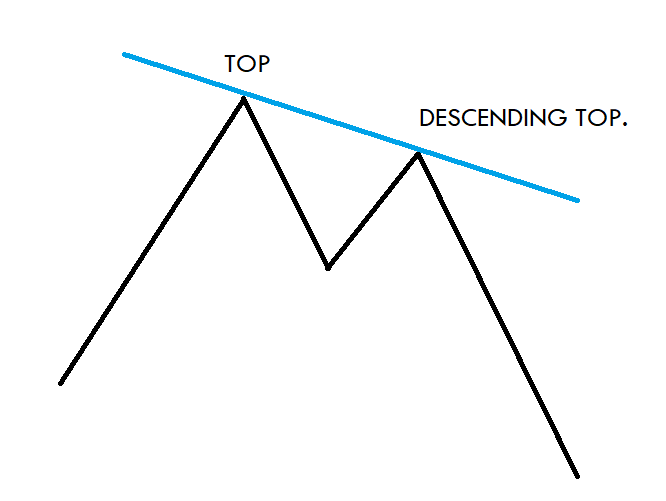
To identify the pattern, we must spot two tops on the price chart, which are descending, and then we must draw a line to connect these tops.

Descending Tops – Trading Strategies

Now that we know what a descending top pattern is, we will see how to combine it with other technical tools to trade this pattern.
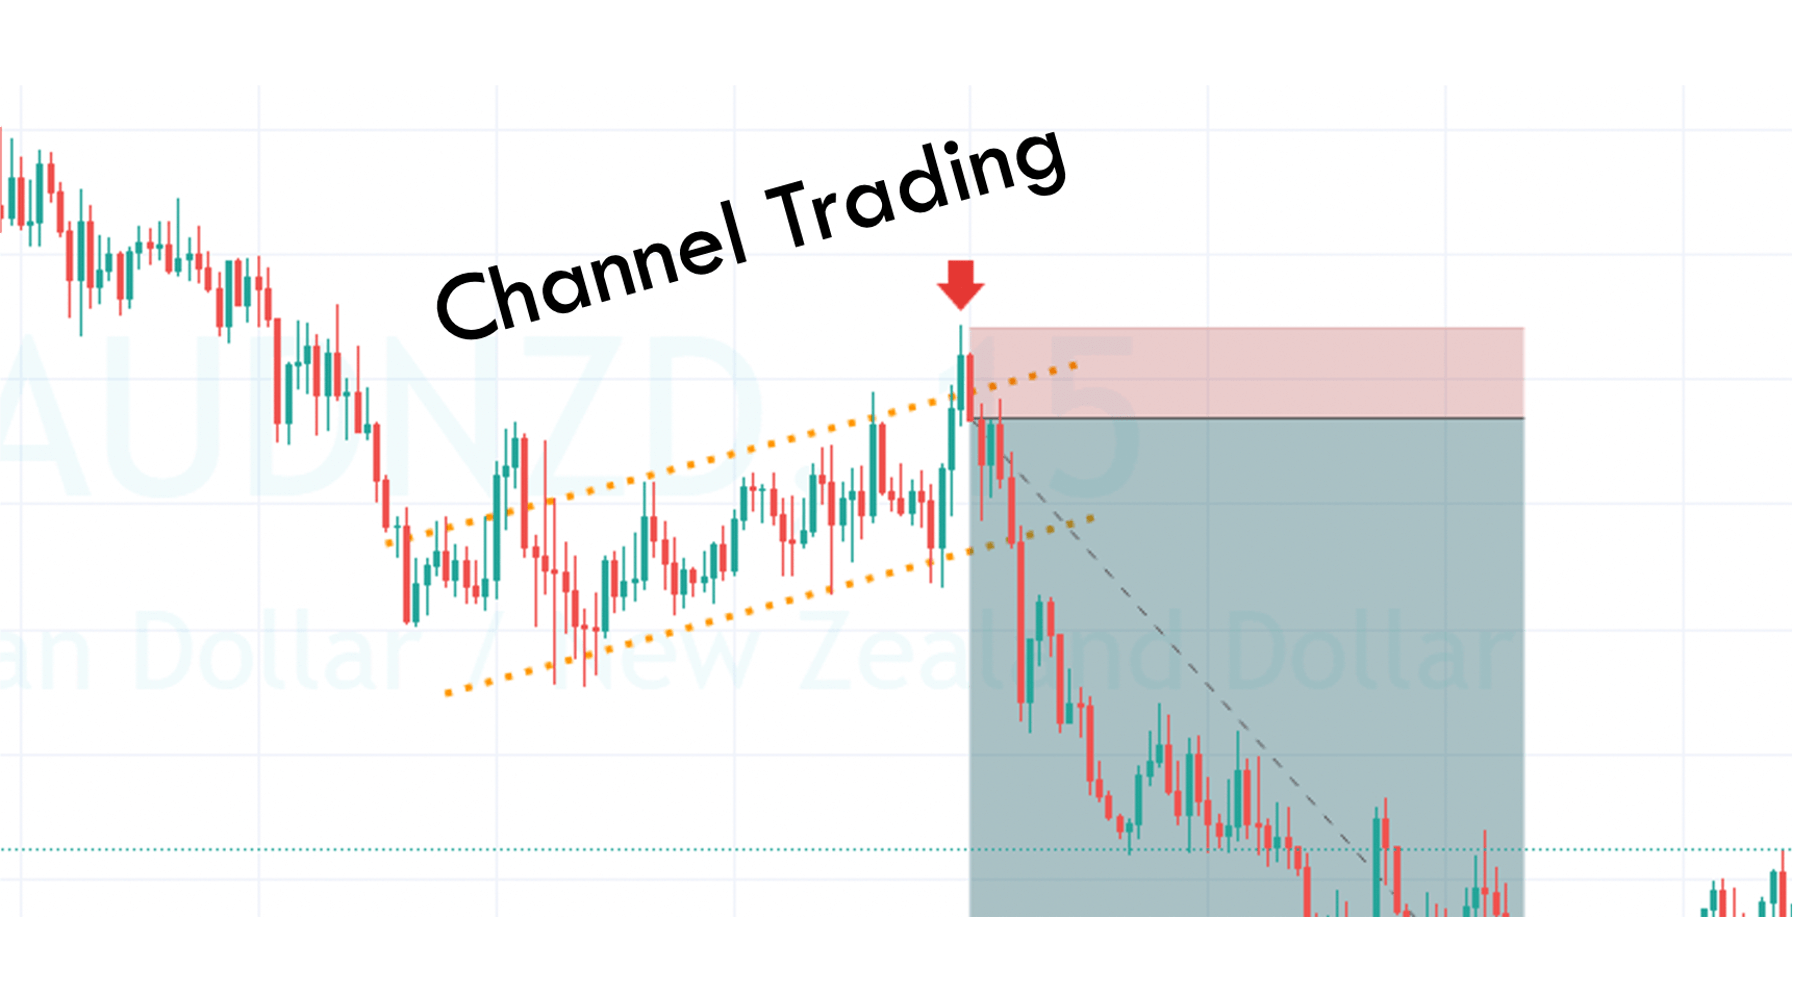
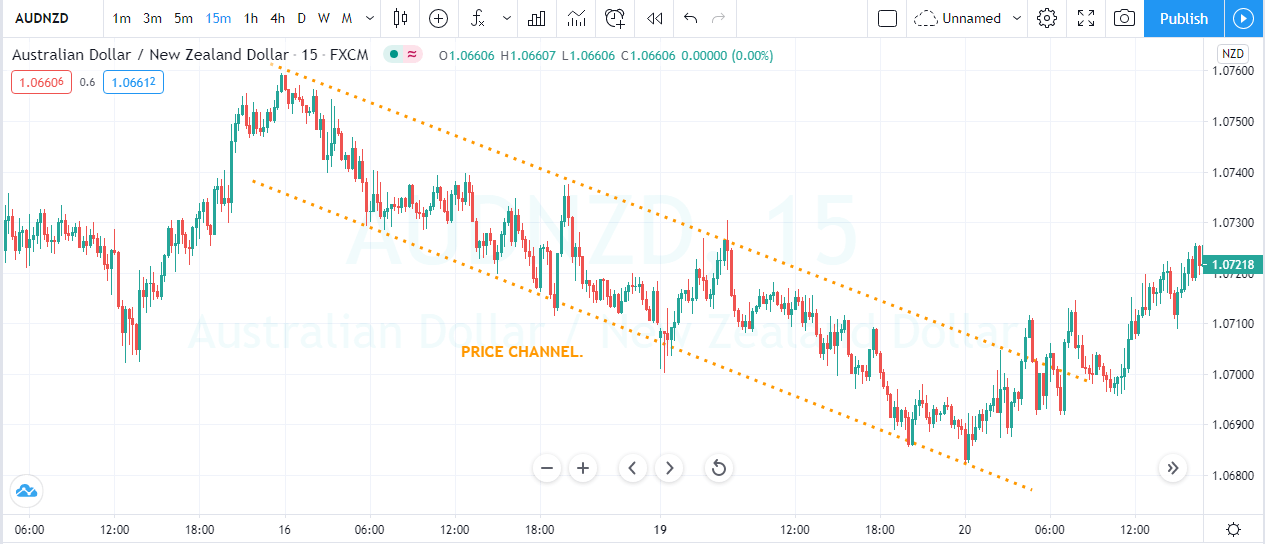
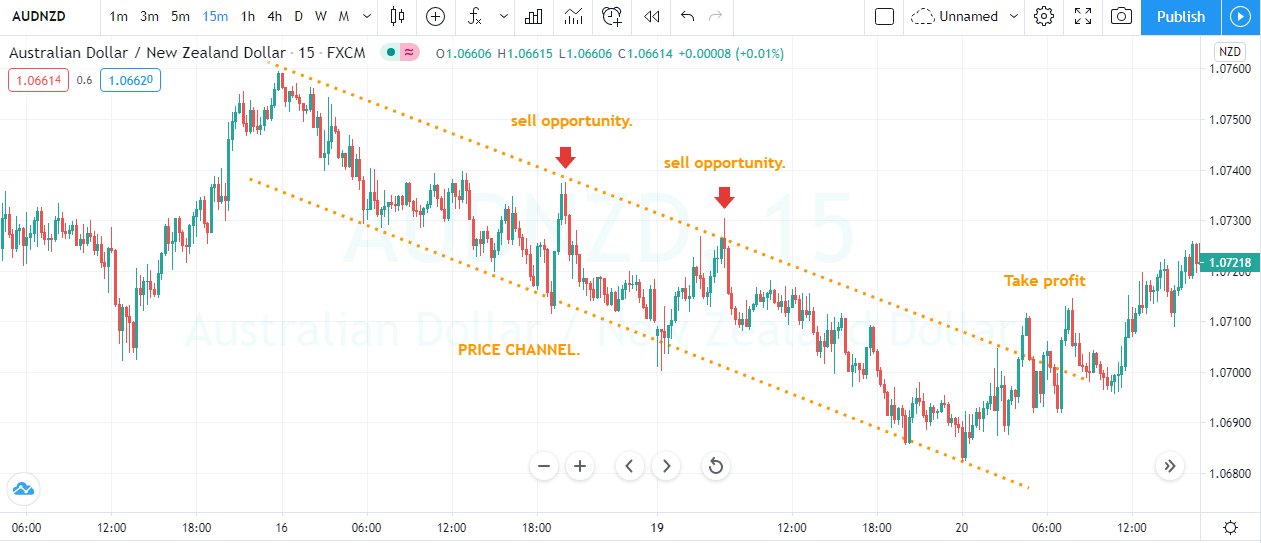
Channel Trading

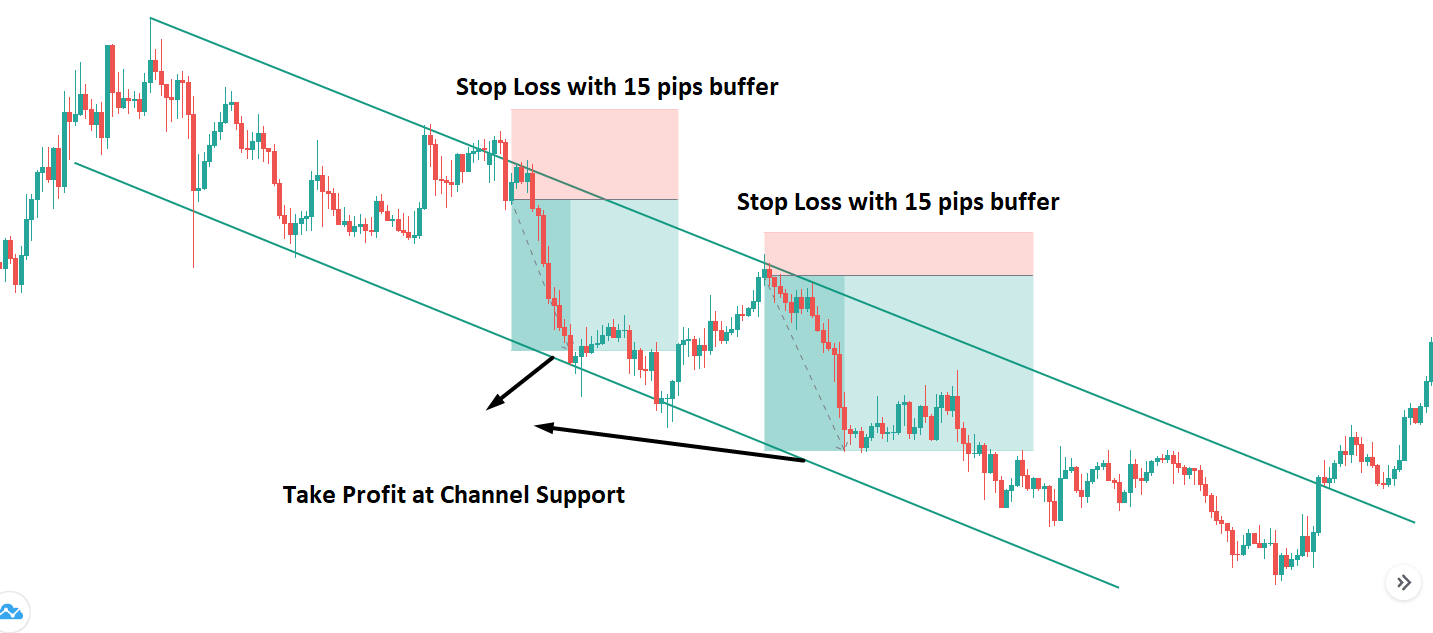
The first step is to identify the descending top pattern on the price chart. After that, identify the bottom between the two tops and draw a horizontal support line. Then wait for the break below the support line to enter a trade. Place the stop loss below the second top of the pattern and ride the trade. As we know, we cannot stay in a trade forever. We have to close our trade at some point. To close the trade, wait for the price to break the channel.
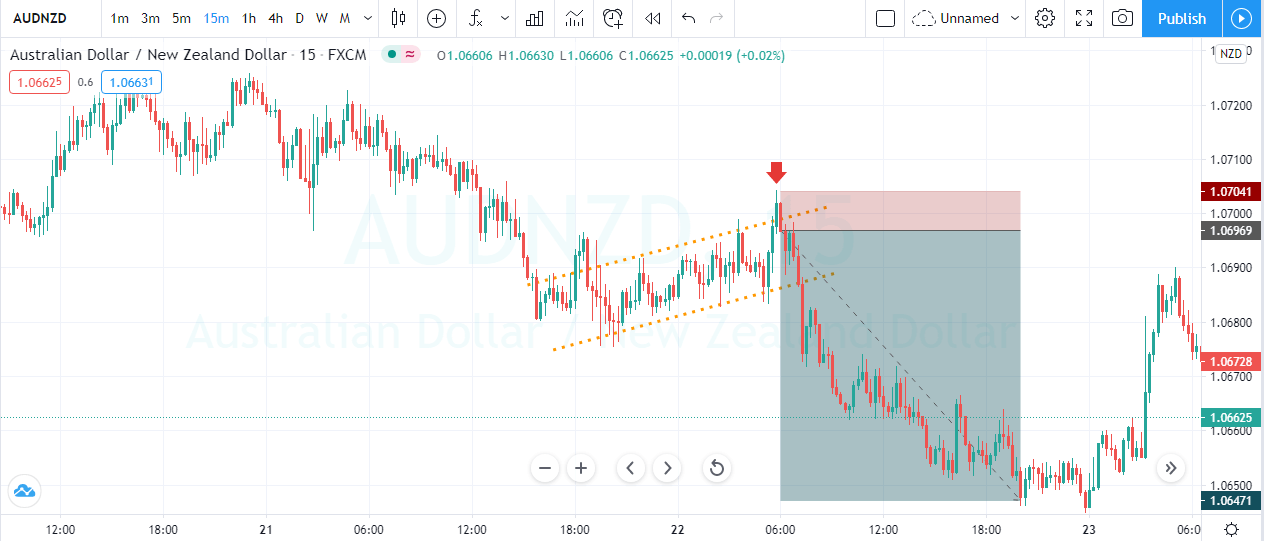
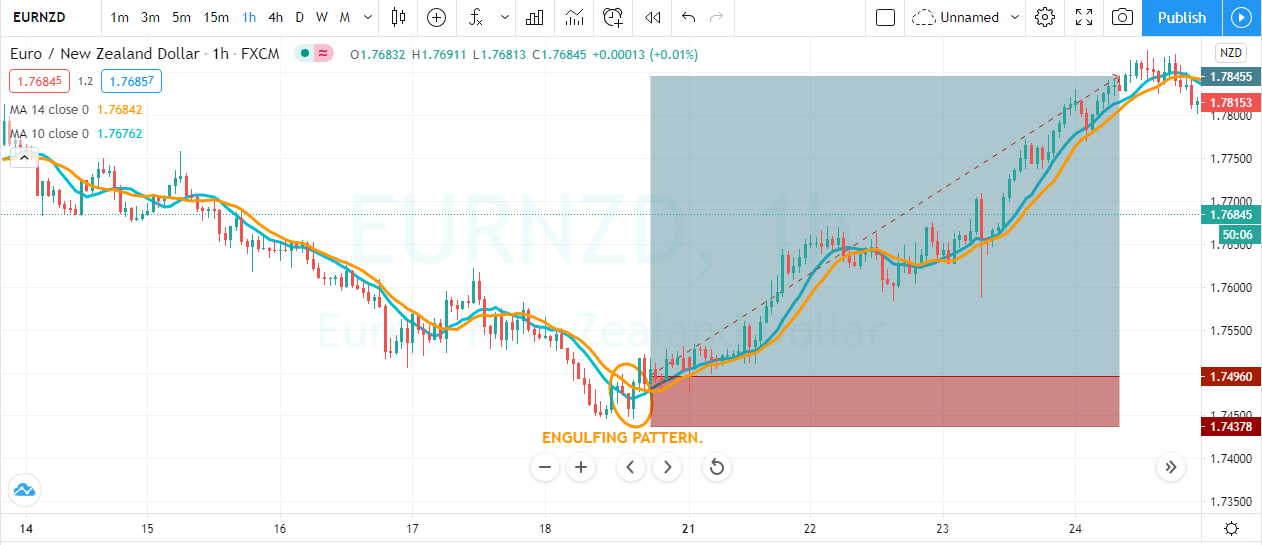
Example 1

As you can see in the image below, we have identified the descending top pattern in the EUR/USD 5 minute chart.

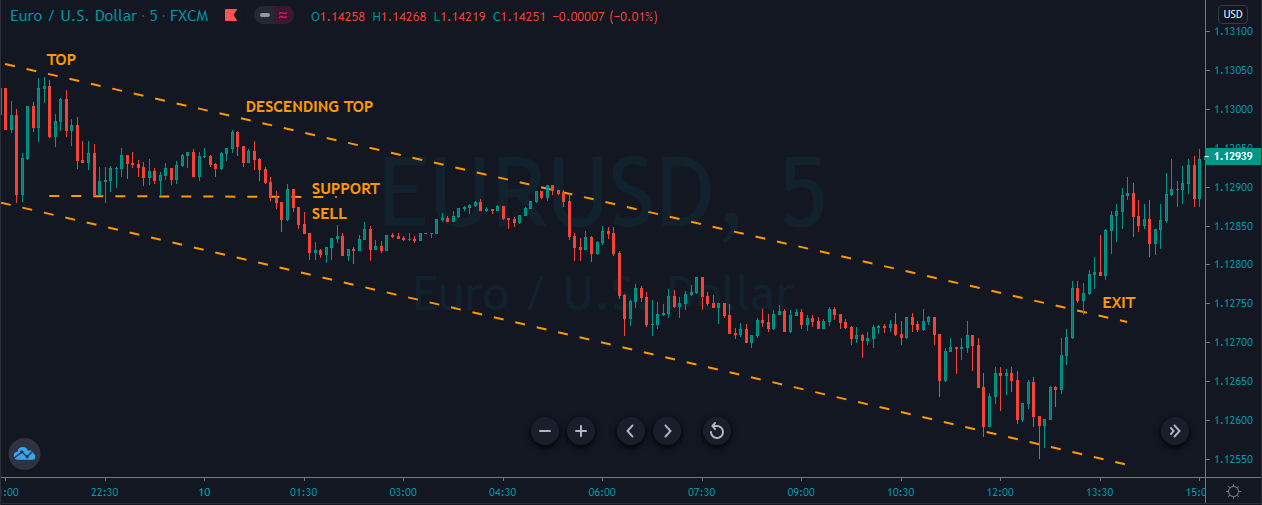
As you can see, when price action printed the pattern, we started preparing to take sell trades, and when the price broke below the most recent support area, it was a sure sign for us to go short. As we took the sell trade, the price immediately came back to retest the support area. Here, we choose to scale our trade at the support line and go for the brand new lower low.

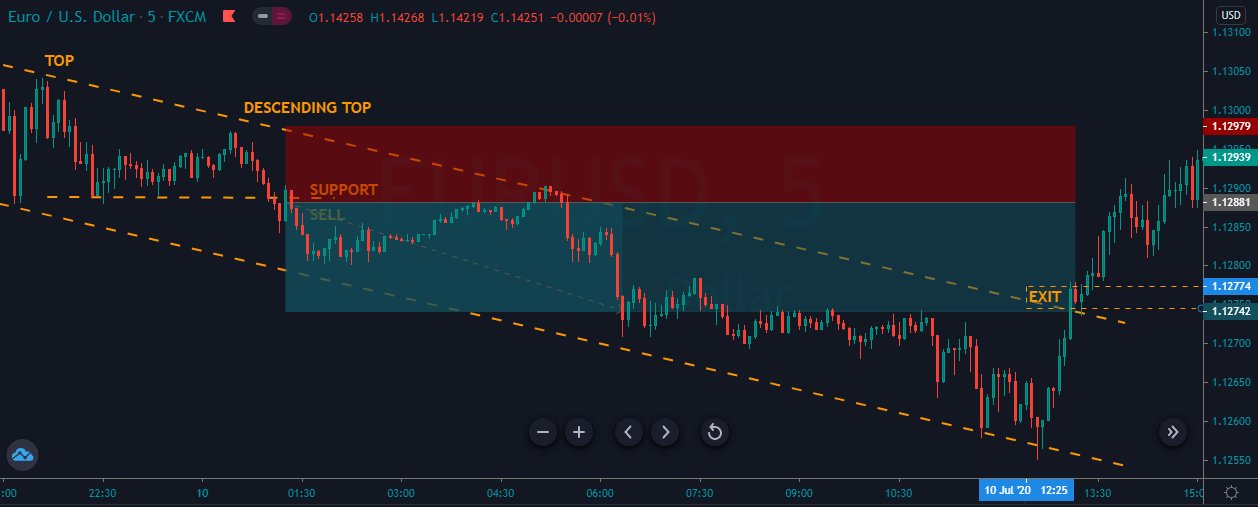
Initially, our trade goes to a 1.1255 area, and we were looking for more profit in the trade. The trade failed to print the lower low furthermore, and it broke above the channel at around 1.274. Here, we choose to close our trade as that was a sign of the trend getting reversed. The Forex market is all about probabilities. We cannot expect the price to do what we want it to do. Instead, follow the rules of the game. When the market gives less profit, accept it, and don’t try to break the rules.

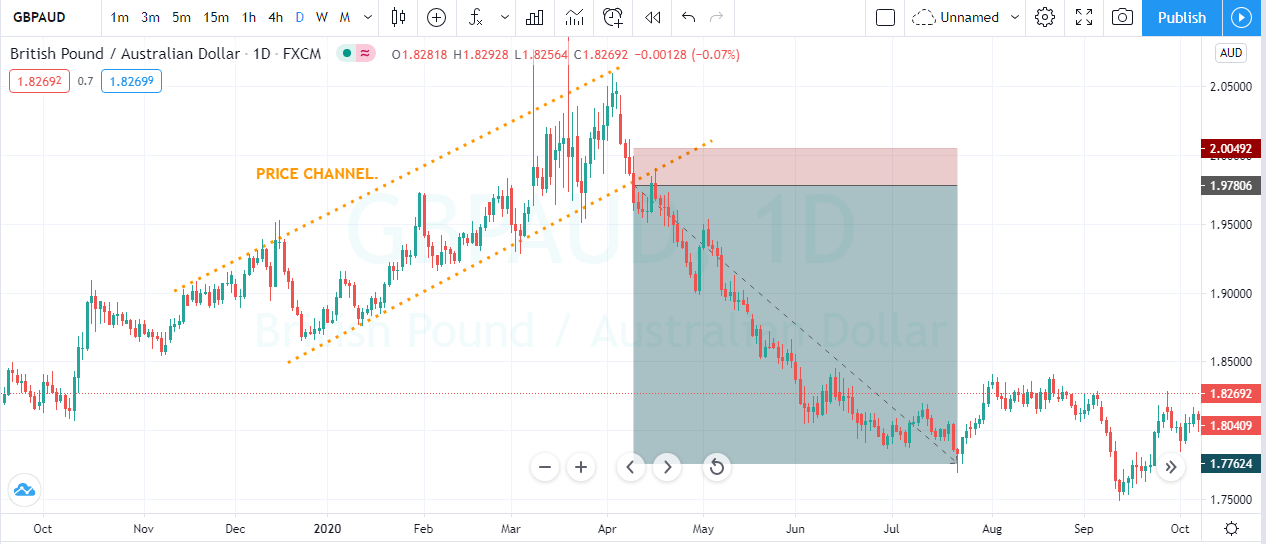
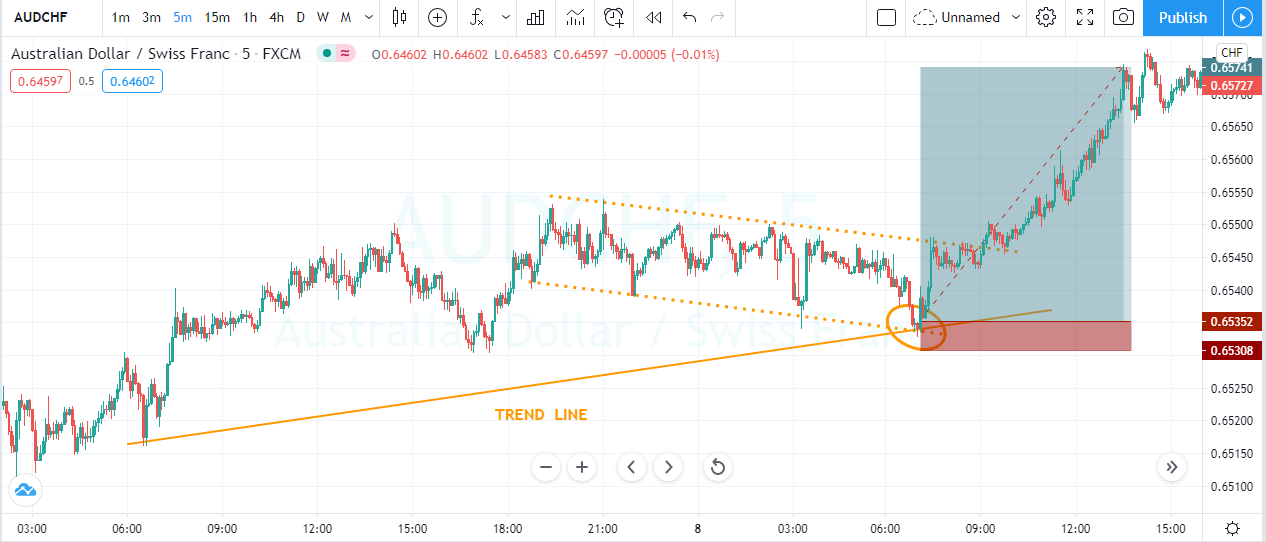
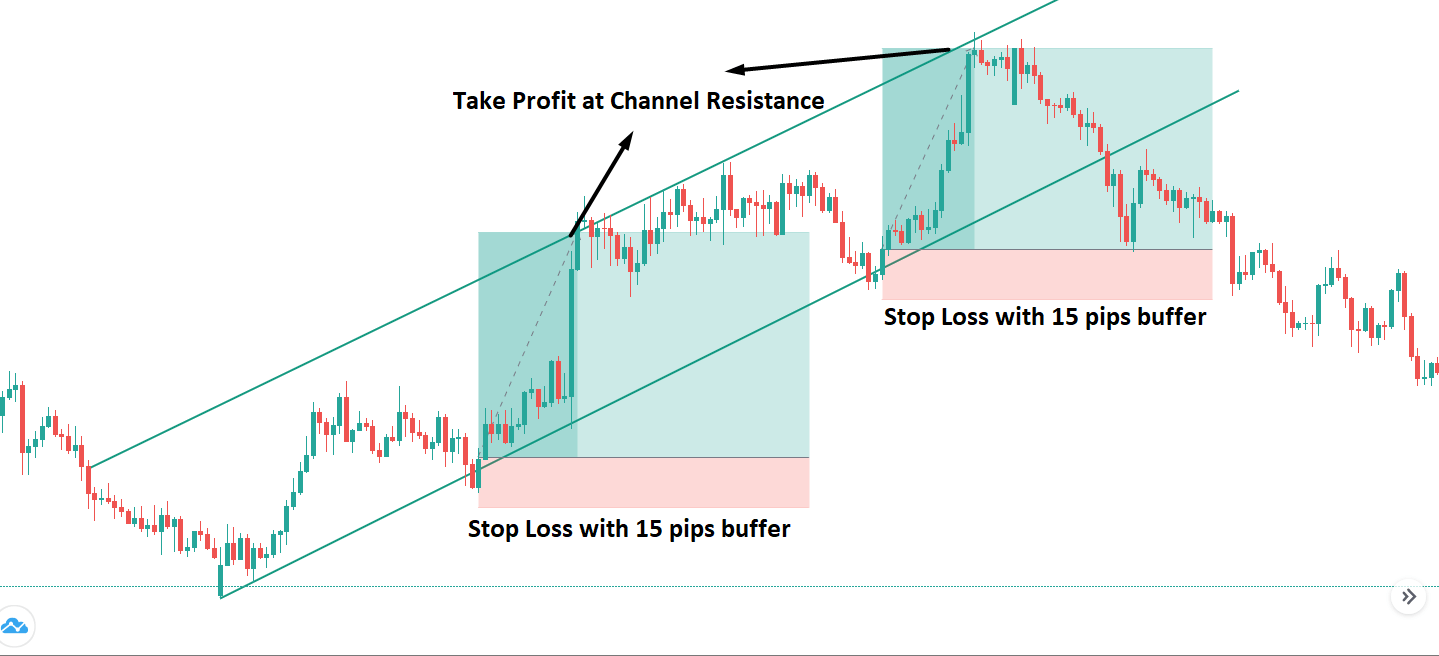
Descending Top Breakout Trading Strategy

As we know, the descending top is a pattern that gives the selling trades. But in this strategy, we will show you how to use it to take the buy trades. To enter a buying trade, we should wait for the price action to break above the descending top trend line. Your stop-loss order must be placed below the last bottom of the chart. Stay in the trade as long as price action prints the brand new higher high and exit your whole position when the prices break below the upper trend line.

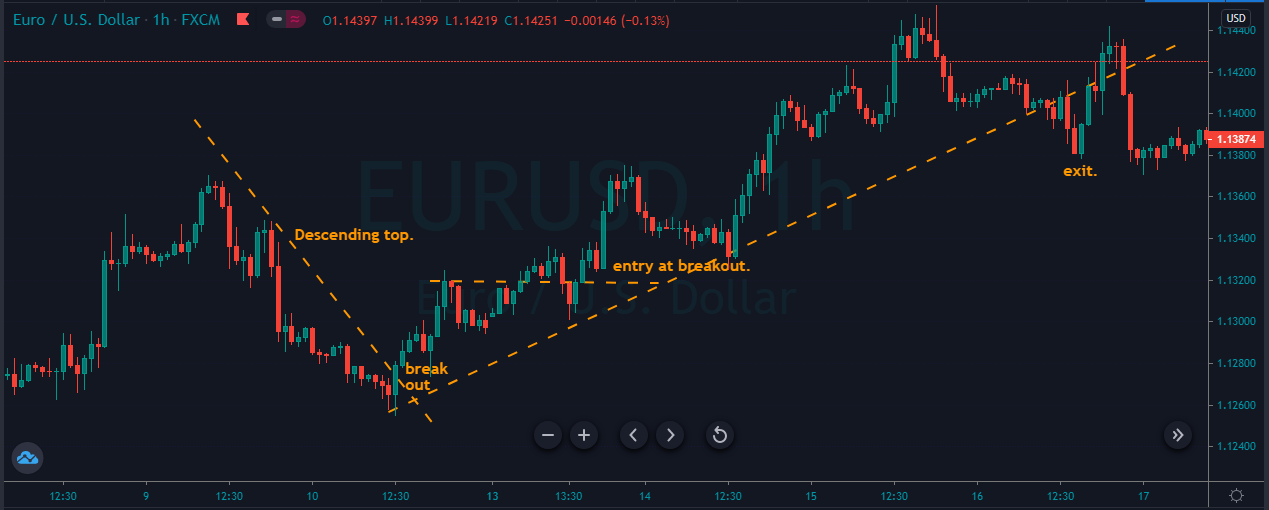
The image below represents the descending top pattern on the price chart, and also it represents our entry, exit, and stop-loss in this pair. As you can see, when the price action prints the descending top pattern, it immediately goes down, and it prints the lower low.

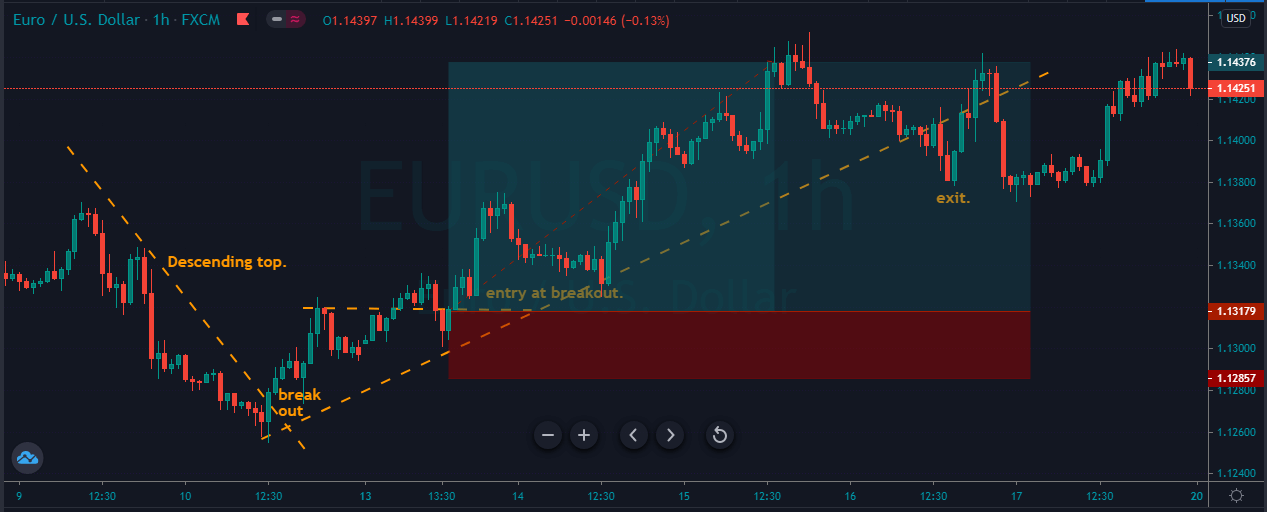
In this one, we were looking for the breakout above the descending top chart pattern, and when the breakout happened, we were all set to take the buy trade. After our buy entry, price action prints a brand new higher high aggressively. When it gave the reversal signal, we choose to close our whole position, and the stops below the entry should be good enough.

Strategy Roundup

The descending top is a chart pattern that gave us potential selling trades. Trading this pattern is quite reliable, and when it gives the trading opportunity, we must trust it and go big. To identify this pattern, we must spot a price top, followed by a lower top. Take an entry below the most recent higher low and go for the brand new lower low and place the stop loss just above the entry. If you desire a safe trade, choose to place the stop loss above the first top.

We hope you find this educational article informative.  Let us know if you have any questions in the comments below. Cheers!

Categories
Forex Basic Strategies

Top 3 Terrific Ways To Trade Price Channels Like A Pro

Introduction

A price channel is a state of the market that slopes up or down bounded by a trendline above and below the asset’s price. The upper trend line acts as a resistance to the price, while the lower trend line acts as support. The price channel helps traders maintain the focus on the price alone, unlike the other trading tools, which are plotted directly over the price chart. In an uptrend, as long as the price advances and moves within the channel, the underlying asset trend is considered bullish. The break below the channel line is a sign of the trend being reversed. Two main components of the price channel are the Main Trend Line & the Channel Line.

Main Trend Line – It takes a minimum of two to three points on the price chart to draw the trend line. The line sets the tone for the price slop as well as the trend. To draw a bearish trend line, we need at least three reaction points at the highs. To draw a bullish trend line, we also need two to three reaction lows on the price chart.

Channel Line – After drawing the main trend line, we draw the channel line parallel to the main trend line. For drawing the channel line, we also need two to three reaction highs and reaction lows in accordance with the trend. This channel line also acts as a support in an uptrend and resistance in a downtrend.

Trading Strategies To Trade The Price Channel

Trends + Channel

Channels are perfect to trade the pullback markets. It is advisable to look for the price channel that is sloping at a healthy angle. Don’t try to trade the steep or flat channels as they won’t provide good trading opportunities.

Firstly find a trending market and mark at least two reactions of highs and lows. For taking buy entries, wait for the price to touch the channel line and for selling trades, wait for the prices to touch the main trend line. Remember not to trade both buy and sell opportunities in an up-trending market. This approach is used by amateur traders who fail most of the time as we are going against the flow.

The price chart below indicates the price channel on the AUD/NZD forex pair.

The price gave the first selling opportunity on the 16th of May and the second trade was around 19th May. These trades printed a brand new lower low, and we closed our trades when the prices broke the channel.

Reversals + Channels 

In this strategy, we need two timeframes to find accurate trading opportunities. Look for an uptrend on the higher timeframe and then see the same chart on a lower timeframe. On the lower timeframe, let the price to pull back enough. When the prices gave enough pullback, draw the price channel on that pullback. If the prices break below the channel line (in an uptrend) and get knocked back immediately, it is a sign for us to go long. When this happens, we can expect a brand new higher high.

As you can see in the image below, the pair was in an overall downtrend. During the pullback phase, price action tries to break the price channel but get knocked back immediately. It means that some buyers are trying to take the price higher, but the aggressive sellers are grabbing the opportunity to fill a few more orders. After the fake-out, prices held inside the price channel for a bit, and after a few hours, we witnessed a brand new lower low.

Breakouts + Channel

Breakout trading is the most common yet effective approach to take high probability trades. Firstly, find an up-trending market and draw a price channel. Wait for the price to approach any significant level and break below the price channel to take the trade. When the price action goes below the channel line, it is a sign for us to go short. Similarly, in a downtrend, draw the price channel and let the price approach any significant level to take the breakout trade. After the breakout, go long and place the stops just below your entry. If the price holds after the breakout, it is a great sign to take the trade.

The image below represents a sell trade in the GBP/AUD Forex pair. As you can see, the prices were in an uptrend, and when the sellers broke below the price channel, we took a sell trade. We choose a smaller stop-loss order as the channel line also acts as dynamic support to the prices. For booking profits, a higher timeframe support area was a perfect place.

Conclusion

Trading Channels are effective as they provide numerous trading opportunities when the market is moving in that state. You can use all the mentioned ways stated above to trade a channel or use the method that best works for you. When trading, the channel always trade with the trend. Do not over trade whatsoever. If you get used to it, sooner or later, you will blow your trading account. Don’t do this. Instead, always follow the trend. The trend is your friend. Let the market pullback to the channel line to trade with the trend. Another approach is to wait for the prices to break the channel to trade the reversals. These simple approaches are healthier ways to grow your trading account while trading channels. All the best!

Categories
Forex Basic Strategies

The Best Tools to Trade Pullbacks Effectively

A Pullback is a pause, retracement, or consolidation of a price from the most recent peak during an ongoing trend. The pullback is widely seen as a trading opportunity after the underlying asset experienced a large upside or downside move. For example – Any forex pair is in a strong uptrend, and some healthy news came, and price action dropped back to the most recent support area that indicates the professional traders are booking the profits.

Pullbacks happen all the time, and if you learn how to trade them successfully, it can be a great skill as a trader. Trading the pullback is the easiest way to trade the market, sometimes you will recognize the high probability pullback trades and sometimes extreme volatile pullbacks, and you can enhance your repertoire and find many higher probability trades. If you are new in the market, then pullback trading is a fantastic and easy way to find superior risk-to-reward ratio trades. In this article, we will explore five trading strategies that provide excellent pullback trades.

Pullback Trading Strategies

Two-Legged Pullback To The MA 

Al Brooks popularized the concept of two legs pullback in his price action books. He explained most of the time, price action print two legs to reach the moving average. We backtested his strategy and found out that his techniques work very well in the trending market, but sometimes in the strong trending market, you will only witness one leg.

This is because most market operators are in a hurry to move the market; this may be because of any fundamental news. To filter out all the low probability trades, it is advisable to find a trending market and then wait for the price action to print the two legs towards the moving average, and when all the moves complete, take the buy entry.

The image below represents the buying trade in the EURGBP forex pair. The moving average indicates the buying trend in the currency. Price action pulled back to the moving average, prices responded from the moving average and goes a bit higher and end up printing the second leg. The second leg goes down to the moving average, but the strong buyers smack back up and close above the moving average. Furthermore, the price slows down a bit, and we took buying entry with the stops below the entry, and for taking profit, we choose the brand new higher high.

Candlestick Pattern + MA

This method will use the bullish engulfing candlestick pattern with a moving average to successfully trade the market.

Here we need two ingredients.

  1. Price action pullback to the moving average.
  2. The market forms a bullish engulfing pattern.

First of all, look for the strong trending market and wait for price action to approach the moving average. At this stage, if the price action prints the engulfing pattern,  it’s the right time for you to go for a buy entry. Otherwise, no entries are allowed for you. An  Engulfing Pattern indicates the sellers try to print the brand new lower low, but because of dynamic support of moving average prices pulled back and buyers end up eating all the sellers. As a result, we witnessed the Bullish Engulfing pattern.

The image below represents the buying trade in the EURNZD forex pair. As you can see, at the end of the downtrend, price action goes above the moving average, and we witnessed the engulfing pattern. The trading pattern closed above the moving average, which was a confirmation of buyers came back to the show and were expecting the brand new higher high.

Trendlines + Channel Trading

This one is the simple trading approach, which is not much popular, but it often generates wonderful trading results. First of all, you must draw the trend line to the ongoing trend, and when the price action pulls back enough, then draw the price channel to identify the oversold and overbought area. When price action approaches the trend line as well as the lower line of the price channel, it is an indication to go long.

The image below represents the buying entry in the AUDCHF forex pair. The trend line was the indication that the buyers are leading the show. During the pullback phase, when enough sellers approach the trend line and the lower channel line, it gave the strong buying candle. The reason we got the strong candle is because for the support and resistance trader, the zone was a dynamic support area to go long.

RSI + Stochastic Indicator

In this approach, we are using the two oscillators to trade the pullbacks. Stochastic and RSI both are oscillators, and they both oscillate between the significant levels. In an uptrend, wait for the price action to pull back. When the stochastic and RSI gave the oversold signal, it is a perfect time to go for a brand new higher high.

The image below indicates the buying trade in the AUDCHF forex pair. The pair was overall in an uptrend, and during the pullback, both of the indicators were showing the oversold signals, and the reversal at the oversold area was a great sign to go long. When both oscillators indicate the same sign, there is no point in going for more significant stops. When both oscillators gave the reversal signal at the significant resistance level, that’s a perfect time to close your trade.

Conclusion

All the pullback strategies share the same goal, which is to time the market. The better you master the skill of timing before the take-off, the more profits you will make. If you are a newbie trader, then master these strategies first on the demo and then apply to the live market because trying any of these strategies in the live market is dangerous without having any experience.

So never try anything on the live account. Instead, practice them on demo first and then make a profit on a live account. When you master these strategies, then you can very easily design a pullback strategy for yourself. Whichever strategy fits nicely into your trading approach, master it.

Categories
Forex Basic Strategies

Dynamic Channel Trading Using The Concepts Of Price Action!

Introduction

In forex, the dynamic channel trading is a profitable strategy that forms with standard trendlines. It indicates a potential move to identify the market direction both to the downside and upside. On the other hand, price action is a method to identify the price direction based on price behavior. Therefore, we can create a profitable trading strategy by reading the price action from any channel support and resistance level.

In general, traders use price channel as a technical analysis tool that helps to identify the potential market movement. The dynamic channel moves like a zigzag by creating lower lows and higher highs. In Forex trading, we usually have two types of dynamic channels:

  • An upward or ascending channel
  • Downward or descending channel

Dynamic Channel Identification

We can easily identify the dynamic channel by connecting the swing lows or swings highs they create. In an upwards dynamic channel, it will move with the price with a higher high formation.

Similarly, in a downward dynamic channel, it will move with the price by creating lower lows.

In the image above, we can see that the higher highs and the lower lows connected through straight lines. The dynamic price channel shows a significant movement from down to upside in the trend line. The trendline below the price may work as a dynamic support level, and the trendline above the price may work as a dynamic resistance level.

Besides the dynamic channel, we will use the concept of price action by measuring what buyers and sellers are doing in the market. Any slower and corrective movement from the dynamic channel support and resistance would indicate a possibility of a potential market reversal.

Later on, we will use the appropriate reversal candlestick from that area to enter a trade. In this trading strategy, we can make a profit when the price is trading within the channel, or it breaks out from the channel. However, we will filter out the unusual false movement by reading the price action.

Bullish Dynamic Channel Trading Strategy

In the bullish channel continuation trade setup, we will identify the price that is moving upside within the channel.

Identify the Price Location

Central banks and big financial institutes drive the price of a currency pair. Therefore, institutional traders focus on long timeframes mostly, as it provides the most reliable price direction. Therefore, we will move to the daily or weekly timeframe and identify the location of the price. We will consider channels that only meets the following condition:

⚠️ An upward channel should move within an uptrend above a key support level.

Entry

In an upside movement of a price channel, there will be new higher highs. Therefore, we need to identify a price channel where the price moves down towards channel support with a corrective speed. We will enter the trade as soon as the price rejects the channel support with a reversal candlestick formation.

Stop Loss

In a bullish channel trading, the stop loss would be below the reversal candlestick with 10 to 15 pips buffer.

Take Profit

The primary aim of the taking profit would be the immediate channel resistance. However, we have to read the price action to make a trading decision regarding the take profit.

If the price starts to move with an impulsive bullish pressure, it can go beyond the channel resistance. In that case, we can take some partial closing 10-15 pips below the channel resistance and wait for the price to test any event level.

Bearish Dynamic Channel Trading Strategy

In the bearish channel continuation trade setup, we will identify the price that is moving downside within the channel.

Identify the Price Location

Based on the price action context, we will move to the daily or weekly timeframe and identify the price’s location. We will consider channels that only meets the following conditions:

⚠️ A downward channel should move within a downtrend from a key resistance level.
Entry

In the downward price channel, there will be lower lows. Therefore, we need to identify a price channel where the price is moving down towards a channel resistance with a corrective speed. Therefore, we will read the price action and enter the trade as soon as it rejects the channel resistance with a reversal candlestick pattern.

Stop Loss

In the bearish channel trading, the stop loss would be above the reversal candlestick with 10 to 15 pips buffer.

Take Profit

The primary aim of the taking profit would be the immediate channel support. However, we have to read the price action to make a trading decision regarding the take profit.

If the price starts to move with an impulsive bearish pressure, it can go beyond the channel support. In that case, we can take some partial closing 10-15 pips above the channel support and close the rest of the amount at the next event level.

Channel Breakout Trading Strategy

In forex trading, when the price crossed (above or below) the channel, there is a profitable trading strategy. For making the trade sustainable, we need to identify the speed of the breakout. When institutions or banks enter the market, we see such massive breakout from the channel support or resistance.

Entry

After a massive breakout from a dynamic channel, we will wait for a correction. The correction indicates that the massive breakout would be strong. We will wait until the price moves to the channel support or resistance level with a corrective speed and enter the trade as soon as it rejects the level with a reversal candlestick formation.

Stop Loss

Setting a stop loss is similar to the channel continuation trade setup. You can put your stop loss above or below the reversal candlestick with 10 to 15 pips buffer.

Take Profit

The primary target of the channel breakout is the immediate event level. However, you can extend the take profit by reading the price action. If the power of the breakout is strong, the price may move beyond the immediate event level.

Conclusion

The Forex market is a competitive trading market where trade management is a key element for a forex trader. No trading strategy can assure you a confirmed profit. Therefore, it is recommended to use not more than 2% risk per trade and move the stop-loss at breakeven as soon as the price creates new lows or highs.