Introduction
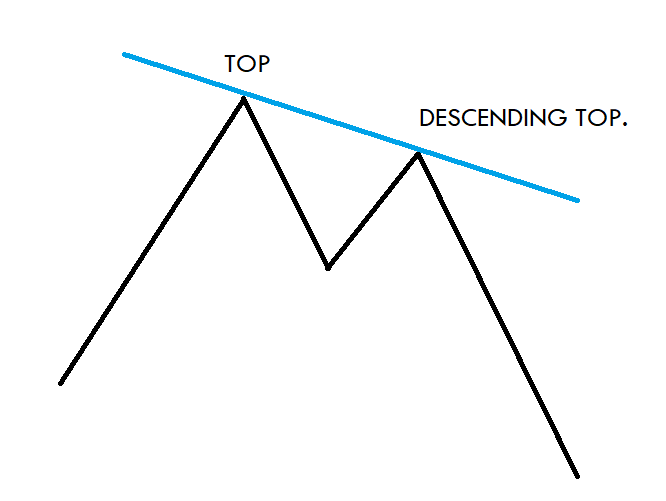
The Descending Top is a technical chart pattern that frequently appears on the Forex price charts. Each peak of the price in this pattern is lower than its previous peak. The descending top chart pattern’s appearance indicates a downtrend in the market, and we must only look for sell trades at that point.
This pattern can be recognized when the first peak is lower than the second peak and the second peak is lower than the third peak. For instance, if the first peak is at 88.00, and the price drops down to 83.00, then the second peak at 85.00, and drop to 80.00, and if the next peak is below 85.00, we can see the descending top pattern forming on the chart, and we should then looks out for selling trade in an underlying asset.
If the next peak is higher than the previous peak, instead of being lower, the pattern gets invalidated, and the market goes up, or it will consolidate. We will often witness the descending top pattern on lower timeframes, and we should not be expecting this pattern to form on the higher timeframes. The reason is that in a higher timeframe, the pullback is very less, and even the trend soon comes to an end.
To identify the pattern, we must spot two tops on the price chart, which are descending, and then we must draw a line to connect these tops.
Descending Tops – Trading Strategies
Now that we know what a descending top pattern is, we will see how to combine it with other technical tools to trade this pattern.
Channel Trading
The first step is to identify the descending top pattern on the price chart. After that, identify the bottom between the two tops and draw a horizontal support line. Then wait for the break below the support line to enter a trade. Place the stop loss below the second top of the pattern and ride the trade. As we know, we cannot stay in a trade forever. We have to close our trade at some point. To close the trade, wait for the price to break the channel.
Example 1
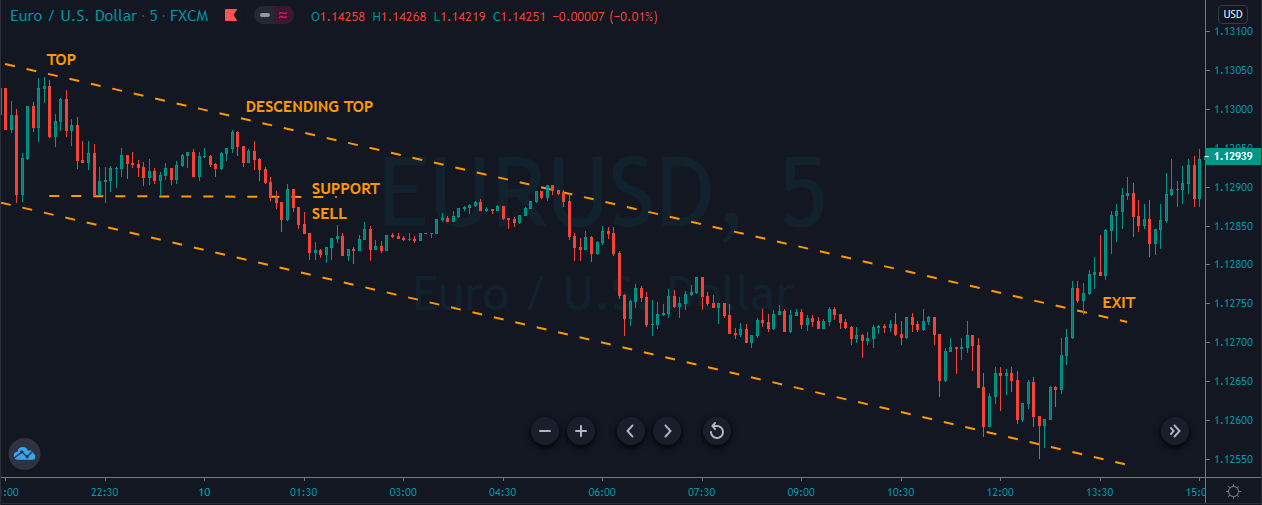
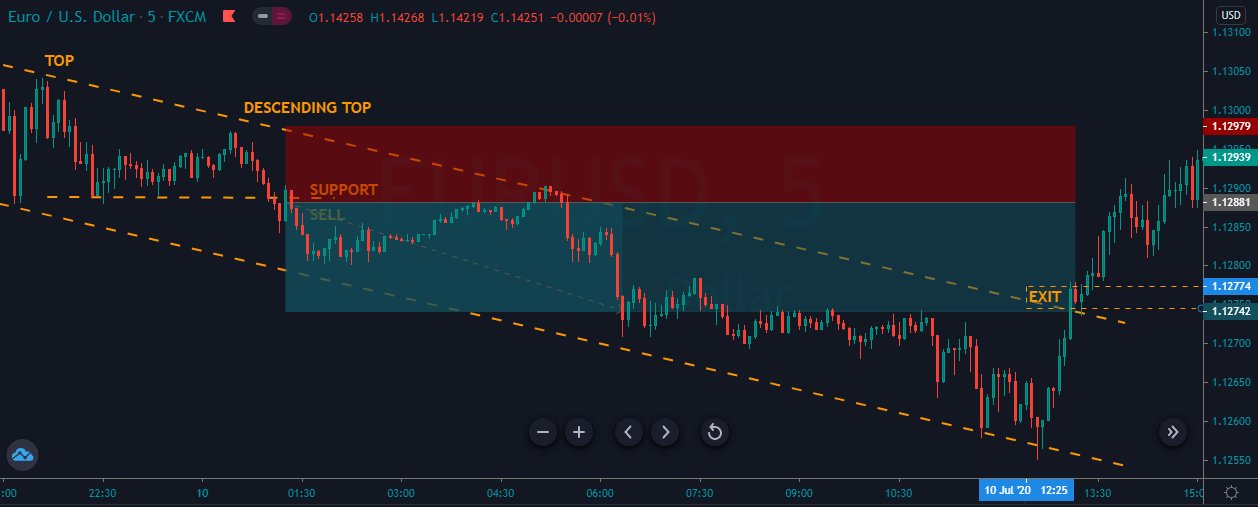
As you can see in the image below, we have identified the descending top pattern in the EUR/USD 5 minute chart.
As you can see, when price action printed the pattern, we started preparing to take sell trades, and when the price broke below the most recent support area, it was a sure sign for us to go short. As we took the sell trade, the price immediately came back to retest the support area. Here, we choose to scale our trade at the support line and go for the brand new lower low.
Initially, our trade goes to a 1.1255 area, and we were looking for more profit in the trade. The trade failed to print the lower low furthermore, and it broke above the channel at around 1.274. Here, we choose to close our trade as that was a sign of the trend getting reversed. The Forex market is all about probabilities. We cannot expect the price to do what we want it to do. Instead, follow the rules of the game. When the market gives less profit, accept it, and don’t try to break the rules.
Descending Top Breakout Trading Strategy
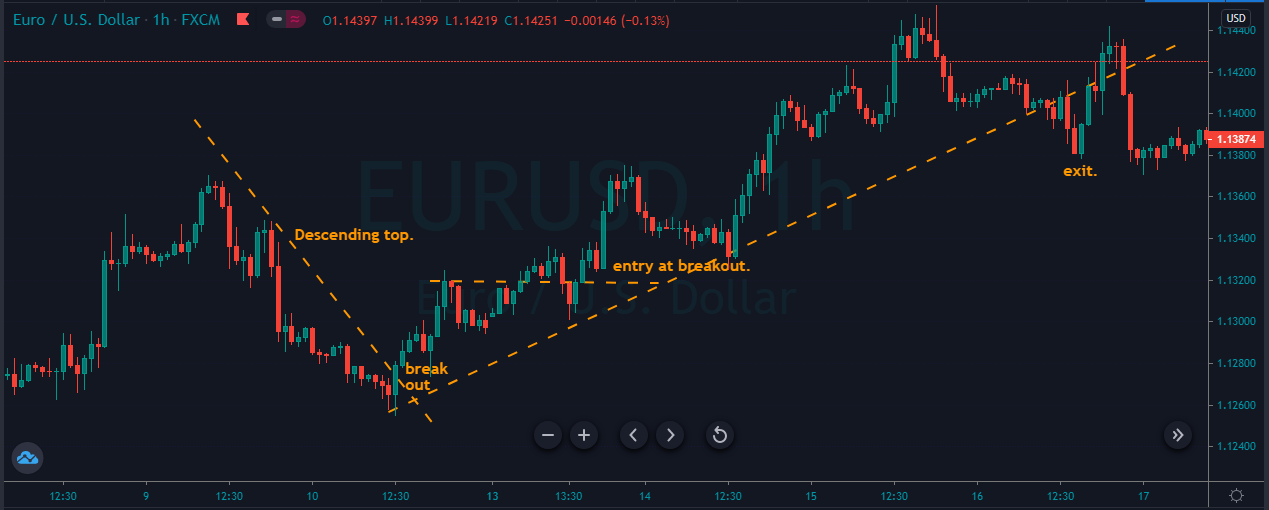
As we know, the descending top is a pattern that gives the selling trades. But in this strategy, we will show you how to use it to take the buy trades. To enter a buying trade, we should wait for the price action to break above the descending top trend line. Your stop-loss order must be placed below the last bottom of the chart. Stay in the trade as long as price action prints the brand new higher high and exit your whole position when the prices break below the upper trend line.
The image below represents the descending top pattern on the price chart, and also it represents our entry, exit, and stop-loss in this pair. As you can see, when the price action prints the descending top pattern, it immediately goes down, and it prints the lower low. 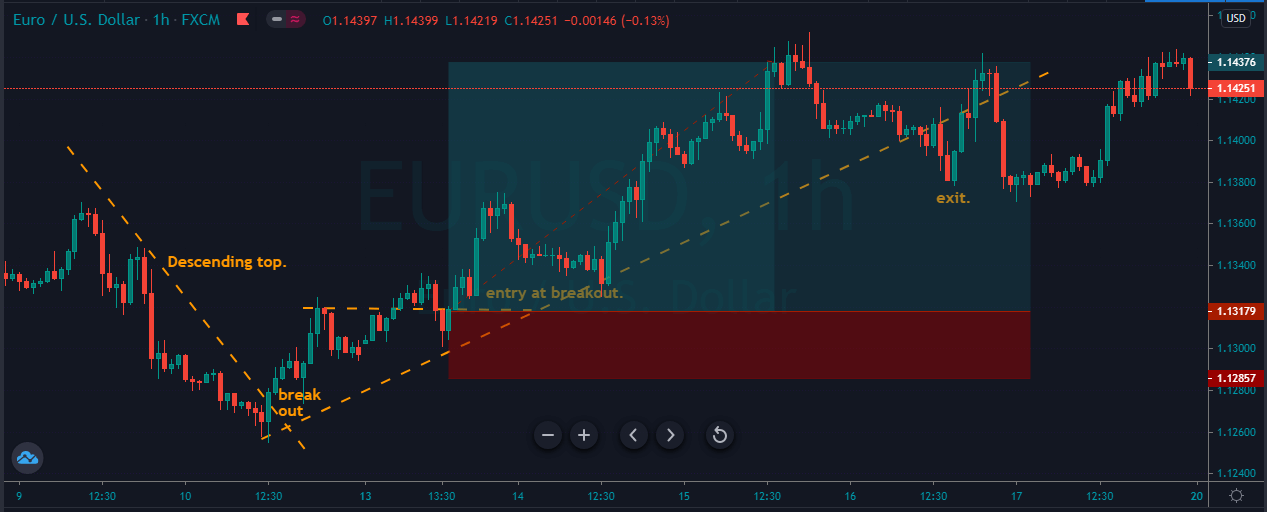
In this one, we were looking for the breakout above the descending top chart pattern, and when the breakout happened, we were all set to take the buy trade. After our buy entry, price action prints a brand new higher high aggressively. When it gave the reversal signal, we choose to close our whole position, and the stops below the entry should be good enough.
Strategy Roundup
The descending top is a chart pattern that gave us potential selling trades. Trading this pattern is quite reliable, and when it gives the trading opportunity, we must trust it and go big. To identify this pattern, we must spot a price top, followed by a lower top. Take an entry below the most recent higher low and go for the brand new lower low and place the stop loss just above the entry. If you desire a safe trade, choose to place the stop loss above the first top.
We hope you find this educational article informative. Let us know if you have any questions in the comments below. Cheers!


