Introduction
In forex, the dynamic channel trading is a profitable strategy that forms with standard trendlines. It indicates a potential move to identify the market direction both to the downside and upside. On the other hand, price action is a method to identify the price direction based on price behavior. Therefore, we can create a profitable trading strategy by reading the price action from any channel support and resistance level.
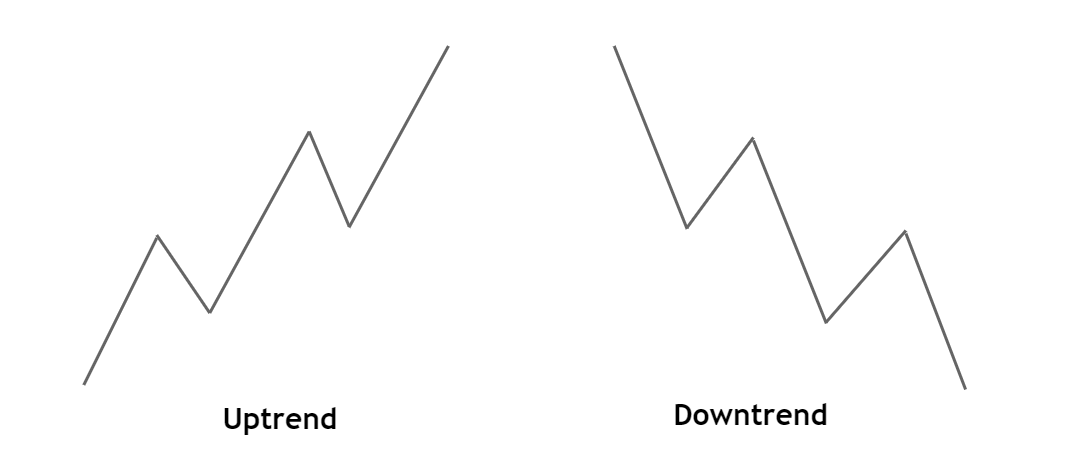
In general, traders use price channel as a technical analysis tool that helps to identify the potential market movement. The dynamic channel moves like a zigzag by creating lower lows and higher highs. In Forex trading, we usually have two types of dynamic channels:
- An upward or ascending channel
- Downward or descending channel
Dynamic Channel Identification
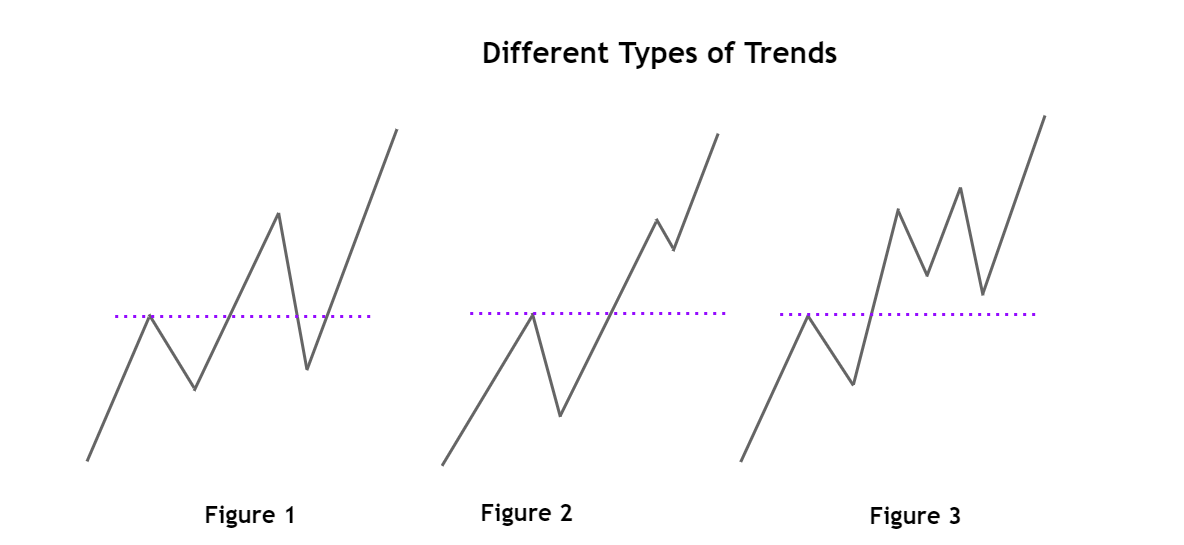
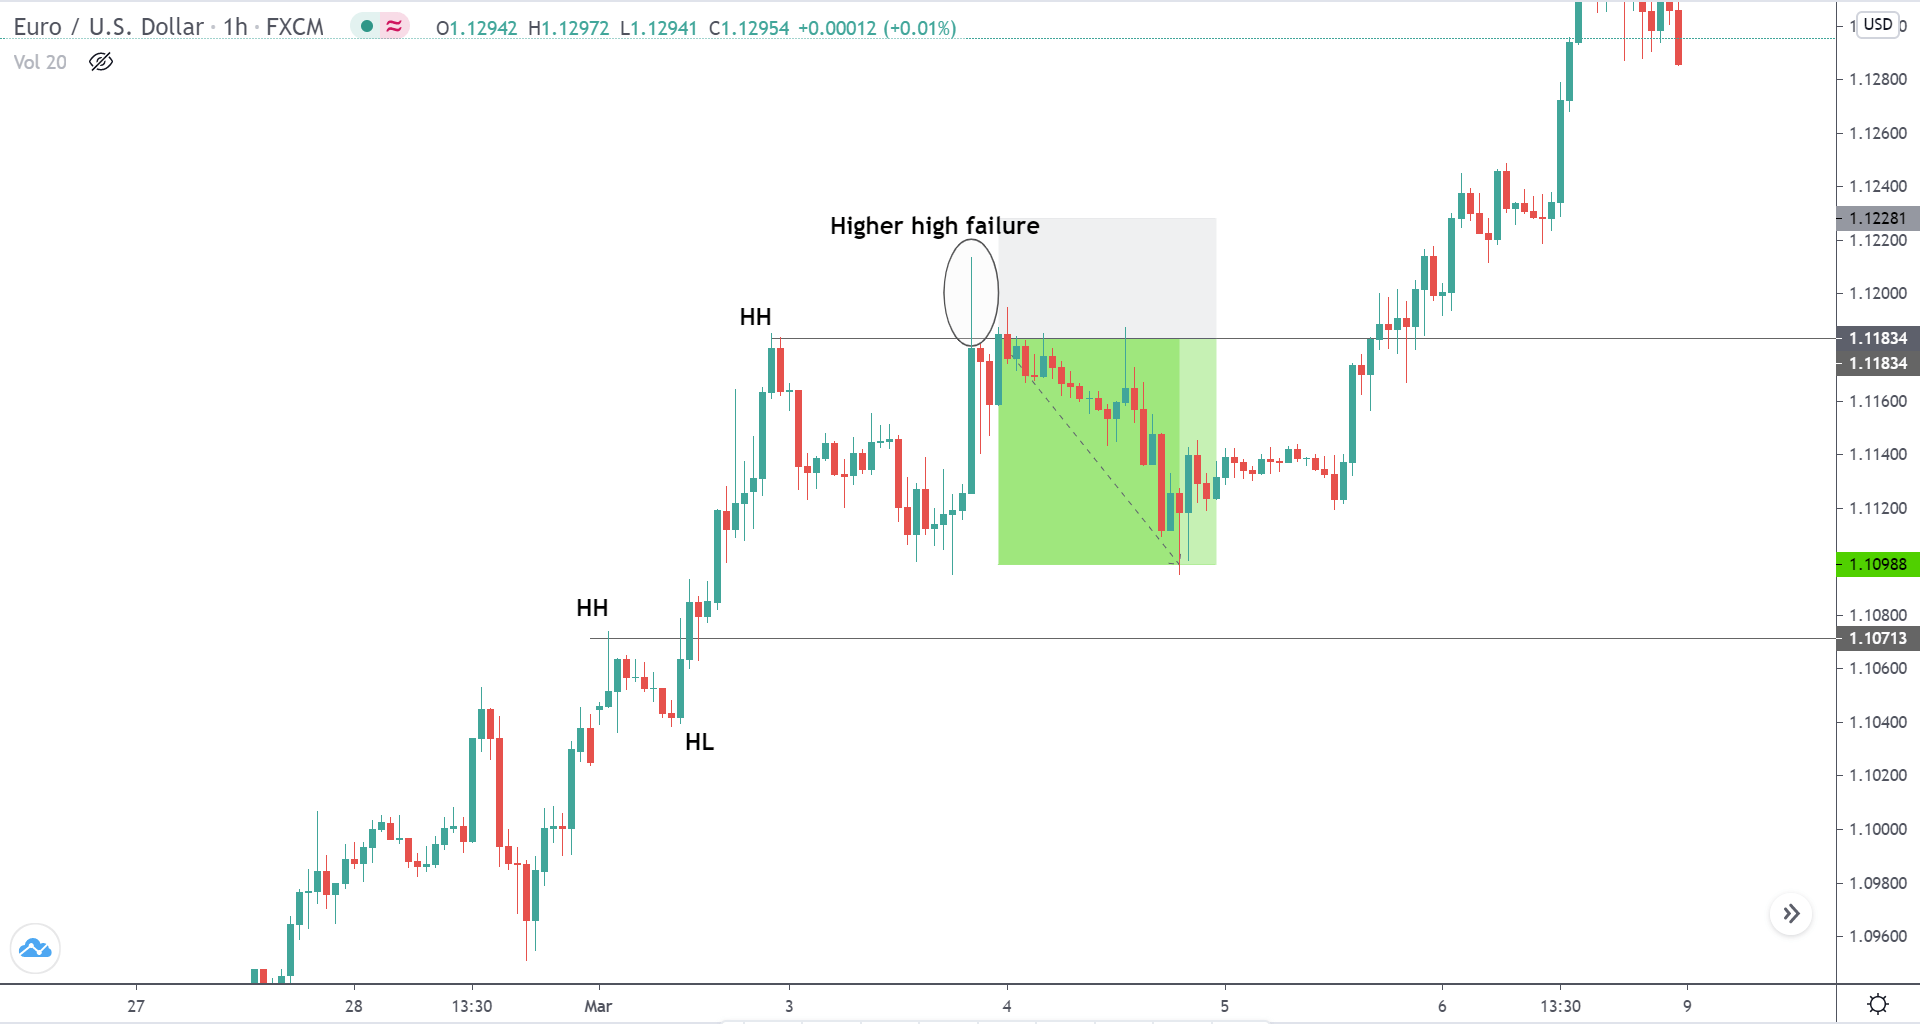
We can easily identify the dynamic channel by connecting the swing lows or swings highs they create. In an upwards dynamic channel, it will move with the price with a higher high formation.

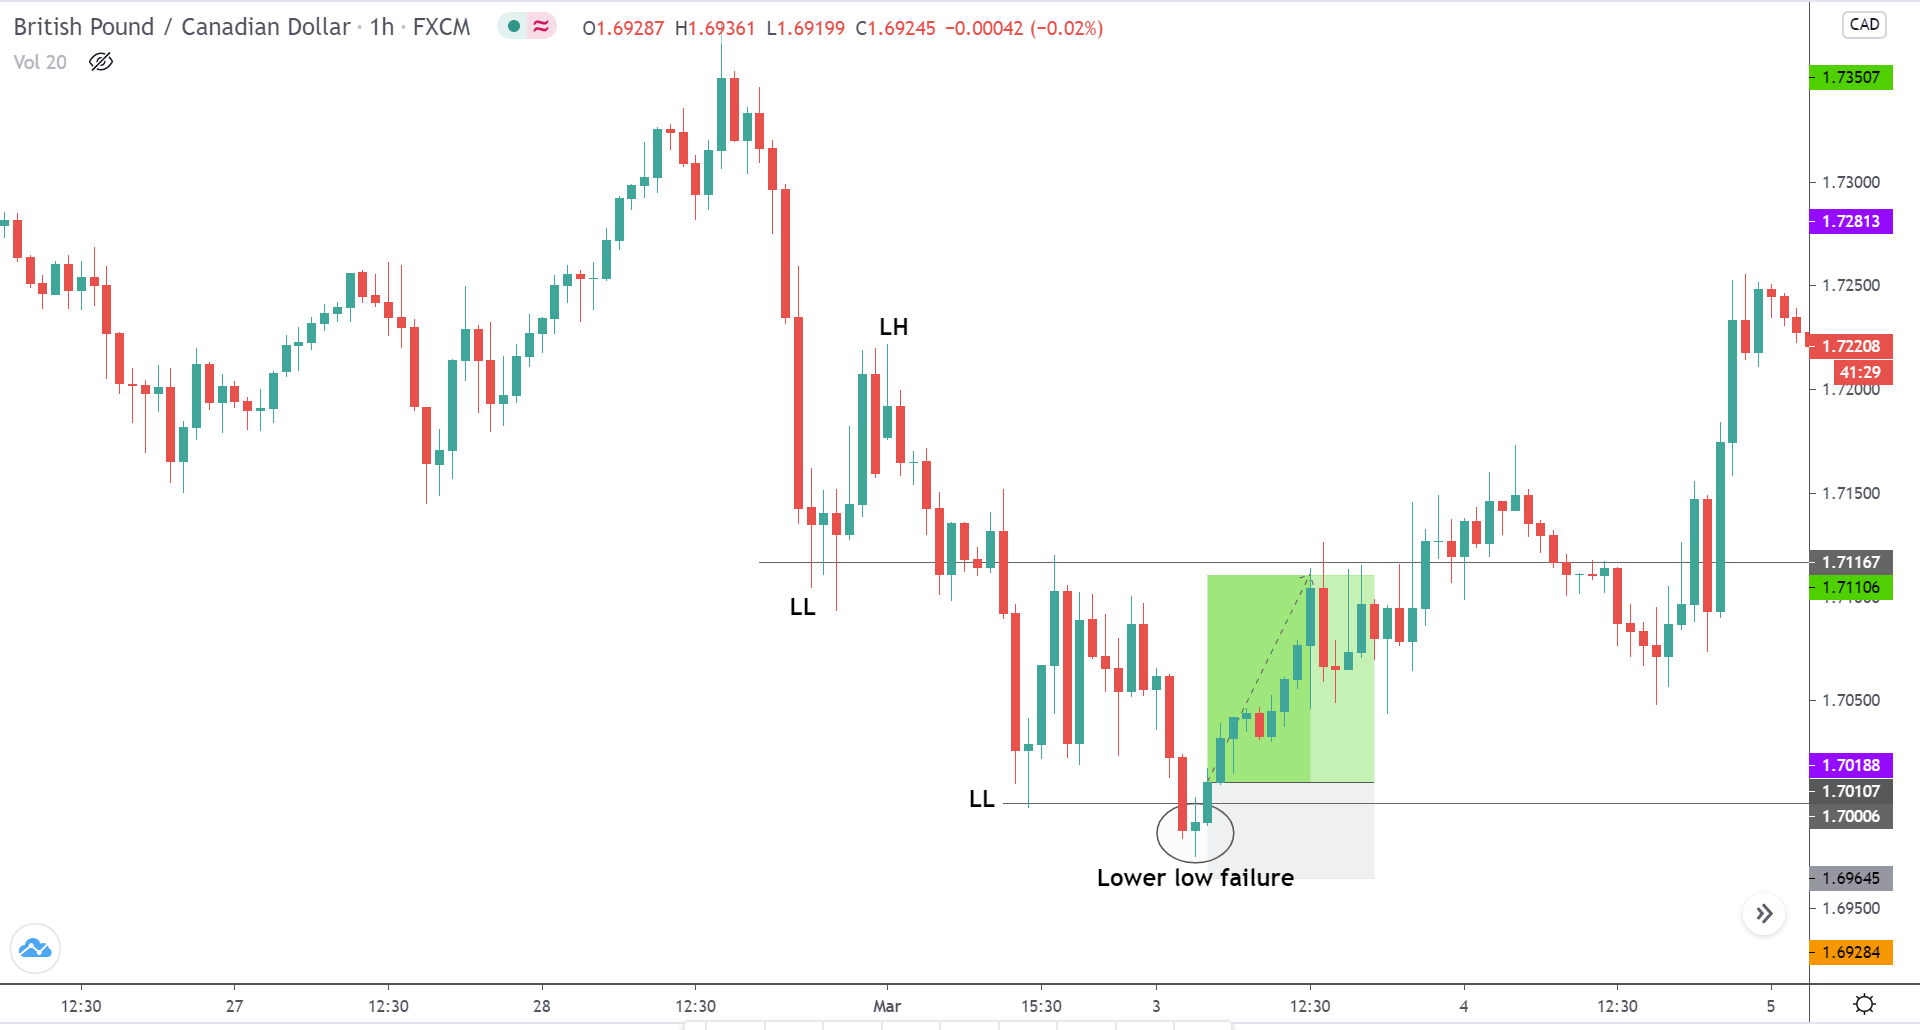
Similarly, in a downward dynamic channel, it will move with the price by creating lower lows.

In the image above, we can see that the higher highs and the lower lows connected through straight lines. The dynamic price channel shows a significant movement from down to upside in the trend line. The trendline below the price may work as a dynamic support level, and the trendline above the price may work as a dynamic resistance level.
Besides the dynamic channel, we will use the concept of price action by measuring what buyers and sellers are doing in the market. Any slower and corrective movement from the dynamic channel support and resistance would indicate a possibility of a potential market reversal.
Later on, we will use the appropriate reversal candlestick from that area to enter a trade. In this trading strategy, we can make a profit when the price is trading within the channel, or it breaks out from the channel. However, we will filter out the unusual false movement by reading the price action.
Bullish Dynamic Channel Trading Strategy
In the bullish channel continuation trade setup, we will identify the price that is moving upside within the channel.
Identify the Price Location
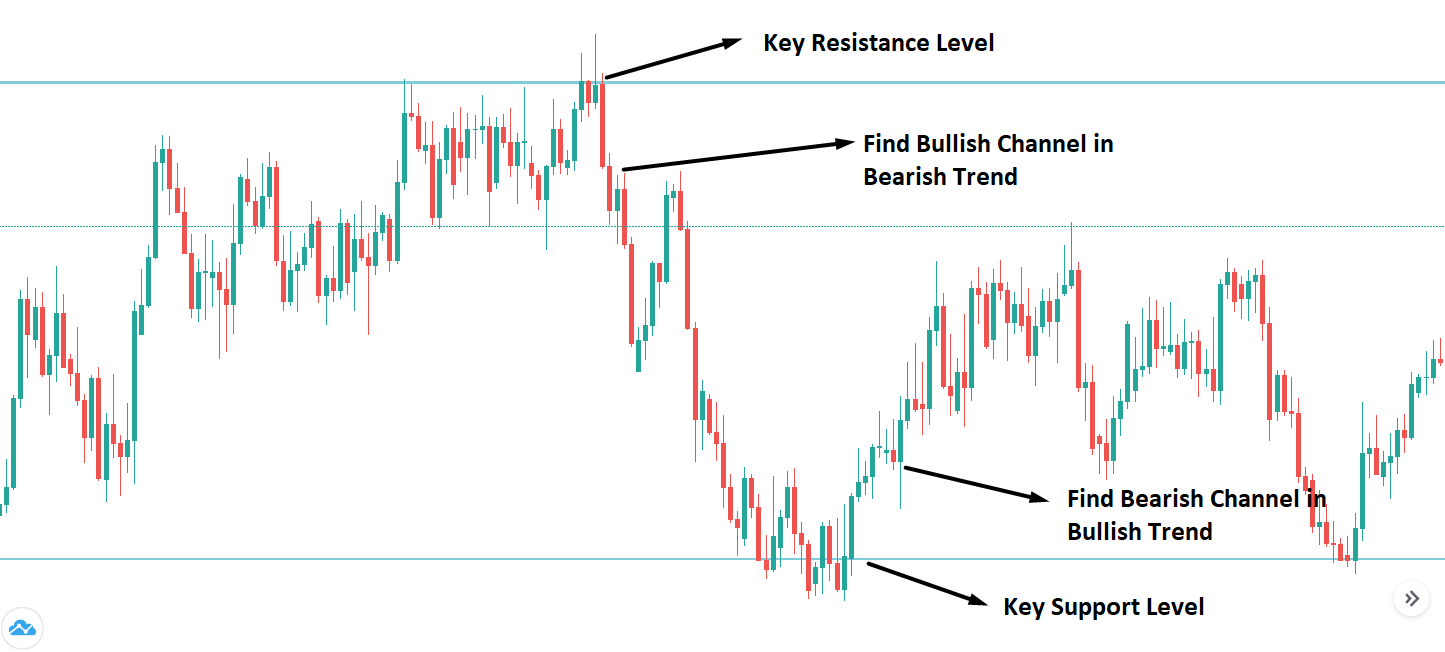
Central banks and big financial institutes drive the price of a currency pair. Therefore, institutional traders focus on long timeframes mostly, as it provides the most reliable price direction. Therefore, we will move to the daily or weekly timeframe and identify the location of the price. We will consider channels that only meets the following condition:
⚠️ An upward channel should move within an uptrend above a key support level.
Entry
In an upside movement of a price channel, there will be new higher highs. Therefore, we need to identify a price channel where the price moves down towards channel support with a corrective speed. We will enter the trade as soon as the price rejects the channel support with a reversal candlestick formation.
Stop Loss
In a bullish channel trading, the stop loss would be below the reversal candlestick with 10 to 15 pips buffer.
Take Profit
The primary aim of the taking profit would be the immediate channel resistance. However, we have to read the price action to make a trading decision regarding the take profit.
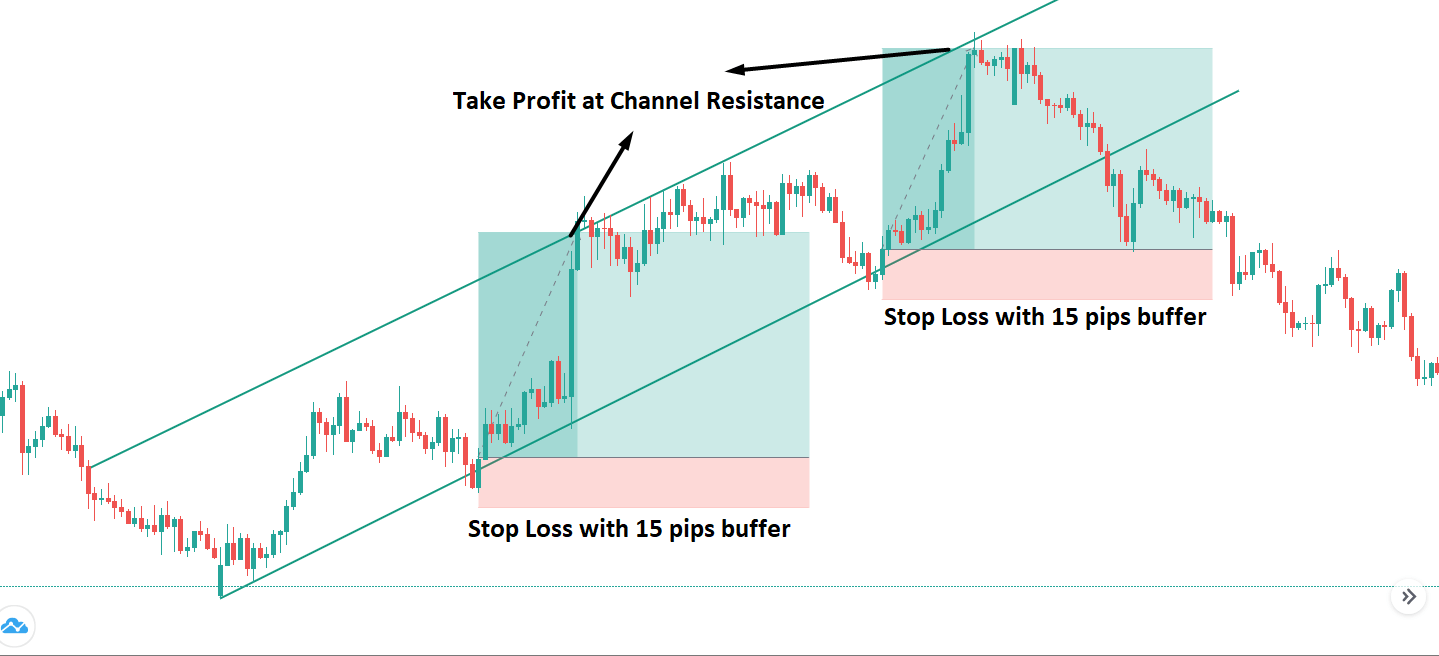
If the price starts to move with an impulsive bullish pressure, it can go beyond the channel resistance. In that case, we can take some partial closing 10-15 pips below the channel resistance and wait for the price to test any event level.
Bearish Dynamic Channel Trading Strategy
In the bearish channel continuation trade setup, we will identify the price that is moving downside within the channel.
Identify the Price Location
Based on the price action context, we will move to the daily or weekly timeframe and identify the price’s location. We will consider channels that only meets the following conditions:
⚠️ A downward channel should move within a downtrend from a key resistance level.
Entry
In the downward price channel, there will be lower lows. Therefore, we need to identify a price channel where the price is moving down towards a channel resistance with a corrective speed. Therefore, we will read the price action and enter the trade as soon as it rejects the channel resistance with a reversal candlestick pattern.
Stop Loss
In the bearish channel trading, the stop loss would be above the reversal candlestick with 10 to 15 pips buffer.
Take Profit
The primary aim of the taking profit would be the immediate channel support. However, we have to read the price action to make a trading decision regarding the take profit.
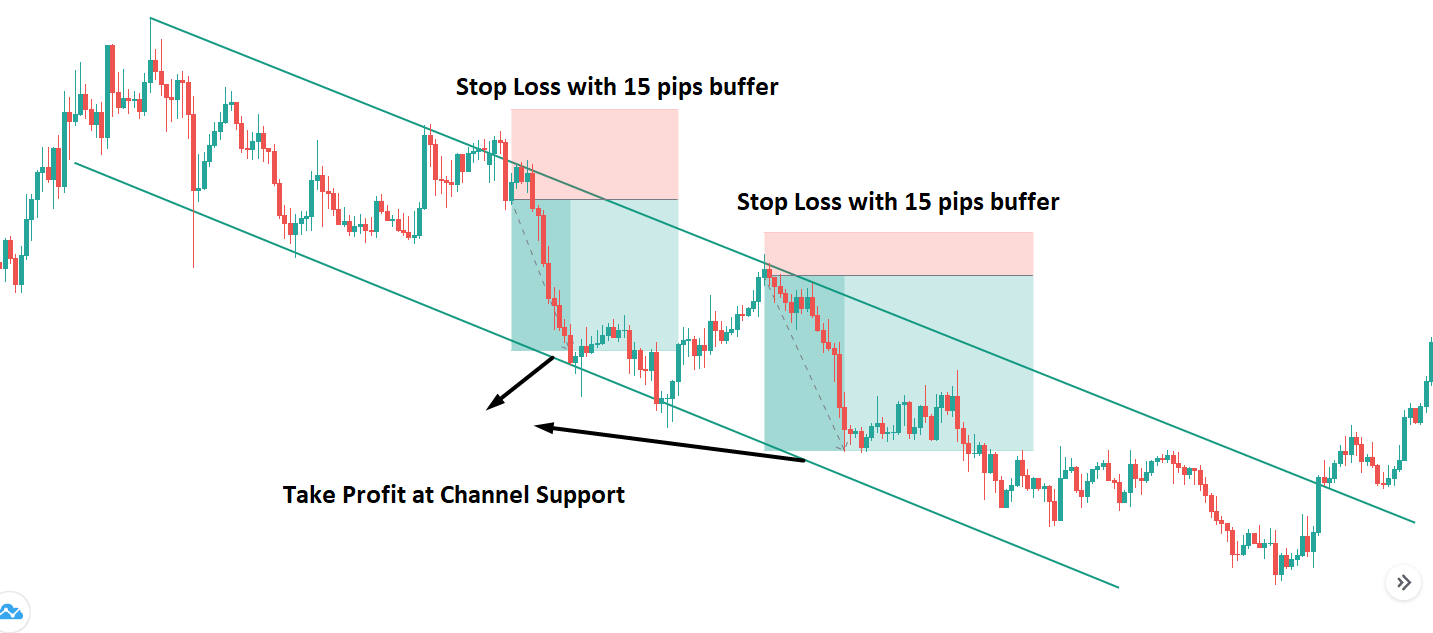
If the price starts to move with an impulsive bearish pressure, it can go beyond the channel support. In that case, we can take some partial closing 10-15 pips above the channel support and close the rest of the amount at the next event level.
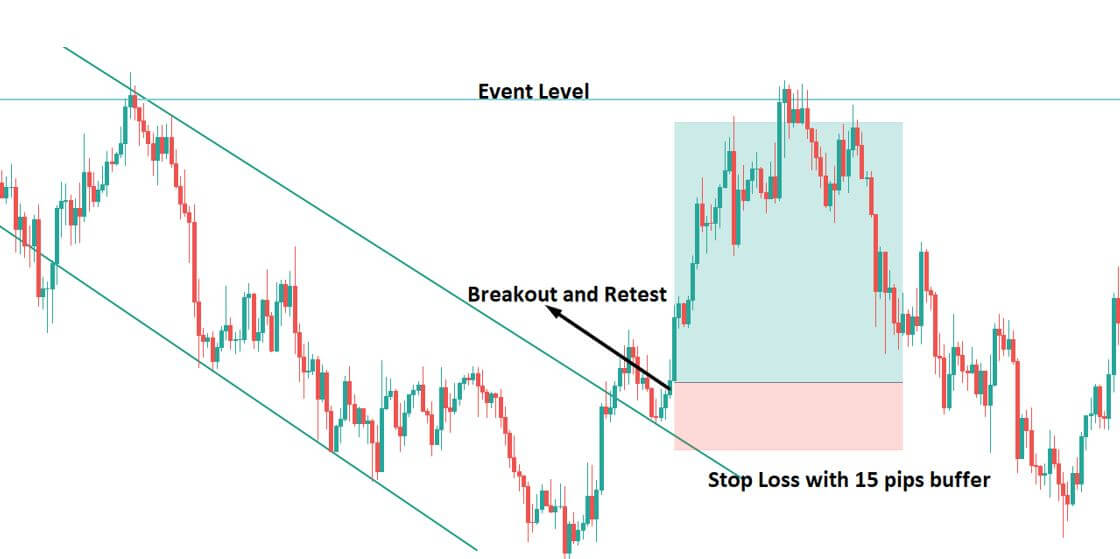
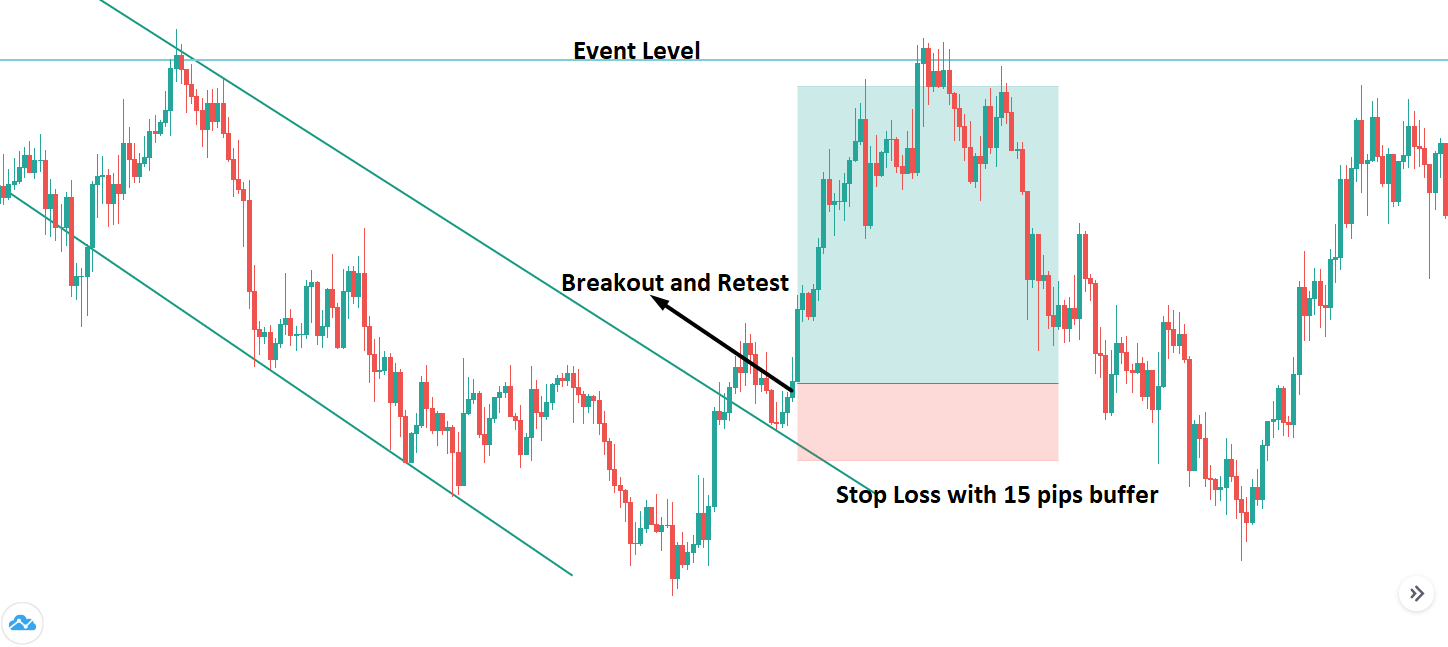
Channel Breakout Trading Strategy
In forex trading, when the price crossed (above or below) the channel, there is a profitable trading strategy. For making the trade sustainable, we need to identify the speed of the breakout. When institutions or banks enter the market, we see such massive breakout from the channel support or resistance.
Entry
After a massive breakout from a dynamic channel, we will wait for a correction. The correction indicates that the massive breakout would be strong. We will wait until the price moves to the channel support or resistance level with a corrective speed and enter the trade as soon as it rejects the level with a reversal candlestick formation.
Stop Loss
Setting a stop loss is similar to the channel continuation trade setup. You can put your stop loss above or below the reversal candlestick with 10 to 15 pips buffer.
Take Profit
The primary target of the channel breakout is the immediate event level. However, you can extend the take profit by reading the price action. If the power of the breakout is strong, the price may move beyond the immediate event level.
Conclusion
The Forex market is a competitive trading market where trade management is a key element for a forex trader. No trading strategy can assure you a confirmed profit. Therefore, it is recommended to use not more than 2% risk per trade and move the stop-loss at breakeven as soon as the price creates new lows or highs.