On their path to learning how to trade in the forex market, some traders may need time distinguishing between trend trading and reversal trading. Aside from these two, traders have become aware of counter-trends, which is yet another concept shared and discussed in the forex community. Although even its name contains the word trend, traders across the world express their concerns not wanting to face the reversals scenario. As a counter-trend always moves against the prevailing trend, the majority believes that the odds of it winning that trade are low. Today we are finally helping you to understand what a counter-trend is and how it can impact a trader’s account.
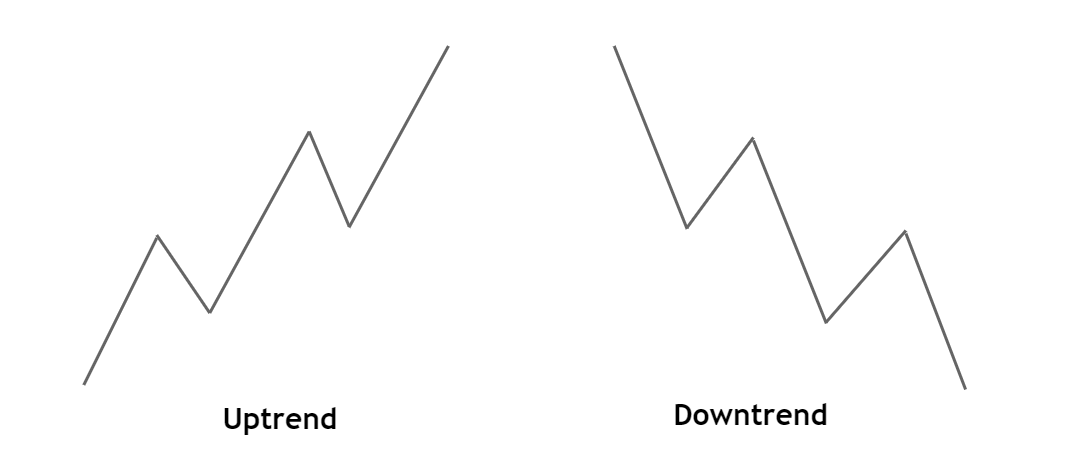
Traders normally take a look at any currency pair and compare the price on the left end of the chart to the price at this very moment, which helps them conclude whether they are in an uptrend (the price is now higher) or a downtrend (the price is now lower). However, determining whether you are looking at a counter-trend may be a tougher job than it seems at first. If we take into consideration the time frame we are using and how zoomed in or zoomed out we are, we can question whether a precise definition of a counter-trend exists.
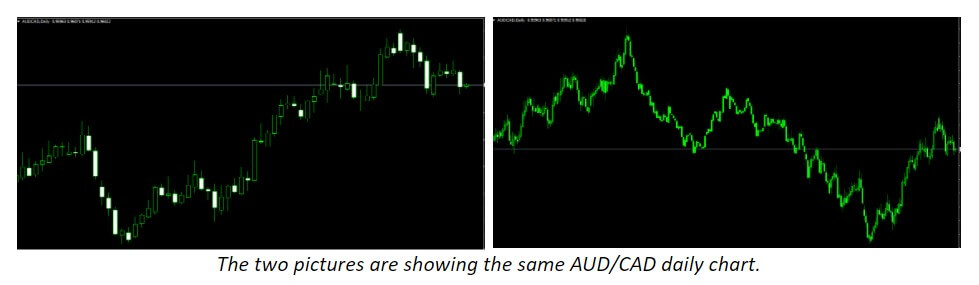
If you compare the two images below, you will see the two images of AUD/CAD daily charts taken at the same moment. Based on what we see below, depending on how you look at the chart, any trade you are in can be both a trend and a counter-trend trade. If you observe any YouTube trading videos, you may discover that despite the analysis indicating a downtrend, that particular trade can be perceived completely differently once zoomed out. Therefore, how we decide to look at our charts will inevitably affect the direction a currency pair takes.
Another important factor that traders may sometimes overlook is the involvement of big banks, whose impact on prices is what essentially pushes them up or down. While traders care about whether a pair is trending or not, big banks share no such affection. What they are interested in actually is where the majority of retail traders’ money is headed. By knowing where all the money is going, big banks can move the price in the opposite direction, which is why looking at where the prices were two years ago seems irrelevant.
Traders’ fears about trading properly, i.e. trading with the trend rather than against it, are therefore only a matter of perception. From the big banks’ perspective, and as a matter of fact, counter trading has no role in price movement. What is more, from the viewpoint of a trader, trend and counter-trend can turn out to be the very same thing, further reducing the value of this concept. Based on these facts, why should we then even concern ourselves with counter-trends and their impact?
Since trend traders’ only goal is to discover when a new trend or a continuation of an old trend is about to take place, their main task is to get involved on time and stay in the game for as long as possible. Other pieces of information, such as where a trend is, fall short in terms of importance as long as any such trend is happening. What traders should definitely work on is developing a system which can firstly recognize these trends and get them in a trade under the best possible circumstances.
Naturally, understanding the difference between trends and reversals will further help traders see what is of vital importance for growing a forex trading account. The question of how we can know whether we are not trading reversals any longer is key here as well. Unfortunately, the answer to this is that we will never know in advance. What we will be able to do is make reasonable conclusions with the wisdom of hindsight. If you are entering a trade, at which point will that happen? What every trader is hoping is that the entry happened as early as possible, but we cannot know exactly. Nonetheless, the algorithm you worked to develop, including the indicators you chose and tested, will carry out the task of neither getting us too early in a trade, which is considered as reversal territory.
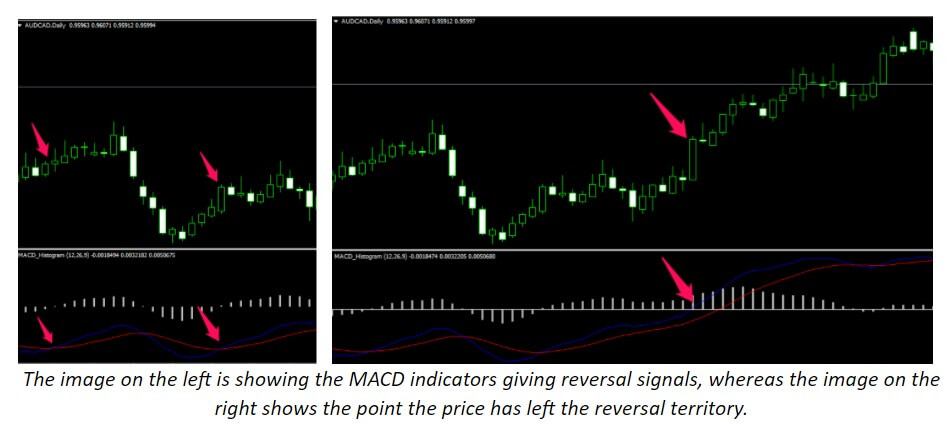
Moving Average Convergence/Divergence indicator (MACD), which is essentially a two-line indicator, gives out a classic reversal signal when both lines under the zero line cross upward. As reversal trading cannot possibly lead to prosperity long-term, you are better off ignoring signals such as this one. Moreover, if you wait just a little longer, you will be able to see the two lines cross the zero line which is precisely an indication that you have left the reversal territory. Therefore, although we do not have a precise definition of what a counter trade stands for, this example alone should serve as clear guidance on what traders should focus from now on.
Should we then enter a trade the moment we see that things are turning? The answer is no simply because we need to see whether it truly is a reversal or not. Only when an indicator tests whether a reversal was a false one and the price keeps moving in the same direction, will you receive the actual signal to go long or short. Therefore, we cannot truly know when a trend officially started until we reflect on what happened before, which is why we need indicators to show us the way.
As a conclusion, the question of whether you should focus on trends or counter-trends is not really important, unlike the distinction between trends and reversals. What you need to avoid difficulties of trading reversals is a good set of indicators that will get you in a trade right when a trend is happening, be it a continuation of an old trend or an entirely new one. You should, therefore, only worry about entering a trade at the best possible time and having a system that can provide that. All in all, whether you are following a trend completely or moving slightly against it, do not fear to put full risk on that trend as long as your system tells you to go forward.