Categories
Forex Basic Strategies

15 Minute Forex Scalping Strategy Using The Donchian Channel Indicator

Introduction

Scalping is a trading strategy designed to profit from small market changes. The Scalpers took a couple of trades in any trading session, and the goal of every scalper is to seize gains when they appear on a price chart because the aim is to have a few small wins rather than one large one. Scalping is one of the most challenging style of trading to master because it requires unbelievable discipline and focus.

A scalper must follow the rules of their trading strategy like a religion because one large loss can easily wipe out dozens of successful trades. One of the most critical aspects of scalping is liquidity because we would not scalp any instrument that is not liquid enough and ensuring liquidity also ensures that we are getting the best price while entering and exiting in a trade. In this article, we will show you how to scalp the 15-minute trading timeframe by using the Donchian Channels Indicator.

Working Of A Donchian Channel

Donchian channel consists of three lines, which are generated by the moving average calculations that comprise an indicator formed by the upper and the lower band, also the median band. The celebrity trader Richard Donchian developed the indicator in the mid-twentieth century so that he can identify the trend of the market. The area between the upper and lower band represents the Donchian channel. The indicator identifies the bullish and bearish extremes areas, which are followed by the reversals or breakouts in price action.

15-Min Trading Strategy

The scalping strategies are only created to trade the lower timeframes, such as 1, 3, 5, 15-minute timeframes; do not apply any of these strategies on any higher timeframes; otherwise, you will face some trouble in your trading.

As you can see in the below image of the USDJPY forex pair, overall, the instrument is in a strong uptrend, and when the price action hits the lower band of Donchian channel it indicates the buy trade, and when it hits the upper Donchian channel, it means to go for a short trade.

In the below image the price action gives us three buying and three selling trade, most of the time the buying trades perform bit longer than the selling trades, it is because the flow of the market was up, but for the scalpers, the flow doesn’t matter, all the scalpers want is to in and out from the market. Close your position when the price action hits the opposite channel, and when you take the entry, if the price action goes a bit against you { for, e.g., 4 to 5 }, then close your position immediately and wait for the new signal.

The below image represents a couple of buying and selling trades in a downtrend. The goal of every scalper is to, first of all, check the trend of the market, and expect more trades by following the trend and simply expect less counter-trend trades. You can see that the below image of the GBPNZD forex pair shows us the nine selling and six buying trades. Most of the selling and buying trades worked very well, and each trade generates a significant amount of money for us. The whole goal is to activate the position when the price action hits the Donchian channel and close your position when the price action goes a bit against us.

Range Trading

If you trade the trending market, then expect the more trend-following trades, and if you scalp the ranges and channels, then you can expect both the buying and selling trades because in ranges and channels both of the parties hold the equal powers this is the reason ranges and channels are favorite for the scalpers. The image below shows the 15-minute chart of the NZDJPY, forex pair, which shows the ranging market, and in range price action gives the five selling and four buying trades. In the ranging market, we suggest you go for the 1:1 RR trades because the price action more often spikes in ranges.

Scalping Trading By Following The Market Trend

Buy Trade

The scalping is all about having a strong and aggressive mind to face the rollercoaster ride in the market, and some of the conservative and confirmation traders want to scalp the market, but they little hesitate to react on every signal, so if you are a conservative or confirmation scalper then here is good news. We specially created a strategy that suits your trading personality. In this strategy, you will find fewer trades, but the trades will be accurate. Apply this strategy only on the fifteen-minute timeframe and avoid trading the ranges and channel markets because both situations have higher chances of fake outs. First of all, on a lower timeframe, find out the clear uptrend in any instrument, and when the price action hits the lower Donchian channel go long and hold your position till the price action hits the opposite channel. Do not go for selling trades in the buying market simply wait for the next buying trade. In the below image, by following the trend of the market, we only got the five buying trades in the EURAUD forex pair. Each of our trade travels a significant amount of time; then the price action generates the next trade. By following this strategy, you will face less mess and good trades in the market.

Sell Trade

The image below represents the six selling trades in the GBPUSD forex pair, you can see that the downtrend was quite smooth, and after activating our every trade, the price action immediately goes into our favor. In the strong trending market, you can go for the smaller stop loss and book profit when the price action gives the buying signal.

Conclusion

Scalping is not easy, but it is a quick way to make some money from the market. As a scalper does not expect a continuous win, most of the scalpers face the ups and downs in their trading journey. Every trading day awaits a couple of buy and sell trades, do not judge yourself or your strategy according to every single trade, instead of at the end of the day find out how many wins and losses you have. If the end of you have more wins than the losses, then it means you have a successful trading day. Scalping works very well on the lower timeframe and the strategies we show in this article created, especially for the 15-minute trading timeframe.

Categories
Forex Signals

EURUSD: Heading towards the South

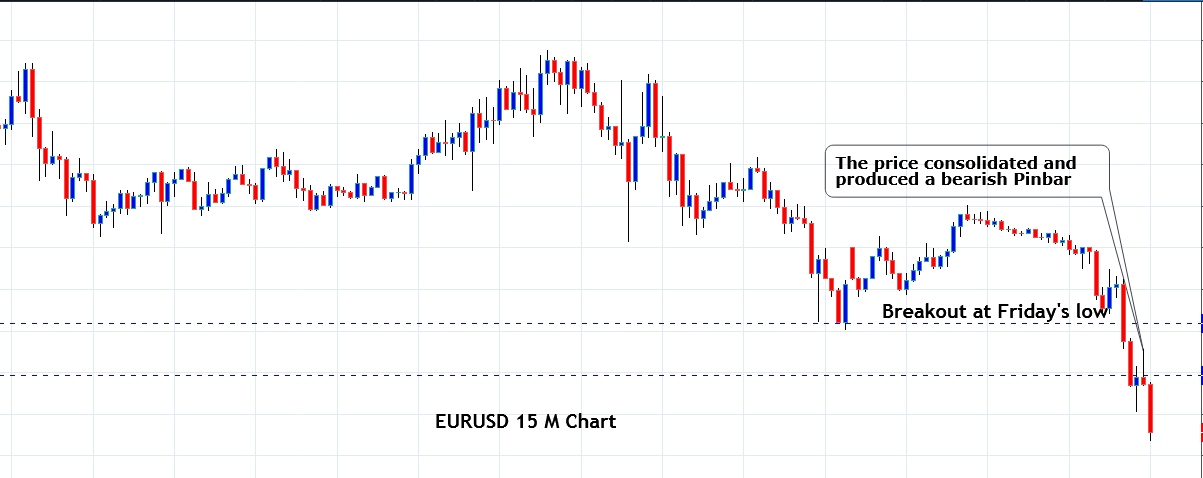
EURUSD produced a bearish candle on the daily chart Friday. The 15 M chart shows that the price made a bearish correction to start its trading day today. It found its resistance at 1.21380 and made a bearish move. It made a breakout at the level of 1.2110 by producing a good-looking bearish Marubozu candle. The pair produced one more bearish candle and then consolidated around the level of 1.21000. Upon producing a bearish Pin Bar, the price seems to get more bearish. It may head towards the level of 1.20700 with good bearish momentum. The price may consolidate or make a bullish correction around the level before finding its next direction as far as the 15M chart is concerned.

Trade Summary:

Entry: 1.21002

Stop Loss: 1.21002

Take Profit: 1.20802

The risk for the trade per standard lot is $100, Mini lot $10 and Micro lot $1. The risk-reward is 1:2. Thus, the reward for per standard lot is $200, Micro lot $ $20 and Mini lot $ 2.

Categories
Forex Basic Strategies

We Have Simplified The ‘Dolphin Trading Strategy’ For You!

Introduction

One of the most annoying things for a trader is getting stopped out of a ‘long’ trade on the lowest possible tick, after which the prices reverse and move higher. Likewise, nothing can get more annoying than getting out of a ‘short’ trade on the highest possible tick of the move, after which prices reverse and ultimately move in our direction for profit.

All of us would have experienced this unpleasant reality more than once. We have designed a strategy specifically to take advantage of these spike moves in currencies by carefully getting into a trade by anticipating a reversal.

Traders who like to bank on consistent and small profits might feel this strategy appealing despite experiencing frequent stop-outs. Before going through the strategy and the trade setup, we must understand that while it misses infrequently, but when it misses, the losses can be very large.

Therefore, it is absolutely crucial to honor the stop-loss in these setups because when it fails, it can mutate into a relentless runaway move than could blow up our entire account if we continue to hold on to our trades.

Time Frame

This strategy works well on all time frames above the 1 hour. This strategy cannot be used for scalping as the risk is higher.

Indicators

In this strategy, we will not be using any indicators as it is based on pre-determined rules and price action.

Currency Pairs

This strategy applies to almost all the currencies listed on the broker’s platform. However, illiquid pair should be completely avoided.

Strategy Concept   

The trade setup that is formed using this strategy lies on the assumption that support and resistance points of tops and bottoms exert an influence on price action after they are breached. They act like a magnetic field attracting prices back to these points after a majority of the stops have been triggered. The thesis behind this strategy is that it takes an enormous amount of power to breakout or breakdown from tops or bottoms that are created after an extended move.

In the case of a top, for example, making a new ‘high’ requires not only huge capital and power but also enough momentum to fuel the rally further. By the time it makes a ‘new’ high, much of the momentum has passed, and it is unlikely that we will see a new ‘high.’ Dolphins have a very strong memory, and since this strategy is based on the memory of the price, we have named this strategy as ‘The Dolphin Strategy.’

 Trade Setup

In order to explain the strategy, we have considered the EUR/USD pair, where we will be applying the strategy on the 1-hour time frame. Here is the step-by-step approach to executing the strategy effectively.
Step 1

First, we need to identify a sequence of ‘higher highs’ and ‘higher lows’ on the chart when looking for a ‘short’ trade setup. Similarly, we need to identify a sequence of ‘lower lows’ and ‘lower highs’ when looking for a ‘long’ trade. Then we are required to mark the highest point (‘short’ setup) or the lowest point on the chart (‘long’ setup).

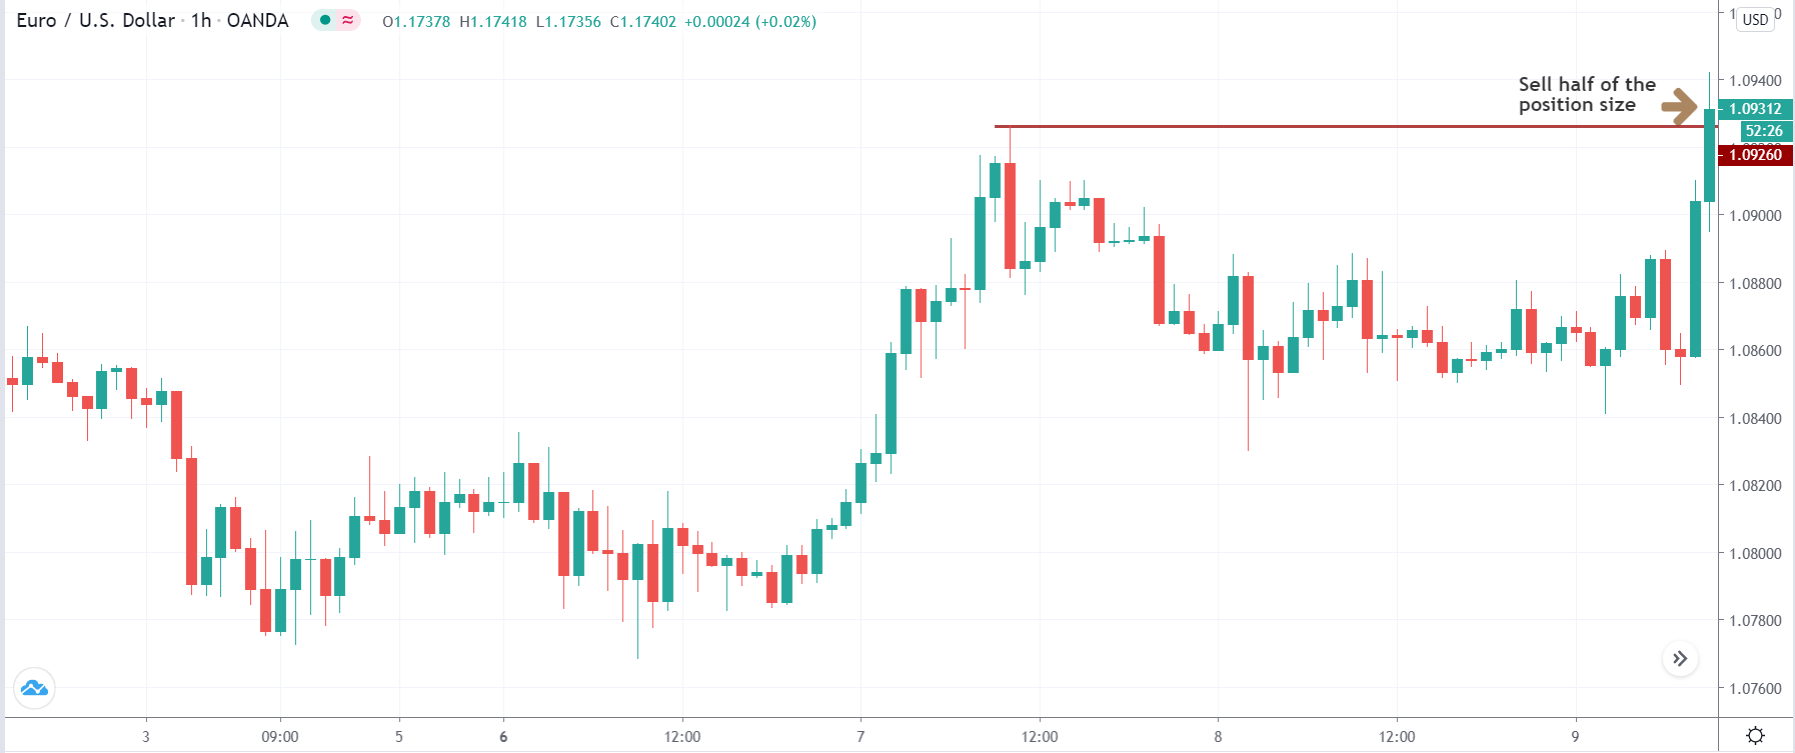
In our case, as will be executing a ‘short’ trade, we have identified a swing ‘high’ on the chart shown in the below image.

Step 2

Assuming that we have calculated our position size, we will ‘sell’ half of our position size at the ‘high,’ which was identified in the previous step. In a ‘long’ setup, we will ‘buy’ half of our position size at the ‘low’ identified previously. If the market is strongly trending upwards or downwards, we have to take a position of size lesser than ‘half.’

We are taking half of our ‘short’ positions at the previous ‘high’ once the market starts moving upwards after a retracement.

Step 3

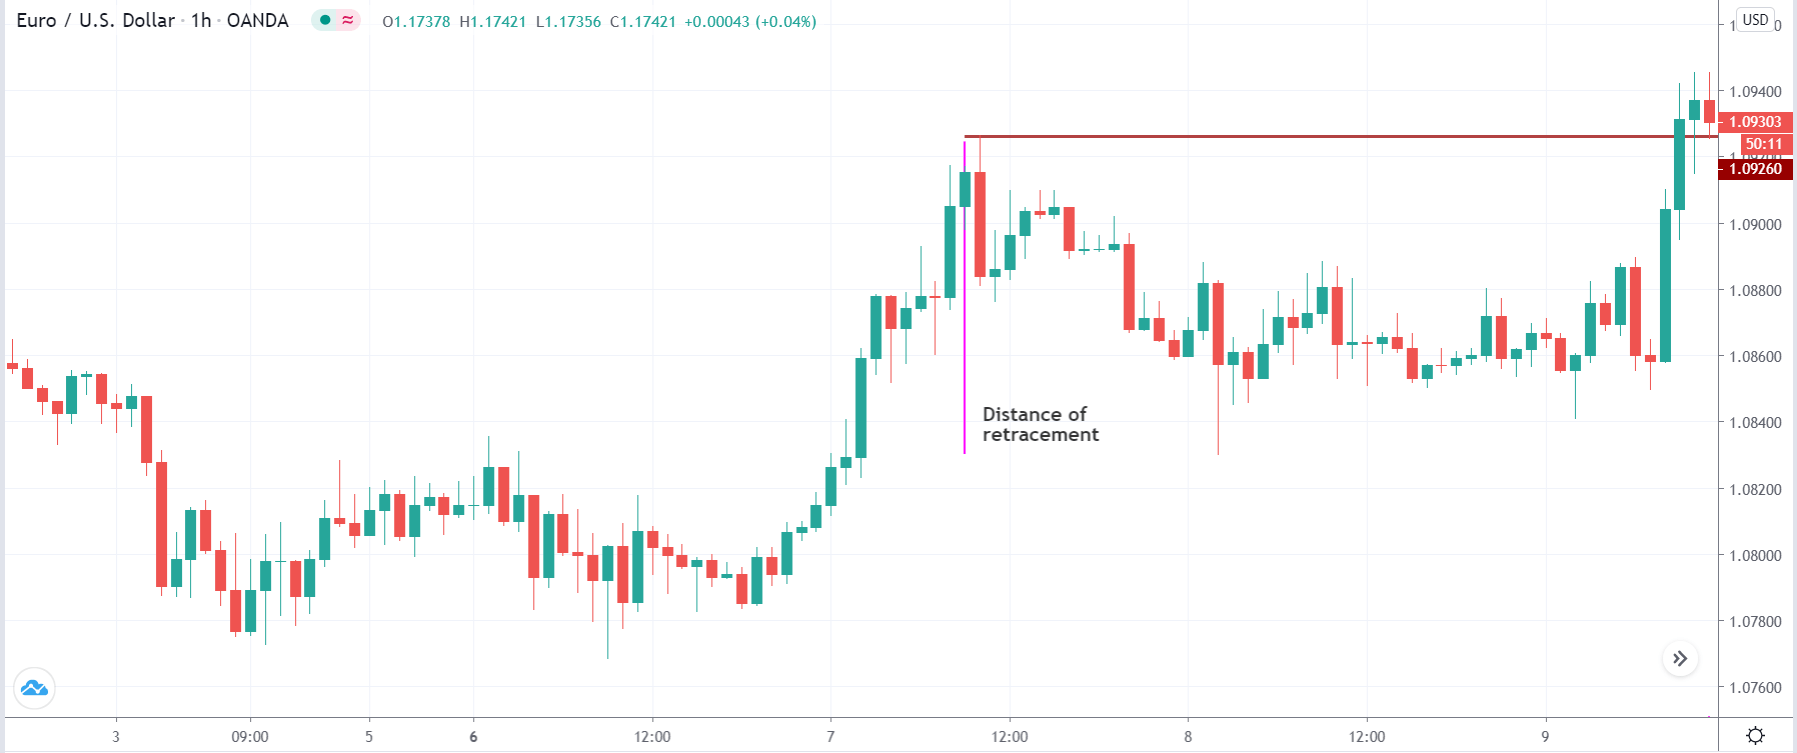
In this step, we have to measure the distance of the ‘retracement’ or ‘pullback,’ which takes place after the price makes the ‘high’ or ‘low’ that was identified in the first step. Measuring this distance with the help of a measuring tool is crucial as further steps of the strategy are based on this distance.

The below image shows the distance of the ‘pullback’, measured with the help of a vertical pink line.

Step 4

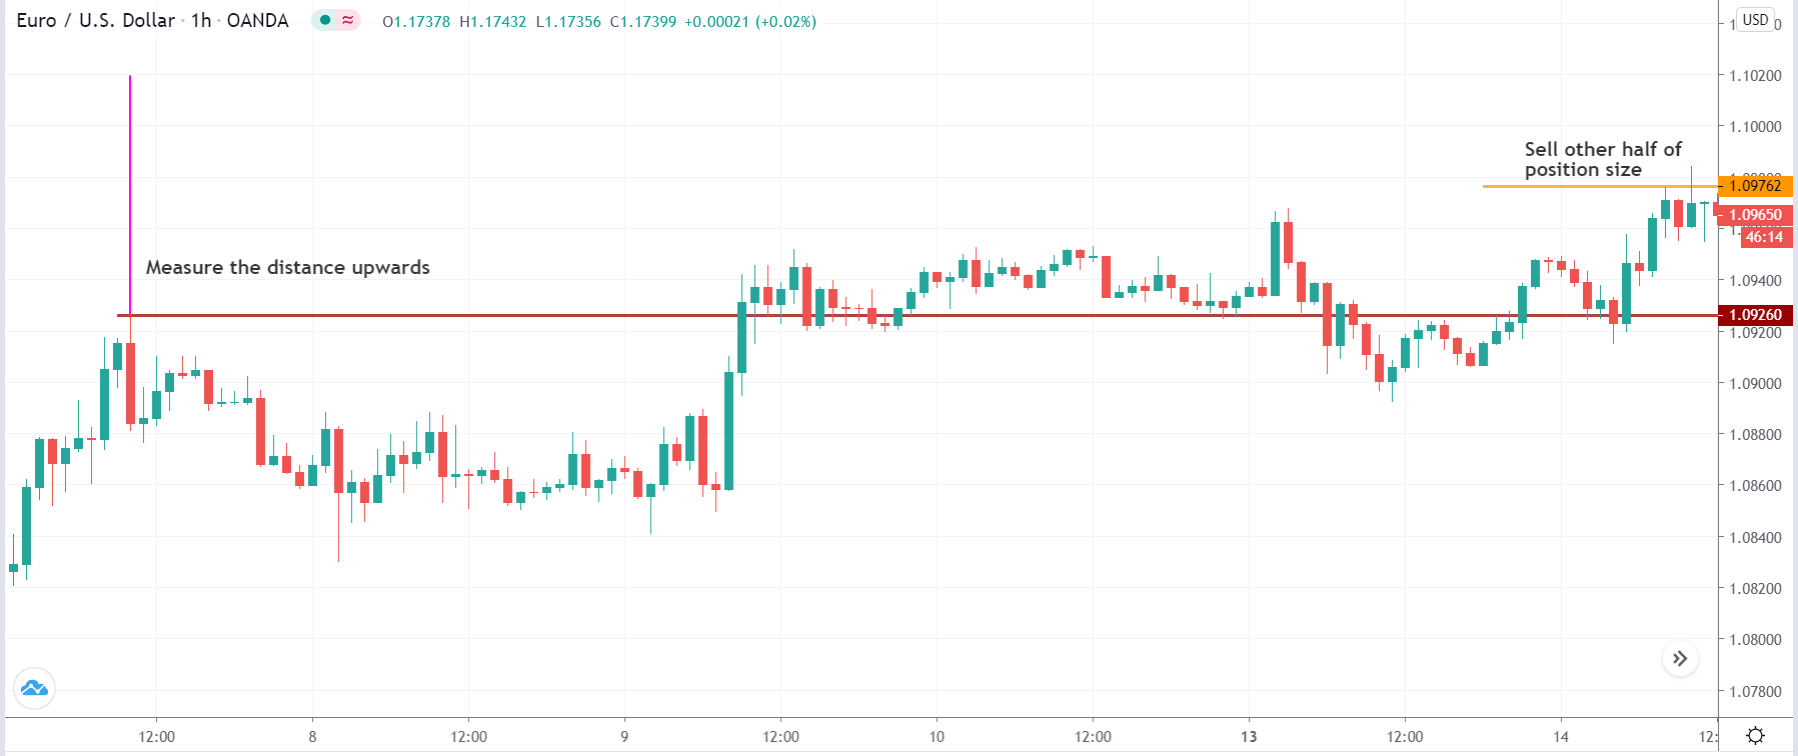
In this step, we need to measure the exact same distance that was measured in the previous step above the ‘high’ in an up move or below the ‘low’ in a down move. In a ‘short’ setup, when the price starts moving above the ‘high,’ we will execute the remaining half of the positions at the half-way mark of this distance. Likewise, in a ‘long’ setup, we will execute the remaining half of our positions at the half-way mark of this distance, when the price starts moving lower.

The below image shows the point on the chart where we have executed the remaining positions.

Step 5

Now that we have entered the market with full position size, we have to set an appropriate stop-loss and take-profit for the trade. The ‘stop-loss’ is placed at the price corresponding to the distance of the ‘pullback’ that was measured in ‘Step-3.’ We take profits at two places in this strategy.

The first ‘take-profit’ is at support turned resistance or resistance turned support line. And the second ‘take-profit’ is at the ‘higher low’ from where the market goes back to the ‘high’ identified in the first step. In a ‘long’ trade, it will be at the ‘lower high’ from where the market goes back to the ‘low’ identified in the first step.

Strategy Roundup

One of the concerns for some traders might have with the ‘Dolphin Strategy’ is its asymmetrical structure and complex rules. Readers with good maths skills and trading experience notice the best of the trade setups using this strategy and harvest high risk-to-reward ratios. Traders need to be very strict with their stop-loss as the market might move in one direction only. However, the strategy works in our favor as it is a high probability setup.

Categories
Forex Basic Strategies

How To Trade The ‘Higher High Failure’ Countertrend Strategy?

Introduction

There are millions of strategies out there in the market. Some work exceptionally well, while some fail miserably. Trading successfully is not about knowing several strategies, but about one strategy that works consistently. All professional traders are never in the hunt for trying out different strategies. They have expertise in a single strategy and know when to apply it and when not to.

Here, in this article, we shall be walking you through a simple yet extremely strategy that both day and positional traders can apply. Besides, we will enlighten you on the dos and don’ts of the strategy.

Understanding a Trend

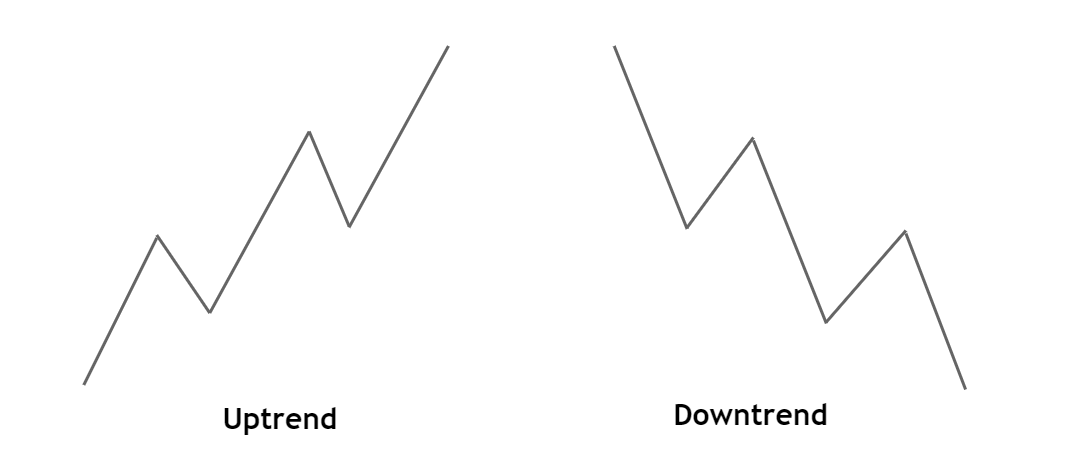
The most evident state of the market is a trend. It is indeed the best state to trade as one can easily bet on the market’s direction. In technical terms, the trend is the state of the market, where the price makes higher-highs/higher-lows or lower-lows/lower-highs.

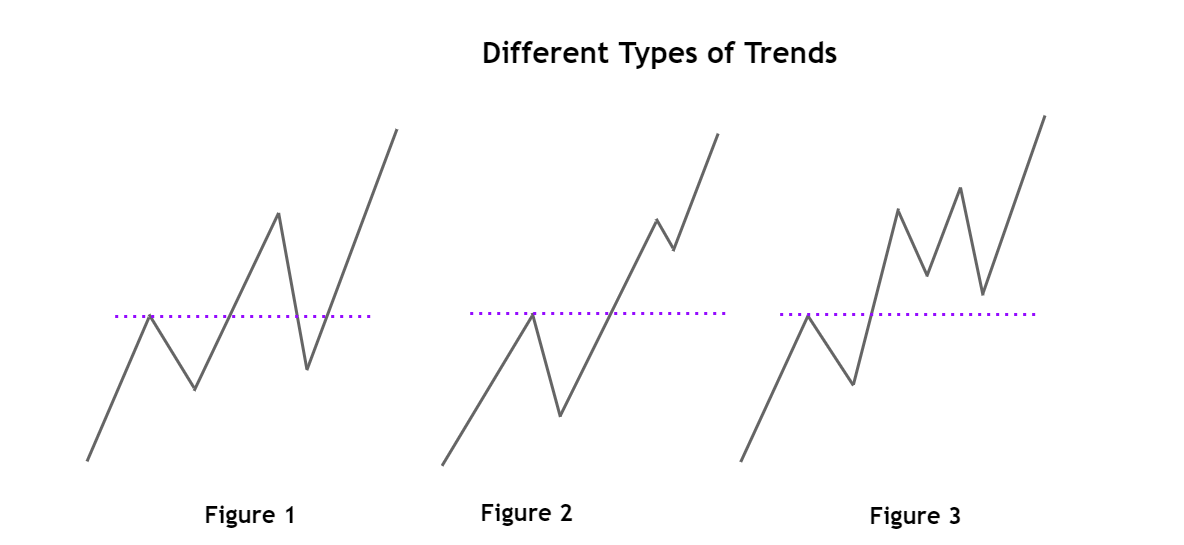
A trend alone can be of different types – based on the pattern. The above image of a trend is how an ideal trend looks like. However, the number of occurrences of this type of trend is very less. Apart from the ideal trending market, we can have other types of the same state.

Figure 1: In this type, the market breaks about the Support and Resistance (purple line), retraces through the line, and then makes another higher high.

Figure 2: Here, the market makes a HH by breaking about the S&R (purple line), pulls back insignificantly, away from the S&R, and makes a higher high.

Figure 3: The market made HH passing through the S&R, retraced a little, tried to make a higher high, and failed. Later, it retraced more than the previous time, and then successfully made a HH.

What is the ‘Higher High Failure’ Countertrend Strategy?

The “Higher High Failure” countertrend strategy is based on the third figure of the above image. It is named countertrend because the overall trend of the market is up, but the strategy is to take a short position.

According to the strategy, in an uptrend, if the market fails to make a higher high on the very first attempt, then one can prepare to go short on the security.

Logic

In a sequence of higher highs and higher lows, if the market fails to break above the recent HH, it is an indication that the trend is preparing for another push down before heading up. The failure also indicates that the buyers are not strong enough to push the market higher with one retracement. Since the buyers are slowing down, one can swing down from the seller before the market resumes its trend. Note that the length of this south wing depends on the strength difference of the buyers are sellers.

Trading the Higher High Failure Strategy

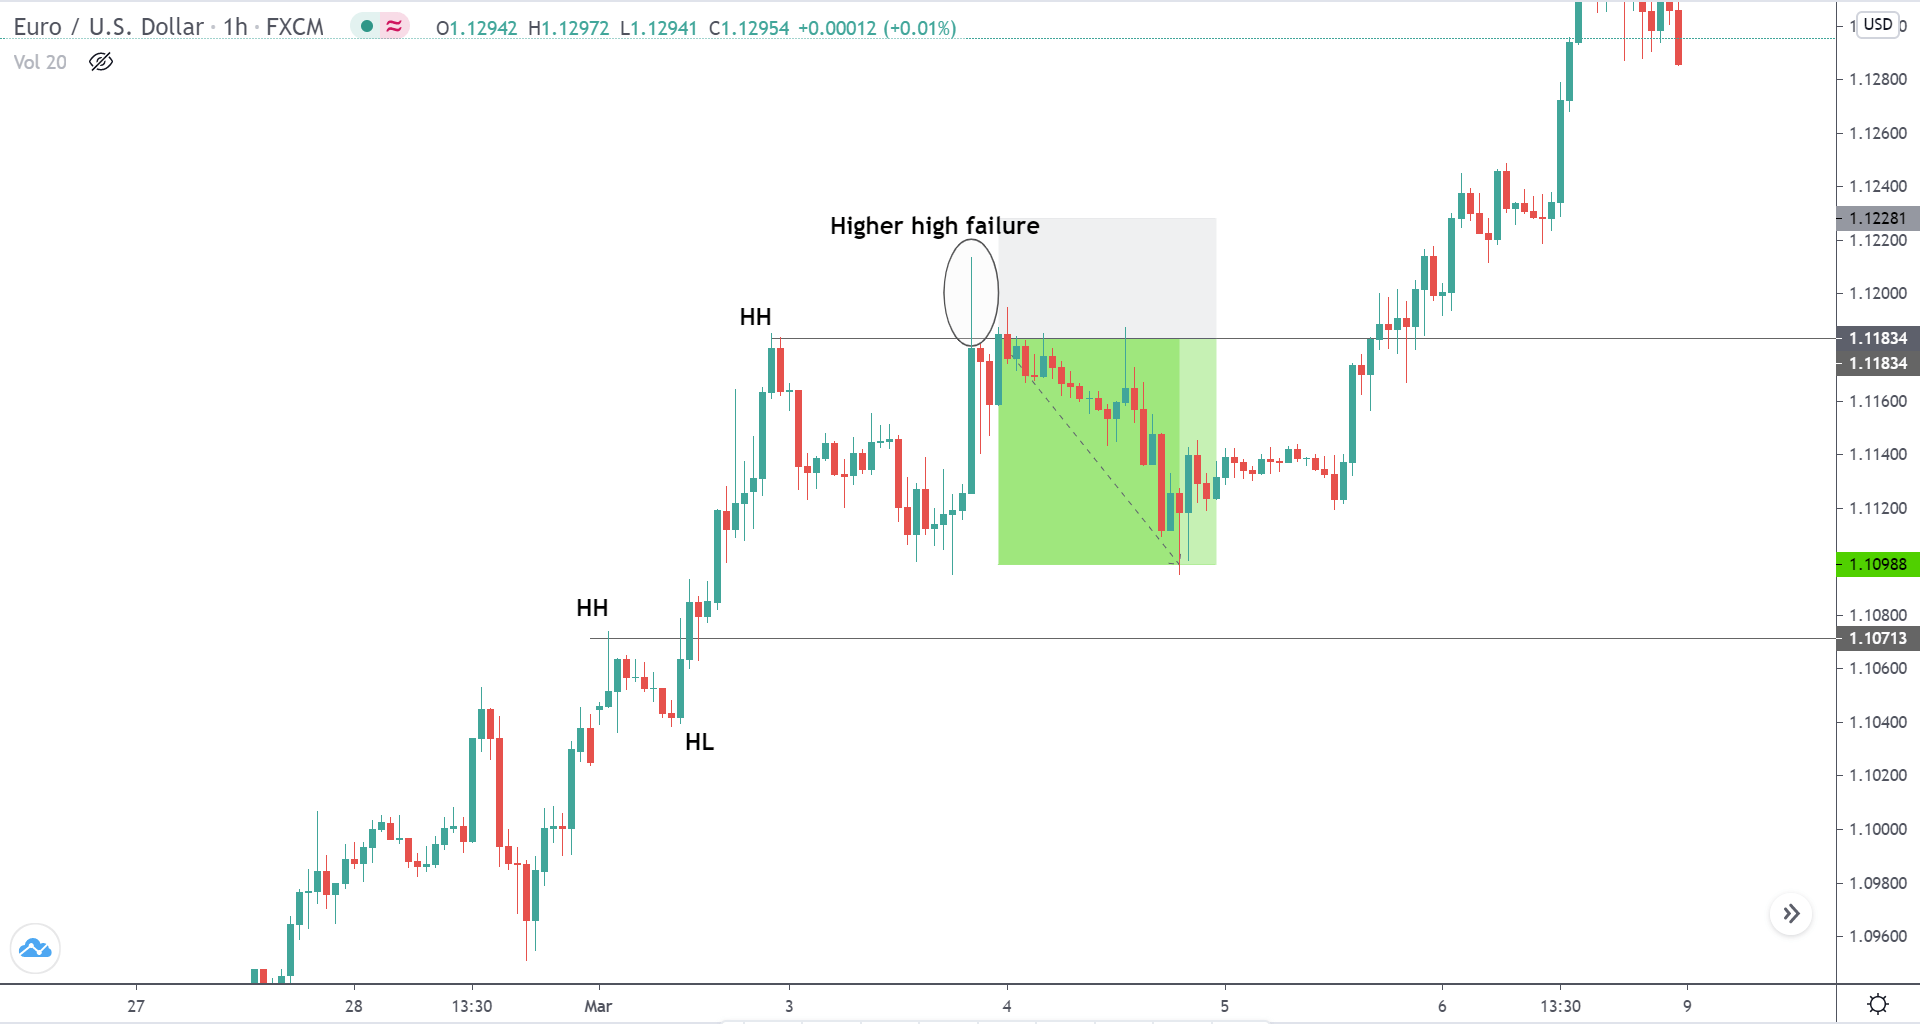
Consider the below chart of Euro / US Dollar on the 1H time frame. We can see that the market is in an uptrend making higher highs and higher lows.

The most recent higher high made by the market was 1.11834. The market then retraced to 1.1098, tried to make a new high from the previous one, but failed by leaving a wick on the top.

The failure to make a higher high indicates that the buyers are losing momentum, and as a result, the sellers could temporarily take over the market. In addition, the wick on the top at the resistance area signifies the strength of the sellers. Thus, right after the price shoots down at holds below the S&R (grey ray), one can go short on the pair.

Take Profit Placement

Since the buyers shot up from 1.10988 the previous, we can expect a reaction from the same level. Hence, 1.10988 would be the safest level to place the take profit level. If the sellers are strong in momentum, one can ride down until the S&R.

Stop Loss Placement

Stop-loss few pips above the wick can keep you away from getting stopped out. But it is risky to keep the stop loss right above the resistance level.

On the flip side, this strategy will work like a charm on a downtrend as well. For a downtrend, the strategy could be termed as a “Lower Low Failure” countertrend strategy. Let’s take an example of the same and understand how to trade a down-trending market.

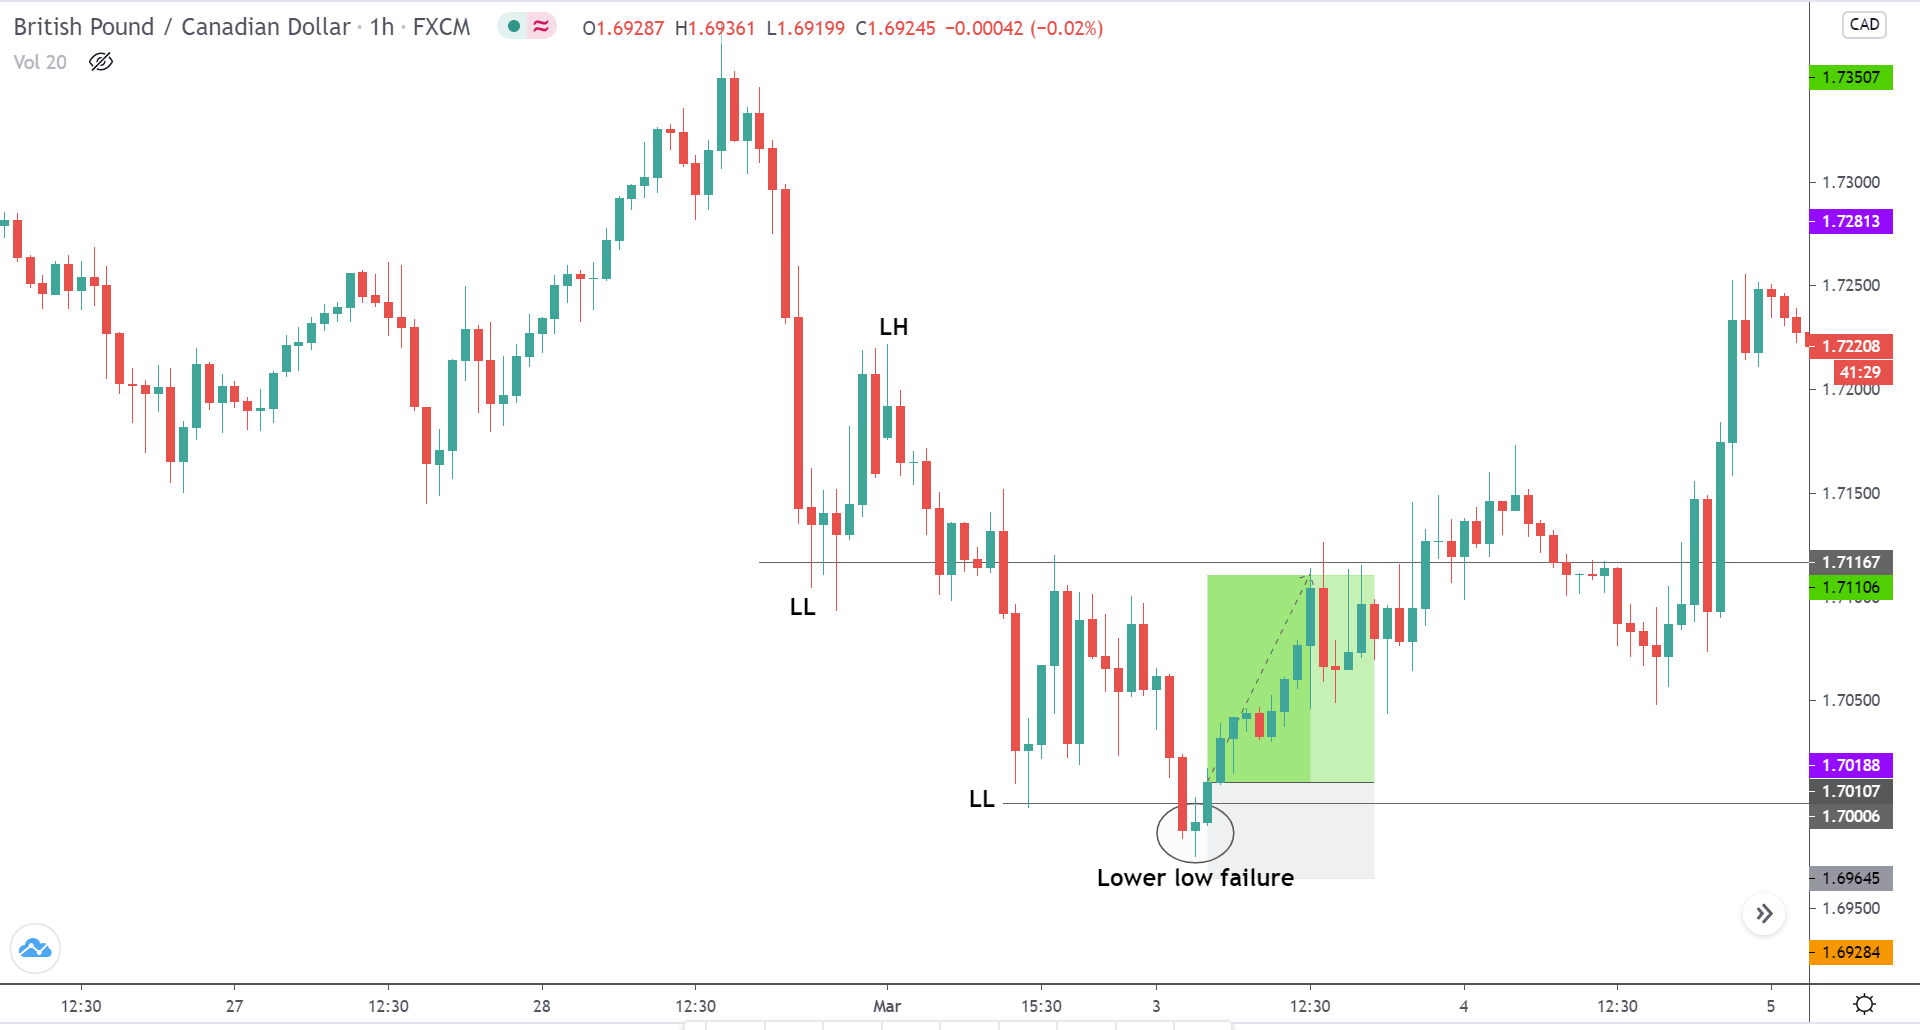
In the below chart of GBP/CAD, we can see that the market is in a downtrend, making lower lows and lower highs. Level 1.70006 was the most recent LL. The market retraced to the S&R and tried to make a new LL but failed. During the failure to make a LL, a spinning top candle appeared, which was then followed by a bullish candle to close above the LL level. This confirms that the sellers are have temporarily faded out, and the buyers are going take over the market.

Take Profit Placement

Take profit can be placed at the price where the market tried to make a lower low previously. In this example, the TP would be at the S&R.

Stop Loss Placement

The safest stop loss for this strategy would be right below the price where it failed to make a LL.

Important Points to Note

  • The price should attempt to make a higher high and fail. The strategy cannot be considered for an equal high.
  • After the failure to make HH, the price should hold below the S&R level.
  • The strategy will not work if the price makes HH, holds, and then drops below the S&R.
  • Since it is countertrend trade, make sure to take profits at every hurdle.
  • The stop loss must be above the high of the higher high failure, NOT right at the resistance.

We hope you found the strategy interesting and useful. Do test it out in the live market and let us know the results in the comment section below. Cheers!

Categories
Forex Basic Strategies

Learning To Trade The 123 Pattern Reversal Trading Strategy

Introduction

Strategies that we discussed in the previous set of articles were based on indicators and price action patterns. We are going into the trading strategies, where we will combine popular candlestick patterns and price action. The next two articles will discuss the 123 patterns as a reversal trading strategy and continuation trading strategy. First, we will look at the 123 pattern as an indicator of the end of a trend and also a market reversal. Hence, it is also known as the 123 top and bottom pattern.

The 123 top and bottom is a very powerful pattern that signals a reversal of a trend. It is also used as a trend continuation pattern, which we will be discussing in detail shortly. First, let us discuss the 123 patterns as a reversal trading strategy.

Time Frame

A fascinating feature of this strategy is that it applies to all time frames starting from 15 minutes to ‘daily.’ Before trying this strategy on extremely small time frames such as the 5 minutes or 1 minute, a lot of experience is required.

Indicators

As mentioned earlier, in this strategy, we will not be using any technical indicators. The only prerequisite of the strategy is to have a clear understanding of the 123 patterns before reading about the strategy.

Currency Pairs

The strategy is suitable for trading in all currency pairs. However, it is suggested to look for the trading opportunities in major and few minor currency pairs only as the patterns are more reliable and evident in these pairs.

Strategy Concept

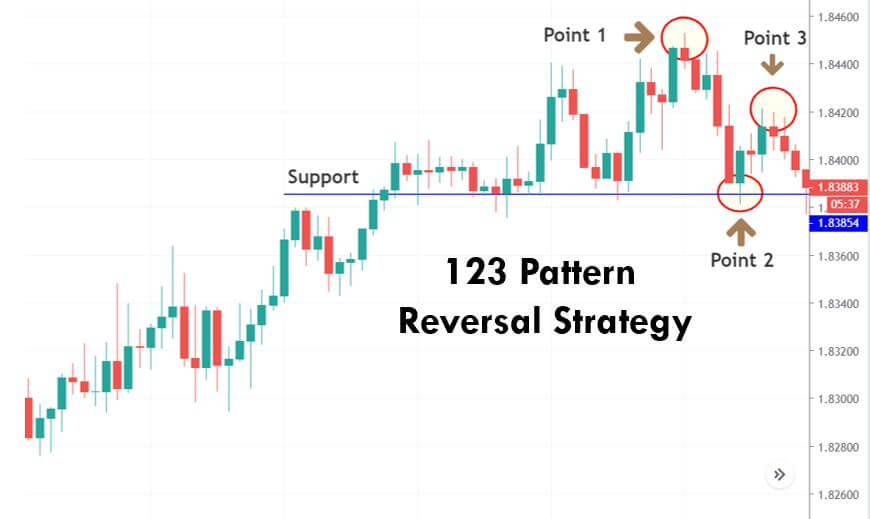
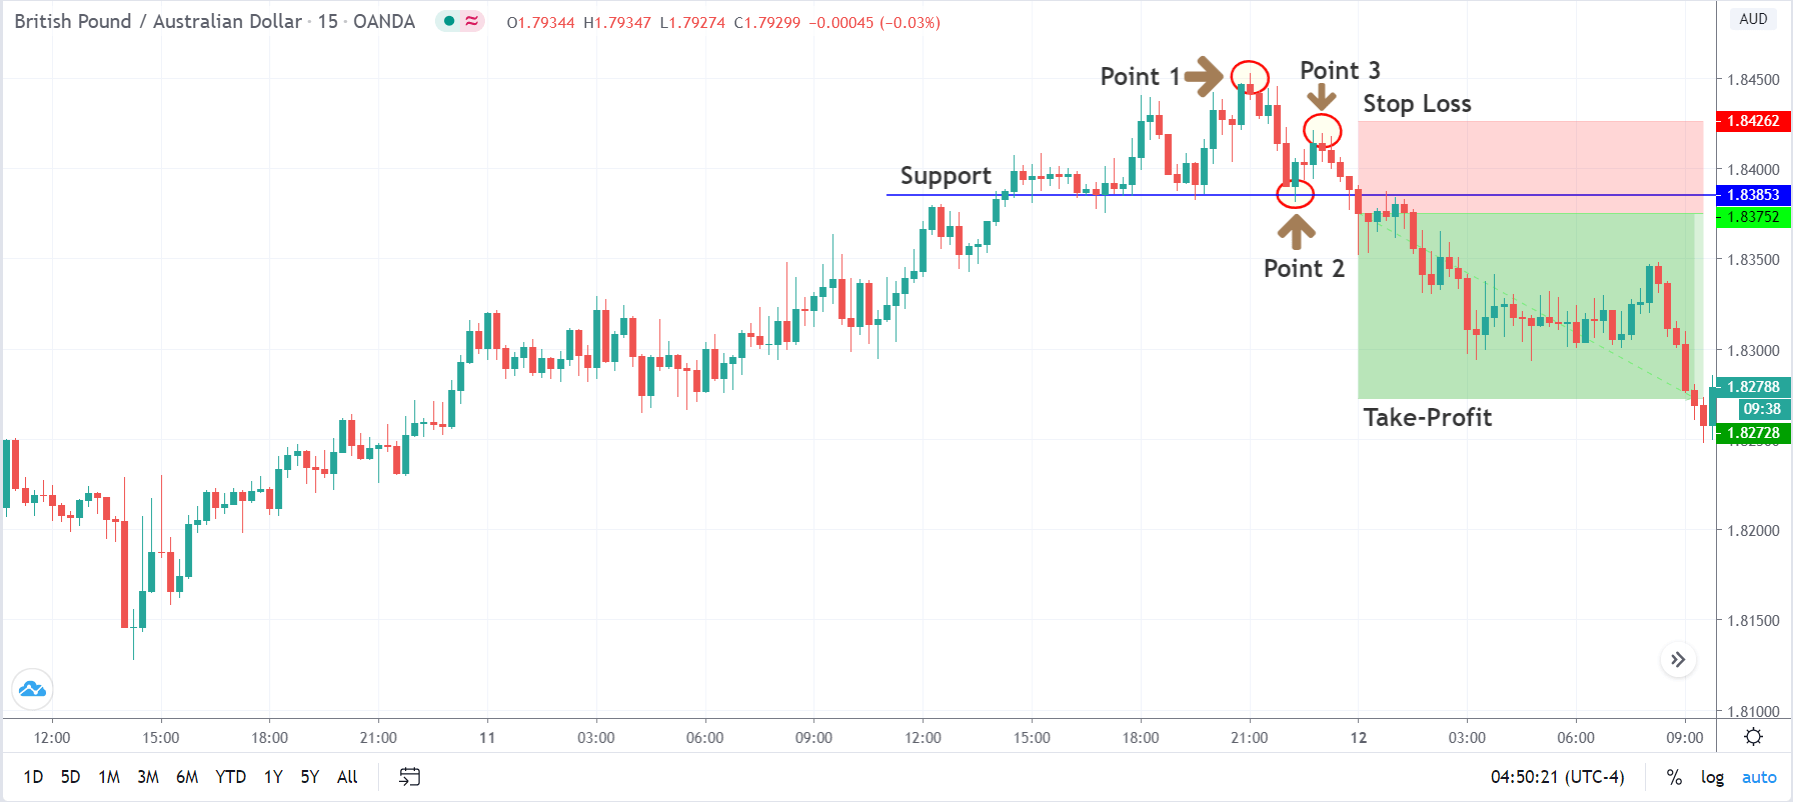
The strategy begins by identifying three main points. For example, in an uptrend, when the market hits a new high, label that point as 1. We then wait for the price to pull back to a short-term support area. This point is labeled as 2. Finally, when the price moves up to an area between points 2 and 3, we label this as point number 3. We then take an entry at a suitable location, which we will address in the later part of the strategy.

The pattern is complete when the price stays below point 2. The strategy is to sell the currency pair on the break of point 2. The take-profit of the strategy is placed at a point that results in a 1:2 risk-to-reward ratio. The stop loss is put just above point 3, whereas a more conservative stop loss is placed just above the move, in order to maximize the risk to reward. The trader will be able to make this choice by trading the pattern again and again. Let us understand the step by step process of the strategy.

Trade Setup

In order to illustrate the strategy, we have considered the GBP/AUD currency pair, where we will look for ‘short’ trades by identifying the 123 top patterns. In this example, we are applying our strategy on the 15 minutes time frame and during one of the major trading sessions.

Step 1

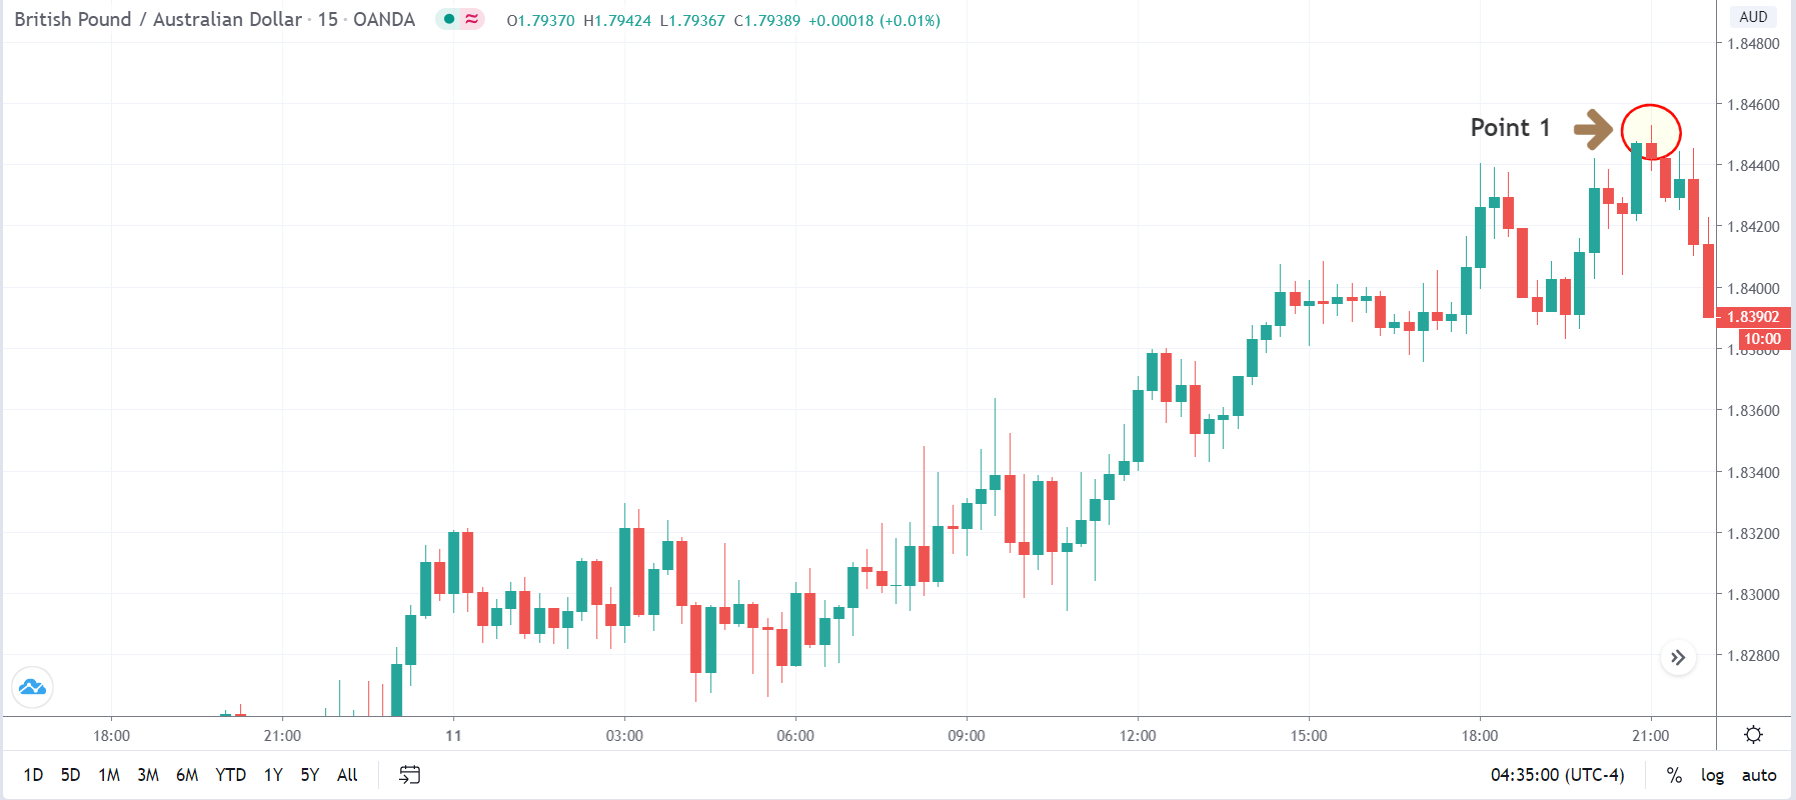
The first step of the strategy is to look for point 1, which is essentially the highest point of a trend. The criteria for selection of point 1 is that the market should reach it’s previous low or high twice before it starts moving lower or higher.

In our example, we can see that the previous lows have been tested multiple times, and thus we have chosen the highest point as our point number 1.

Step 2

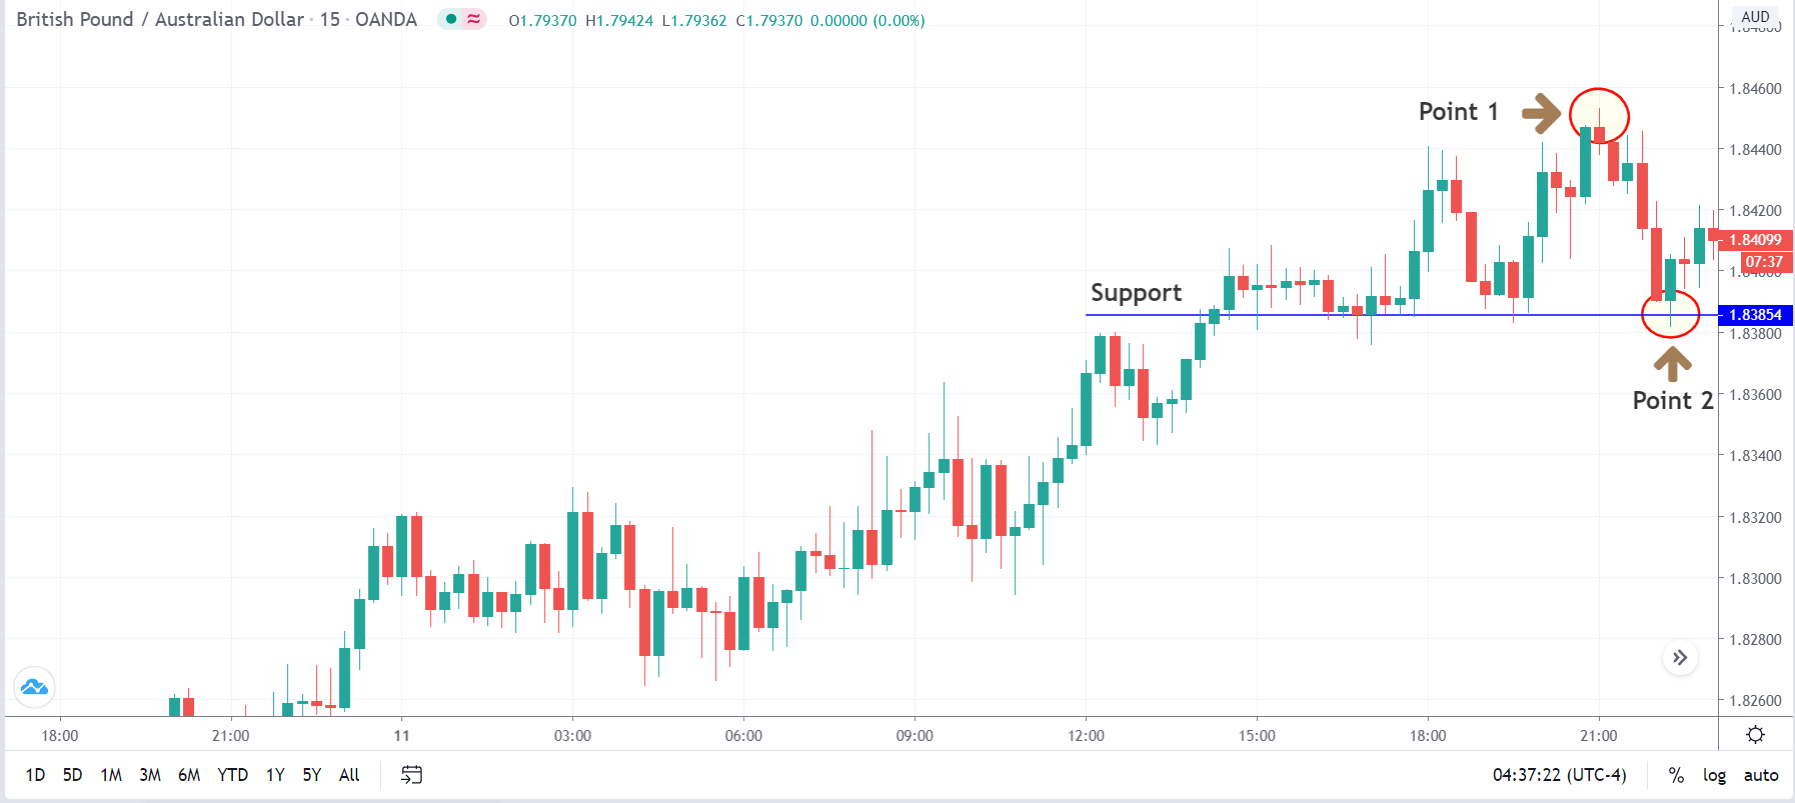
The next step is to mark the point number 2. When the market pulls back to the recent support or resistance area after reacting from point 1, we mark this as point 2. Remember that the price should not only reach that area but also react and move higher (for uptrend) or lower (for downtrend). This confirms the key technical level.

Step 3

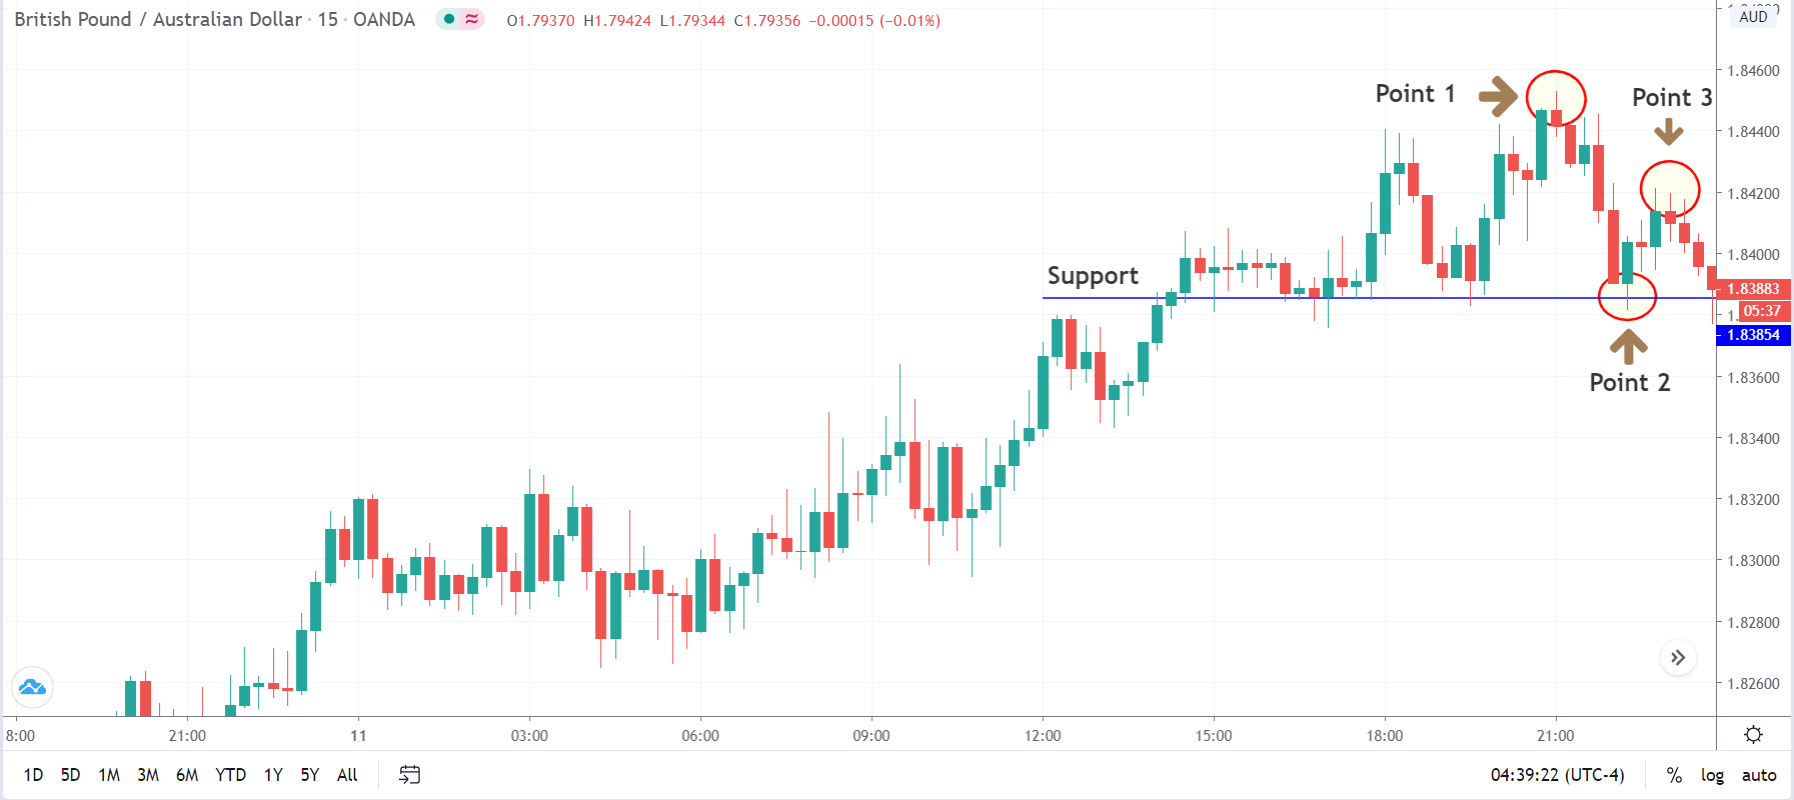
The formation of the 123 pattern is complete after identifying the third point. When the market moves in the area between points 1 and 2 and later comes goes back to point 1, the point from where the market reversed becomes our point 3. Now the next step of the strategy is discovering the ‘entry.’

Step 4

In this step, we will be discussing the ‘entry.’ There are two ways of entering the market in this strategy. The first one is an aggressive way to take an entry on a break of point 2, and as the market starts moving in that direction. Traders who are confident about the pattern and have belief in the market can opt for such an ‘entry.’ The second one is a conservative approach where one takes an ‘entry’ at the test of the previous support or resistance. This gives additional confirmation that the market is ready to go in a favorable direction.

In this case, we have entered the market right after point 2 is broken, which is a little aggressive.

Step 5

Finally, we need to determine our stop-loss and take-profit levels for the strategy. The stop loss is placed a little higher than point 3, or if one wants to maximize their risk to reward ratio, he/she can place it at a 50% mark between point 2 and point 3. The take-profit is placed at a point where the resultant risk to reward is at least 1:2. However, if there is a hurdle in between, profits can also be taken at such points.

Strategy Roundup

The 123 pattern is a major trend reversal pattern is one of the best strategies for trend reversals. One can trade using this strategy on any time frame. The strategy is based on the idea that the market is losing momentum in the direction of the major trend and could reverse any moment. The probability of this strategy is high and does not require knowledge of technical indicators.

Categories
Forex Basic Strategies

Forex Trading Strategy – Trading The 123 Continuation Pattern

Introduction

In the previous article, we discussed the 123 patterns as a confirmation sign for the end of a trend. However, while the 123 top and bottom are a great entry method for taking reversal trades, it is observed that most of the time market moves in a trend that requires us to get into the trend in the middle of it. We have heard that ‘the trend is your friend,’ so now we will learn a method to get into a trend using the 123 trend continuation pattern.

The safest trades are the ones that we take in the direction of the major trend. In simple words, if the trend is up, we should be ‘long’ in the market, and if the trend is down, we should be ‘short.’ In fact, it is advised for new traders to always be with the trend and not go for trend reversal trades.

Sometimes, one might miss out on the start of a new trend, for which we need a method to enter the confirmed trend during its progress. In today’s strategy, we will discuss one such method of entering a trending market using the 123 patterns for trend continuation, also called internal 123.

Time Frame

An interesting feature of this strategy is that it can be used on all time frames. One needs to comprehend the strategy very well before trying out this on extremely small time frames, such as 5 minutes or 1 minute.

Indicators

No indicators shall be used in this strategy. However, the Simple Moving Average (SMA) can be used to identify the major market trend.

Currency Pairs

Since the strategy is based on the same 123 reversal pattern that we discussed earlier, the strategy’s parameters will remain the same here as well. Hence, the strategy is suitable for trading in all currency pairs, including major, minor, and few exotic pairs. However, it is advised to trade in the major and minor currency pairs only.

Strategy Concept

The strategy’s basic concept is the continuous identification of 123 points in the direction of the new trend. The initial 123 points are identified in the same way as was identified in the previous section, and subsequently, the same pattern is identified as the trend advances. In this strategy, we will be attempting to catch the trend at the second or third appearance of the pattern. Since we are joining the trend after the move has started and it is in the middle, we cannot expect a large risk to reward ratio. This means the risk to reward of trades using this strategy varies anywhere between 1 to 1.5.

One should be careful while using this strategy for trend trading since most traders end up taking late entries that result in a loss. The strategy cannot be applied when the trend is very much evident on the chart and has reached the end of it. The trader can gauge this through experience and practice. Let us understand the step by step procedure of the strategy with the help of an example.

Trade Setup

In order to explain the strategy, we have considered the GBP/CAD currency pair where will be analyzing the chart on the 4-hour time frame. In this example, we will be looking for ‘short’ trades by identifying a suitable 123 pattern in the currency pair, with the downtrend being our major trend.
Step 1

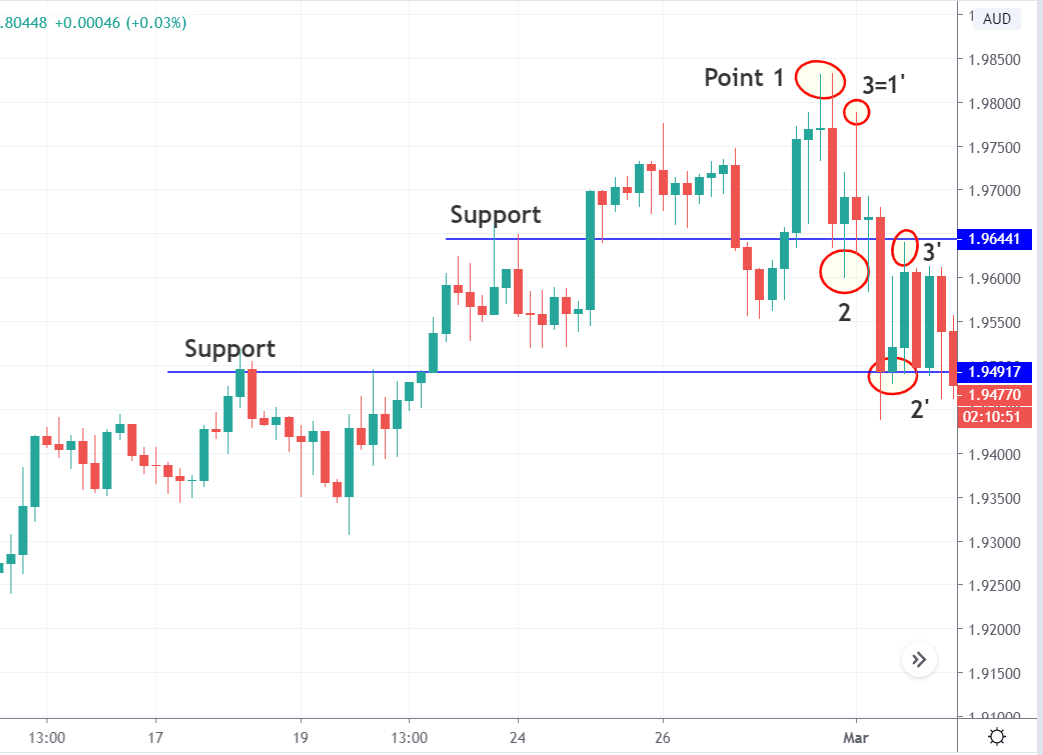
The first step of this strategy is only a recap of the previous strategy. It involves identifying the reversal of a trend by marking the 3 points and confirming the reversal of the trend. As we can see in the below image, we have marked all the points on the chart and identified the formation of the 123 patterns at the end of an uptrend.

Step 2

This is the crucial step of the strategy, where we only need to repeat the steps that were followed earlier to plot points 1, 2, and 3. The previous lower high or higher low becomes our point 1, the new support or resistance level from where the market reacts becomes 2nd point, and finally, the price that is between new point 2 and 3 from where the market starts moving in the direction of the new trend is the 3rd point.

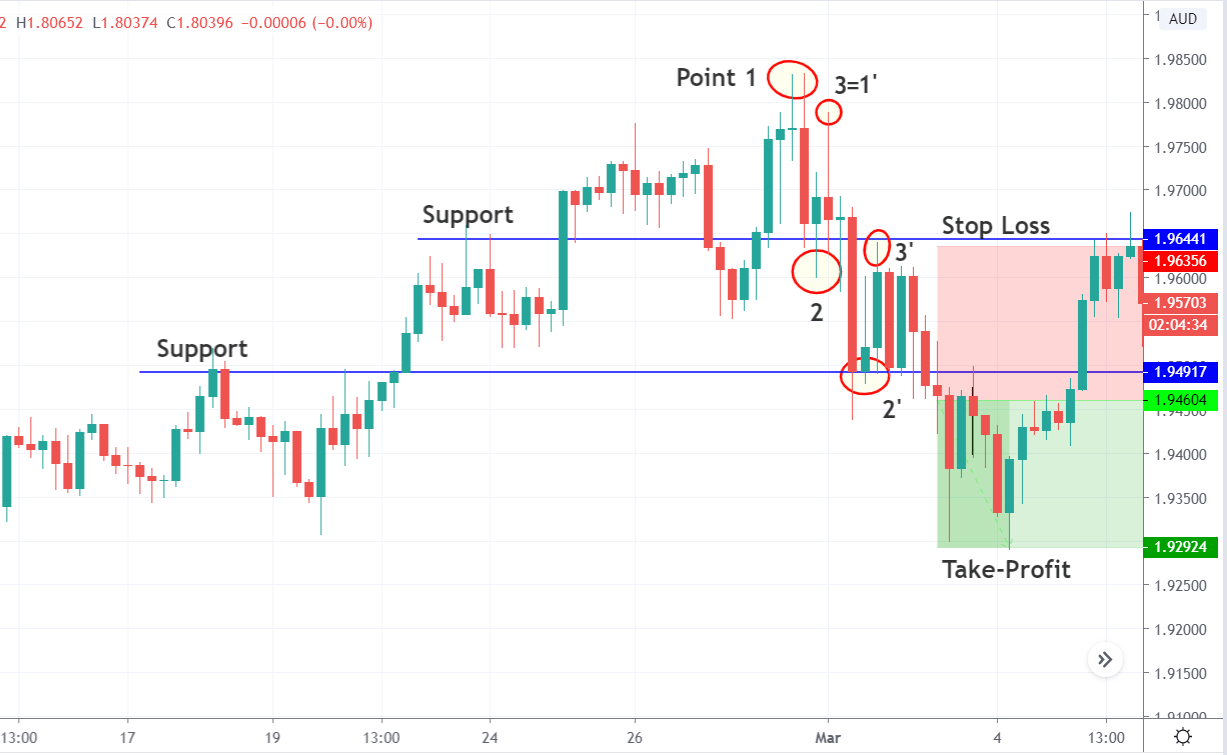
If we carefully observe, point 3 of the previous step is our new point 1, labeled as 1′ in the below image. The new point 2 is labeled as 2′, and 3′ is our 3rd new point. In the example, we will be entering for a ‘short’ somewhere in the middle of the downtrend and not too late or too early.
Step 3

In this step, we enter the market with appropriate position size and risk evaluation. The entry is the simplest part of the strategy, where we enter the market right at the break of the support or resistance level. This level is nothing but our 2nd point.

Step 4

In this, we determine our take-profit and stop-loss levels for the strategy. As mentioned in the earlier section of the article, the risk to reward ratio will be lower as we are entering the middle of a trend. The stop loss is placed at the 3rd (3′) point, and the take-profit should be at the recent support or demand area that is a hurdle for the down move.

Strategy Roundup

This strategy is only an extension of the previous strategy, where we apply the same rules and steps once again. The difference is that the risk to reward ratio is lower, but we make sure that we are trading with the trend, which puts us in a safer position. Do not apply the strategy again on the same trend.

Categories
Forex Course

139. How Professionals Trade The Different Market States?

Introduction

In this series of different states of the market, we understood the terminology and the concepts involved. However, in the forex market, if we do not go practical, there is the least use to the concept. In other words, one must understand how to trade in the market, knowing its state. In this final lesson of the series, we shall dive deep into the topic and understand how to apply them in the market.

Trading a Trend

Trading a trending market is the simplest and safest way to trade in the market. This is because, in a trend, it is evident on which party is dominating the market. For example, in an uptrend, it is clear that the buyers are more powerful than sellers. And hence, we look for buying opportunities rather than selling.

In a trend, the market makes higher highs and higher lows. In other words, the market moves in one direction with temporary pullbacks in the opposite direction. These pullbacks (retracements) typically turn around to the original trend direction at the support and resistance levels. So, to trade a trend, we wait for the market to make a higher high / lower low and retrace to the S&R level, before triggering the buy or sell.

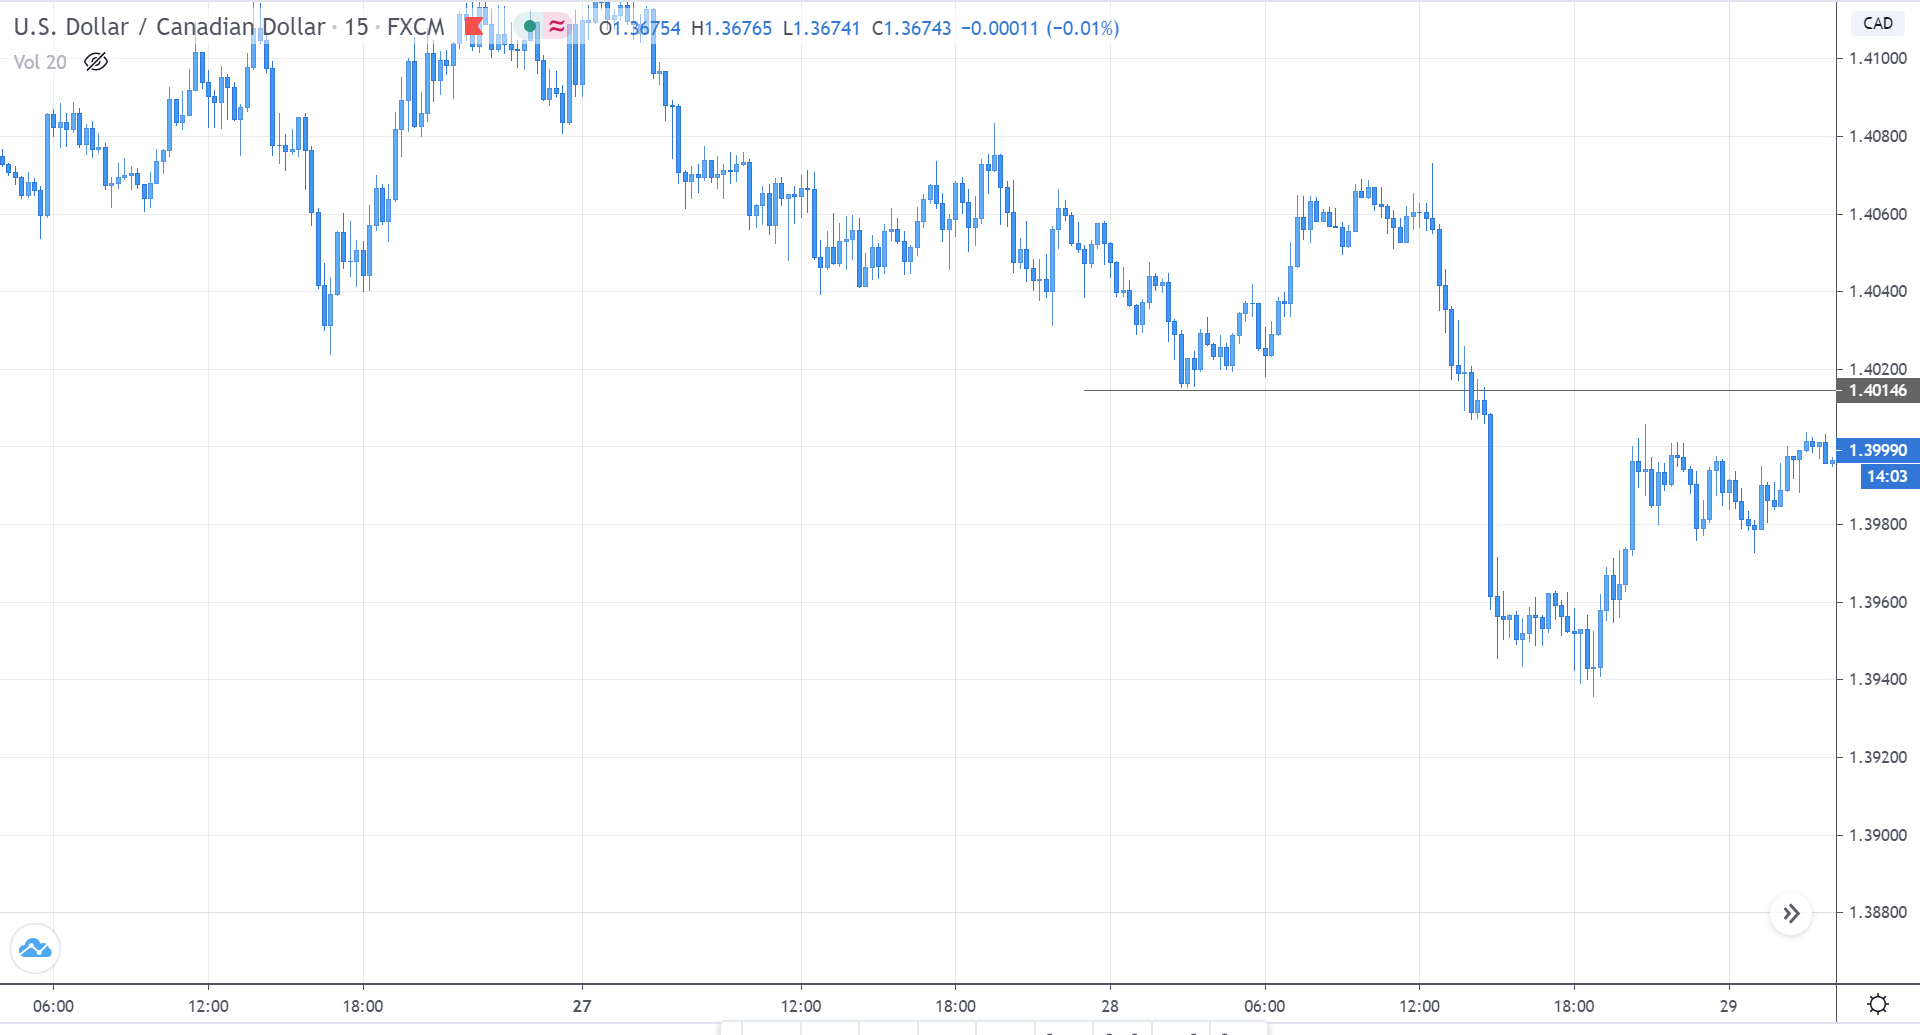
Consider the below chart of USD/CAD. The market is in a clear downtrend. The market made a new lower low by breaking below the grey ray. It then retraced back to the S&R area (grey ray) and is currently moving sideways. And this sideways movement in the market has high significance.

After the sellers made a new low, the buyers began to show up. They made it until the S&R level. And the market is currently in a range. As per the definition of a range, we know that there is strength from both the parties. In other words, the buyer who was temporarily dominating the market is slowing down as they are unable to make a higher high. And this price action is happening in the S&R area of the sellers. Therefore, we can conclude that the sellers are here to continue their downtrend.

One can enter when the price is at the top of the range (resistance) or when it starts to fall from the resistance. Placing the stop-loss few pips above the S&R level, and a take profit at the Low, is the safest approach to trade a trend.

Trading a Range

In a range, the market moves between levels – Support and Resistance. In this type of market, there is power from both buyers and sellers. Typically, the market shoots up from the support and drops from the resistance. However, randomly buying at support and selling from resistance is not the right way to trade a range like a professional. To trade a range with high odds in your favor, you must be aware of the overall trend. And you place your bets on the direction of the overall trend.

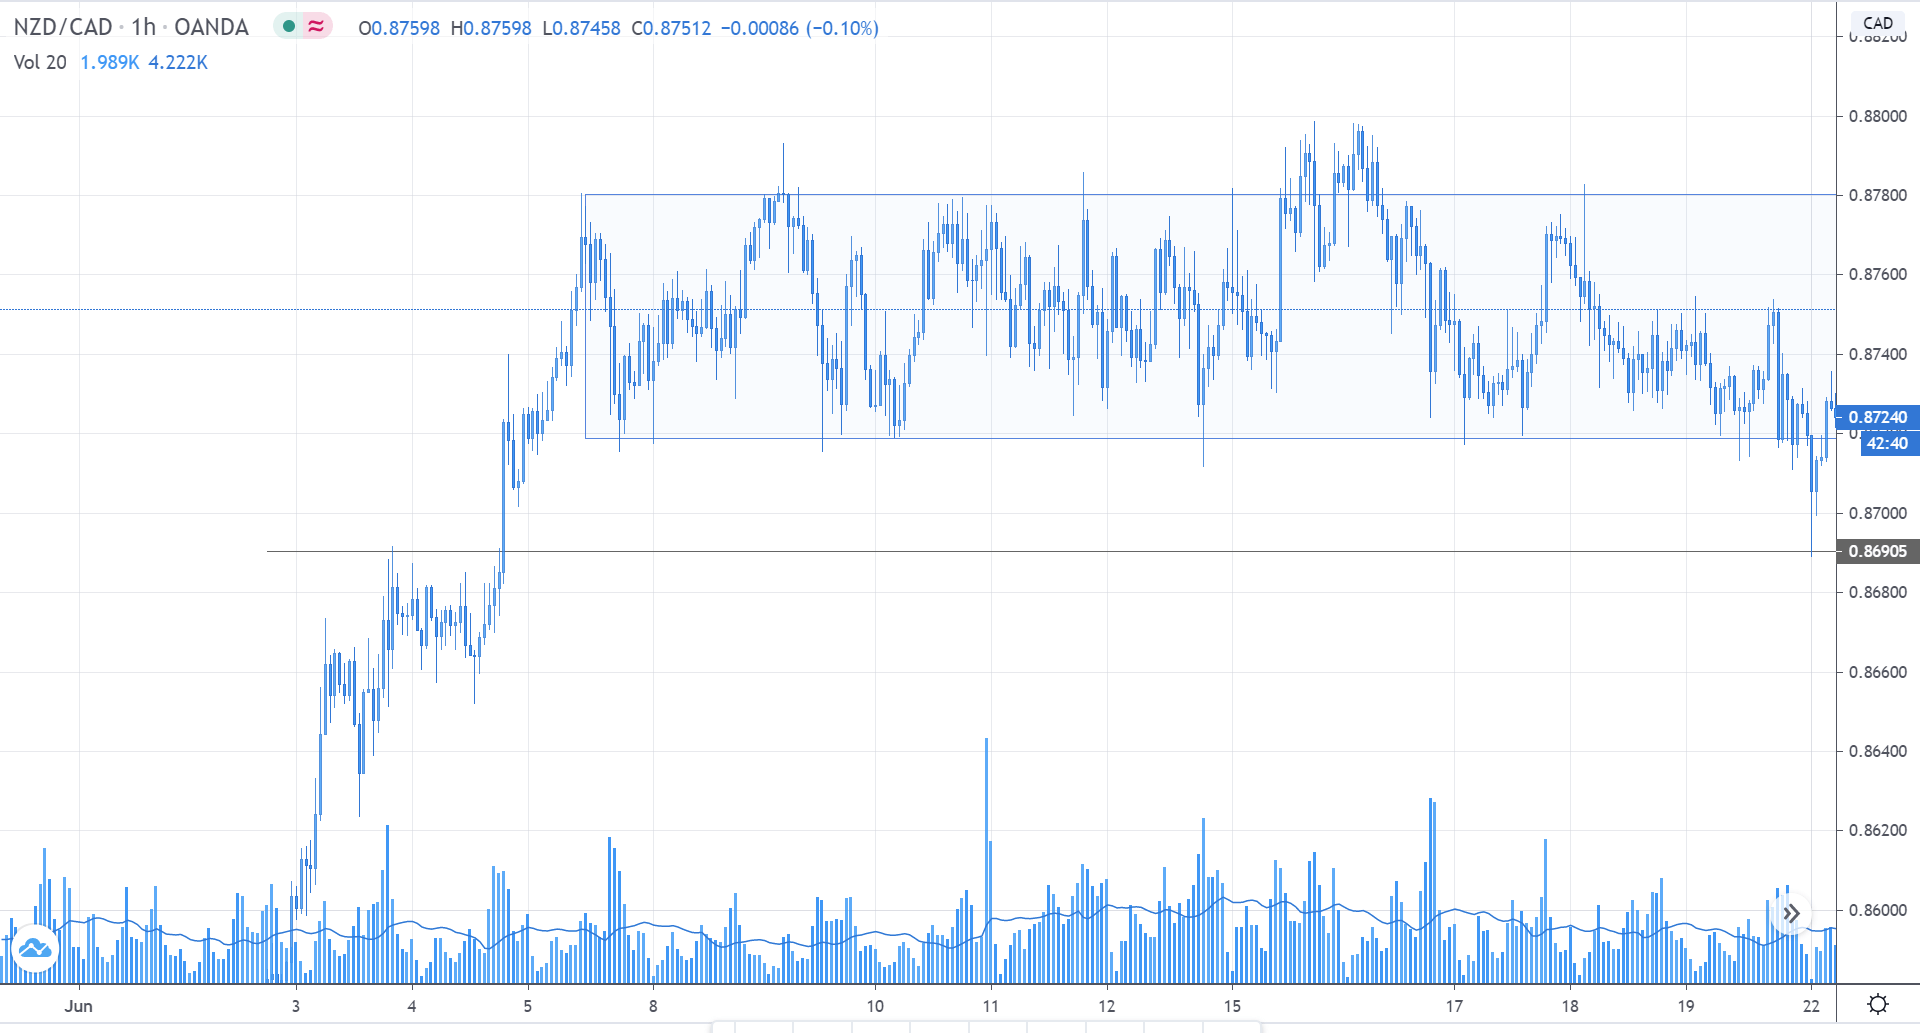
Consider the below chart of NZD/CAD. We can clearly see that the market is in a range. But, looking from the left, the market is in a strong uptrend, and the price is holding above the S&R level (grey ray). In the current market, we see that the price dropped below the bottom of the range, touched the S&R level, and shot right back up into the range. Thus, confirming that the big buyer is preparing to do the buys.

Since the price strongly reacted off from the S&R level and held above the support of the range, we can prepare to go long on the market. Stop-loss from this trade would be below the S&R level, while the target point would be at the top of the range. In hindsight, the buyers were able to push the market above than the resistance.

This brings us to the end of this series. We hope you found this lesson and the previous chapters interesting and informative. Stay tuned until we release our new set of lessons.

[wp_quiz id=”79656″]
Categories
Forex Basic Strategies

Trading The Forex Market Using The ‘Pendulum Strategy’

Introduction

In the previous set of articles, we developed techniques and strategies using the most important technical analysis indicators. We also discussed how one could enter the market and make the most out of those strategies. In today’s strategy, we shall discuss a technique that will help us to anticipate a range and trade in the later stages of the range formation.

Time Frame

The suitable time frame for this strategy is the hourly (H1) or 4-hourly (H4) chart. This means each candle on the chart represents 1 hour or 4 hours of price movement, respectively. This does not mean one cannot use the strategy on the 15 minutes or daily time frame. The only difference is that it is difficult to spot trading opportunities on those time frames.

Indicators

We will not be using any indicators for this strategy. The strategy is more price action based.

Currency Pairs

One should note that this strategy is suitable for all currency pairs listed on the broker’s platform. However, it is recommended to trade only in the seven major currency pairs, as the patterns are clearer in these currency pairs.

Strategy Concept   

A pendulum in motion swings back and forth because gravity is pulling it back to the normal position every time it swings away from it. The pendulum reaches a maximum height before it starts to fall back. However, if the swinging force is a lot, the string holding the pendulum will be cut, and the pendulum will fly off.

A ranging market acts similarly to the pendulum. Every time prices pull away from the mid-point of the range towards the top or bottom end of the range, market forces pull it back towards the mid-point of the range. However, sometimes when the market gains enough momentum, prices will break the support and resistance of the range and move into a trend.

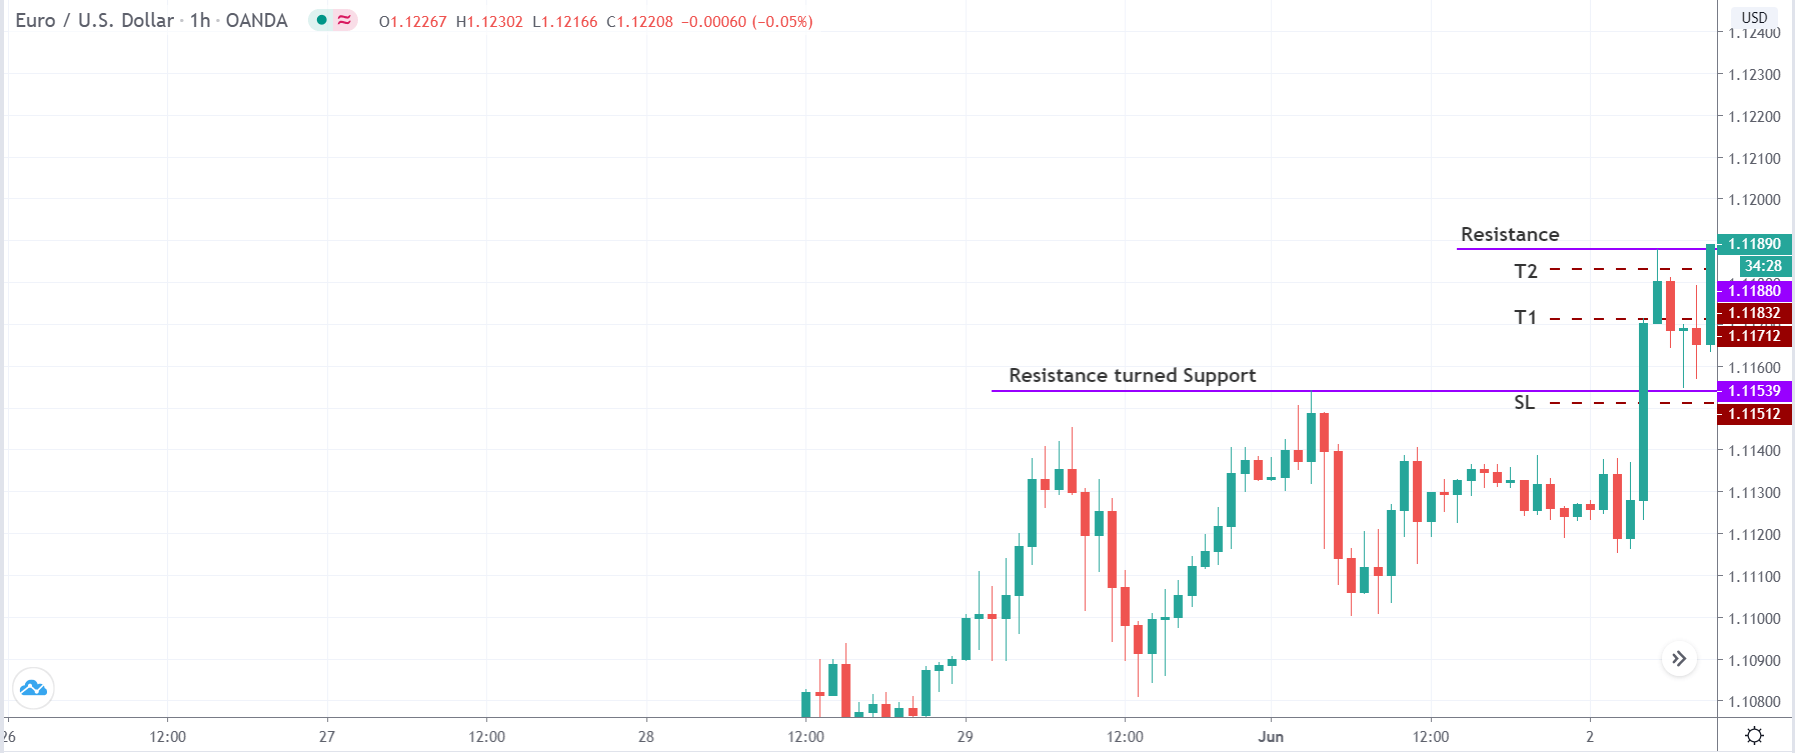
In this strategy, we wait for the pendulum to reach it’s optimal height and fall before entering the trade. We do this by executing a trade after the prices bounce back at the 10% market from either support or resistance. Our first target is set at 50% of the range, and the second target is set at the 90% mark of the range.

Trade Setup

We used the EUR/USD currency pair to illustrate the strategy, where we will be discussing a ‘long’ trade. Here are the steps to follow in order to execute the pendulum strategy.

Step 1

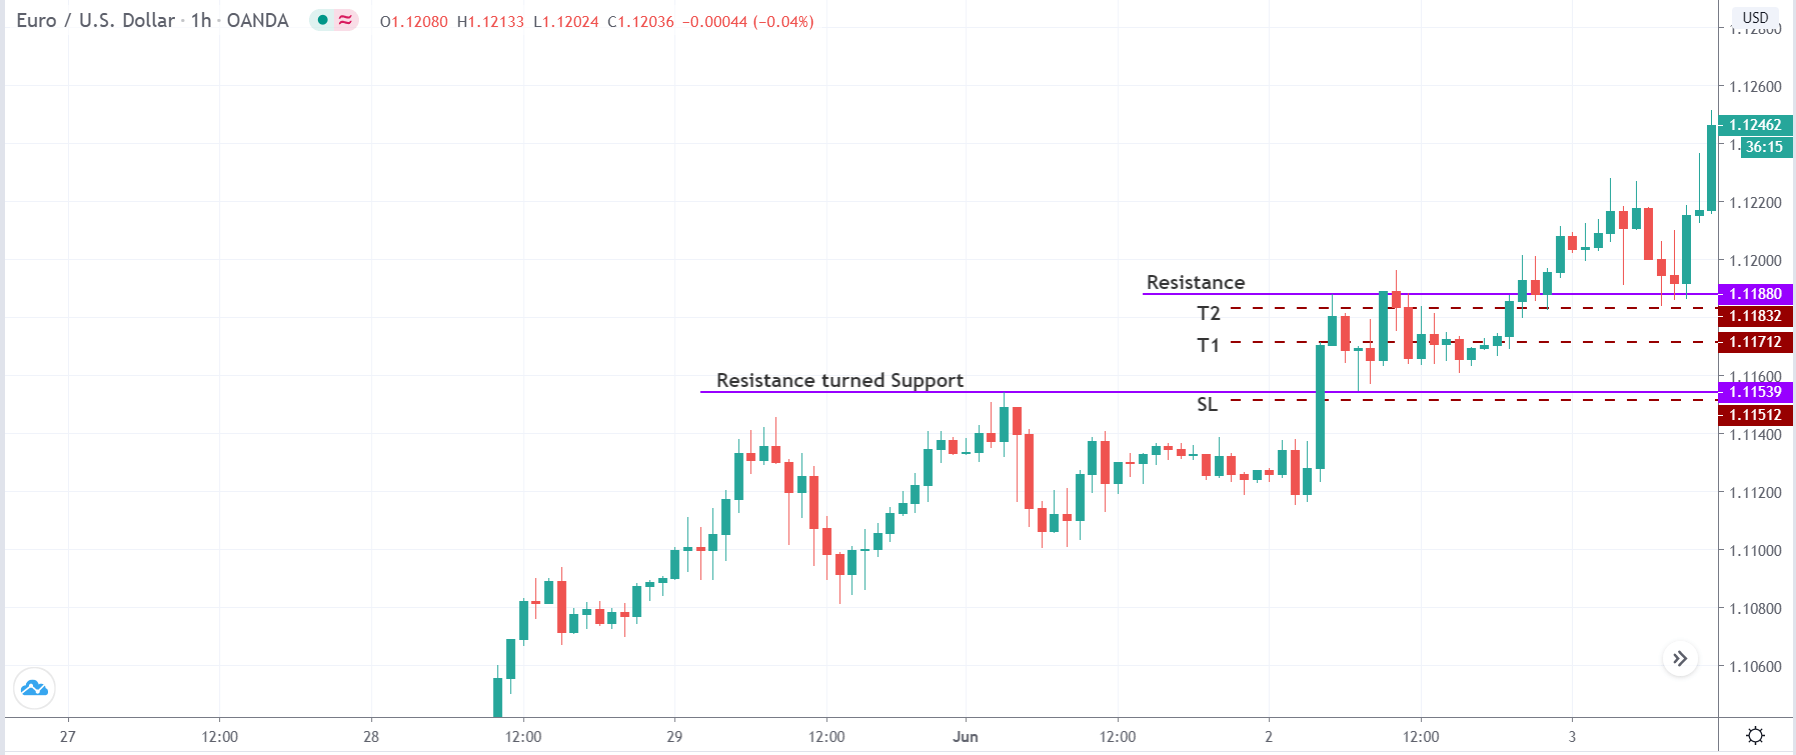
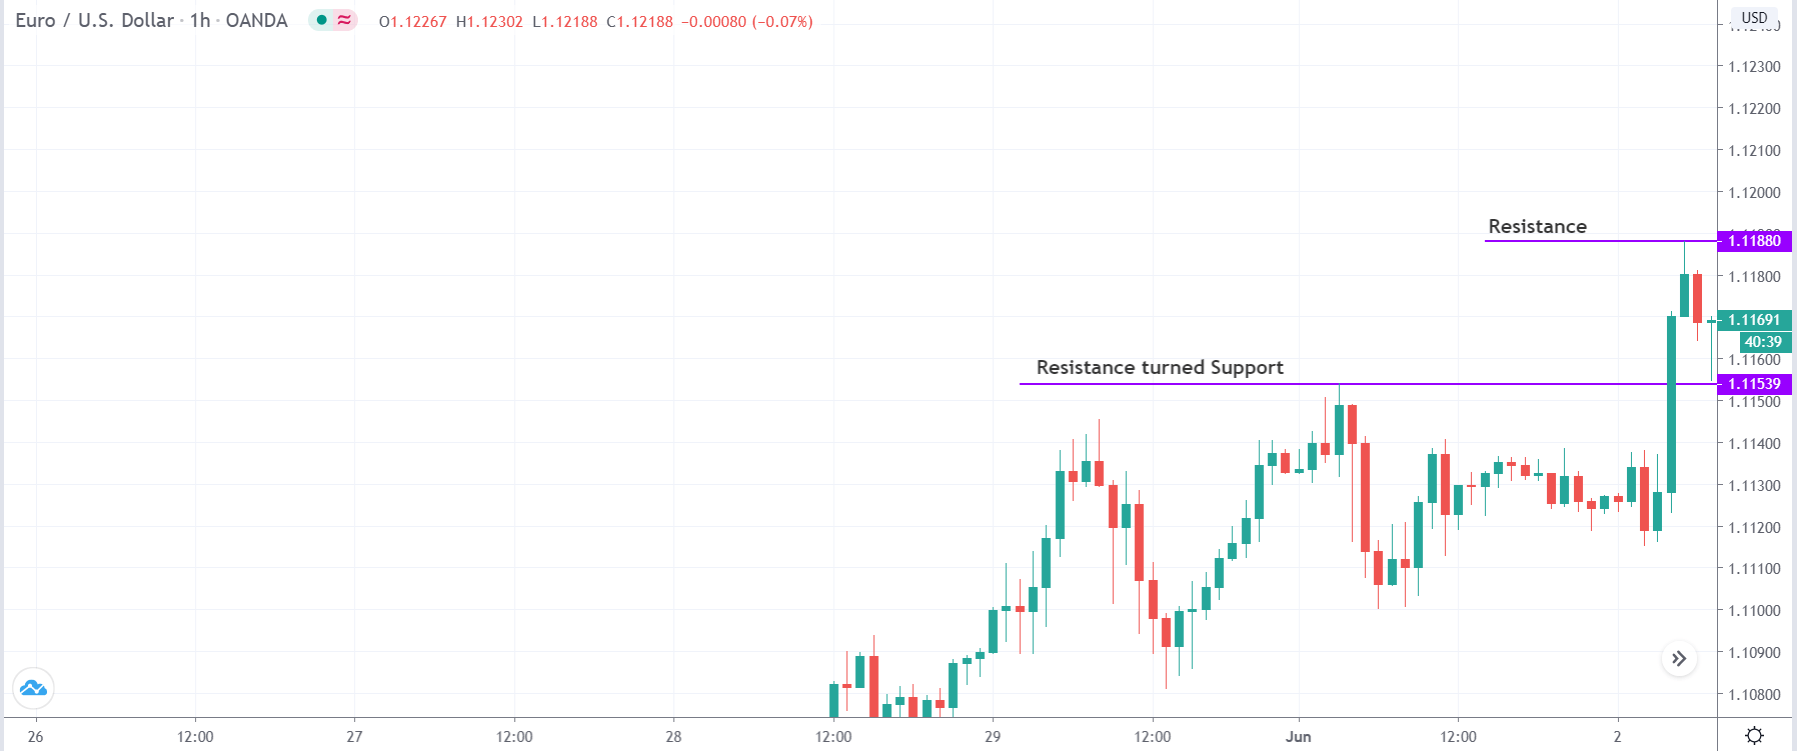
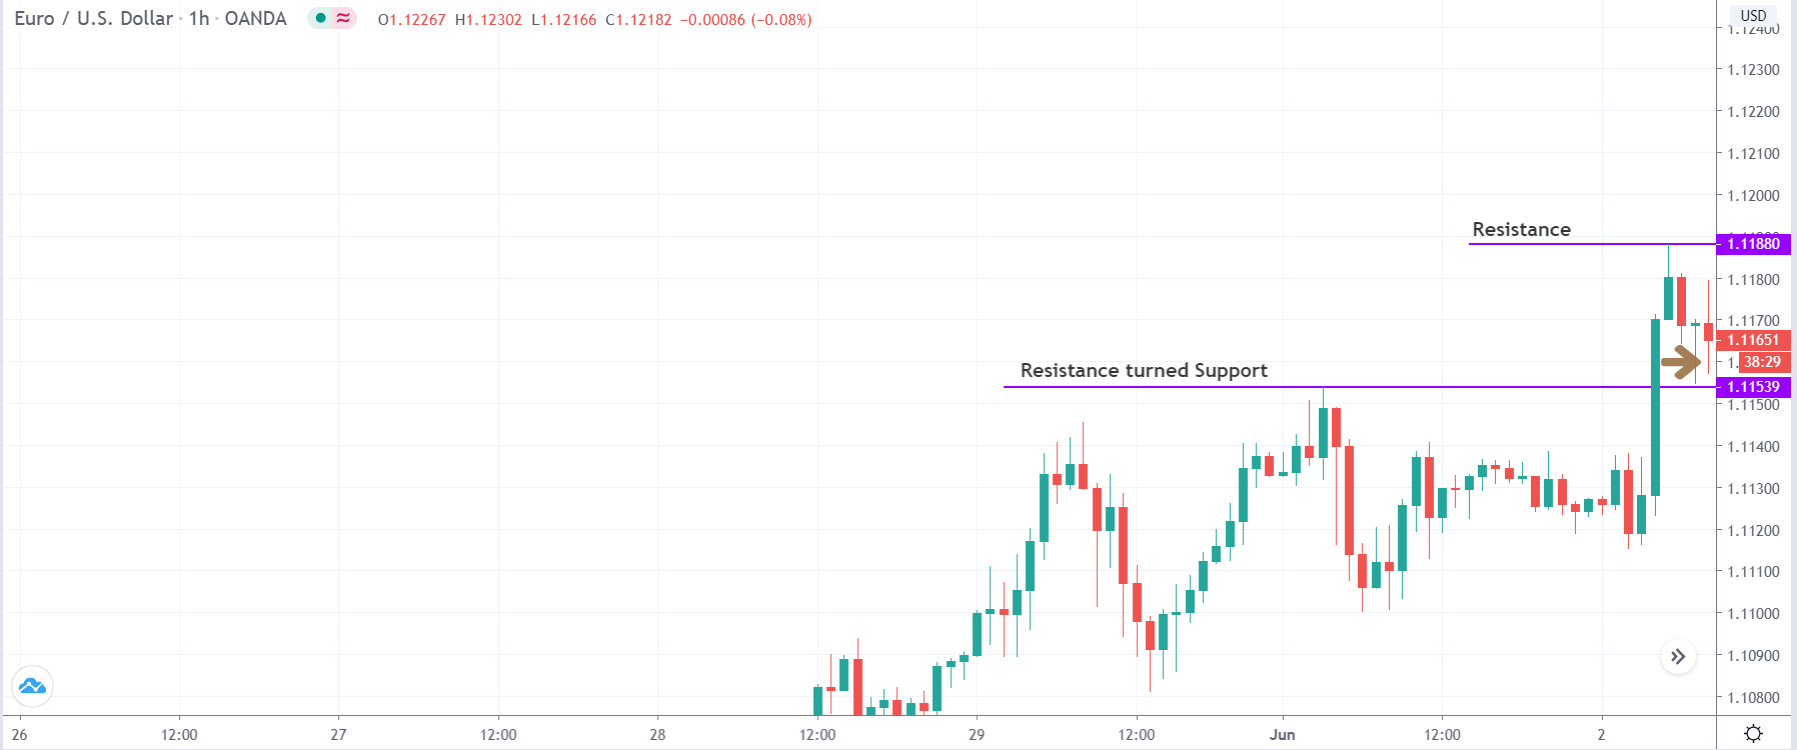
The first step of the strategy is to look for established levels of resistance turned support. By established, we mean the resistance which has now turned into support should be quite strong. It will be prominent if the breakout happens with strength, or essentially which happens after a news release.  After that, we need to mark our resistance, or ‘high’ from the market retraces to our support. These two important levels are marked in the below figure.

Step 2

The next step is to wait for the price to bounce off from the support area by 10% of the range that is created between the two lines marked. In the above example, the arrow mark points at the 10% value of the range, as shown in the below image. We will be entering the market for a ‘buy’ exactly after this 10% bounce. The stop loss for this strategy is placed somewhere at a price where the resultant risk to reward is 1.

Step 3

The best part of this strategy is that many emphases are put on trade management. In this step of the strategy, we remove 50% of our positions at the 50% mark of the range and 90% of the positions at the 90% mark of the range. In this, we ensure that even if the market reverses from the middle of the range and breaks below the support, we will still be profitable and would not any money even if the price hits our stop loss.

The points of the first and second targets are shown in the below figure, represented by brown dashed lines. One can also see the position of the Stop Loss marked by a brown dashed line.

We can see in the image below that the market finally breaks out and continues its upward momentum. When critical levels of resistance turned support and support turned resistance are found in an uptrend and downtrend respectively, traders can wait for the market to make new ‘highs’ or ‘lows’ and then book their profits.

Strategy Roundup

This strategy is applicable as long as the market is swinging back and forth in the form of a range. However, the main requirement of the strategy is to find strong levels of resistance turned support in an uptrend (preferably) and support turned resistance in a downtrend (preferably). If the breakout or breakdown does not occur with strength, the strategy might not yield the desired result, or the trade might work just a little bit. Although it looks like trading simple support and resistance strategy, establishing key levels at the beginning of the strategy and application of trade management is what makes this strategy different from trading traditional support and resistance.

Point of Caution

Previously, we mentioned to look out for key levels in trending markets, but at the same time, one needs to be cautious while determining these levels. One needs to check if the market is overbought, in case of an uptrend, or oversold, in case of a downtrend. An indicator that can help us determine the overbought and oversold conditions of the market is the Stochastic indicator.

Categories
Forex Course

127. Getting started with ‘Divergence Trading’

Introduction

There are several types of technical traders in the forex industry. Some trade based on price action while some trade using indicators. Price action traders typically do not use any indicator, but the Divergence is an exception to it. Divergence is an indicator concept that can yield immense risk to reward if used correctly. It is a powerful tool that helps traders catch the absolute peak and trough of the market.

What is Divergence?

Generally, the meaning of Divergence is to move apart. And the meaning of trading is no different. In forex, Divergence is a scenario when the price charts do not agree with the movement of the indicator. In a sense, if the price moves in one direction, the indicator moves in the other direction.

Formation of Divergence

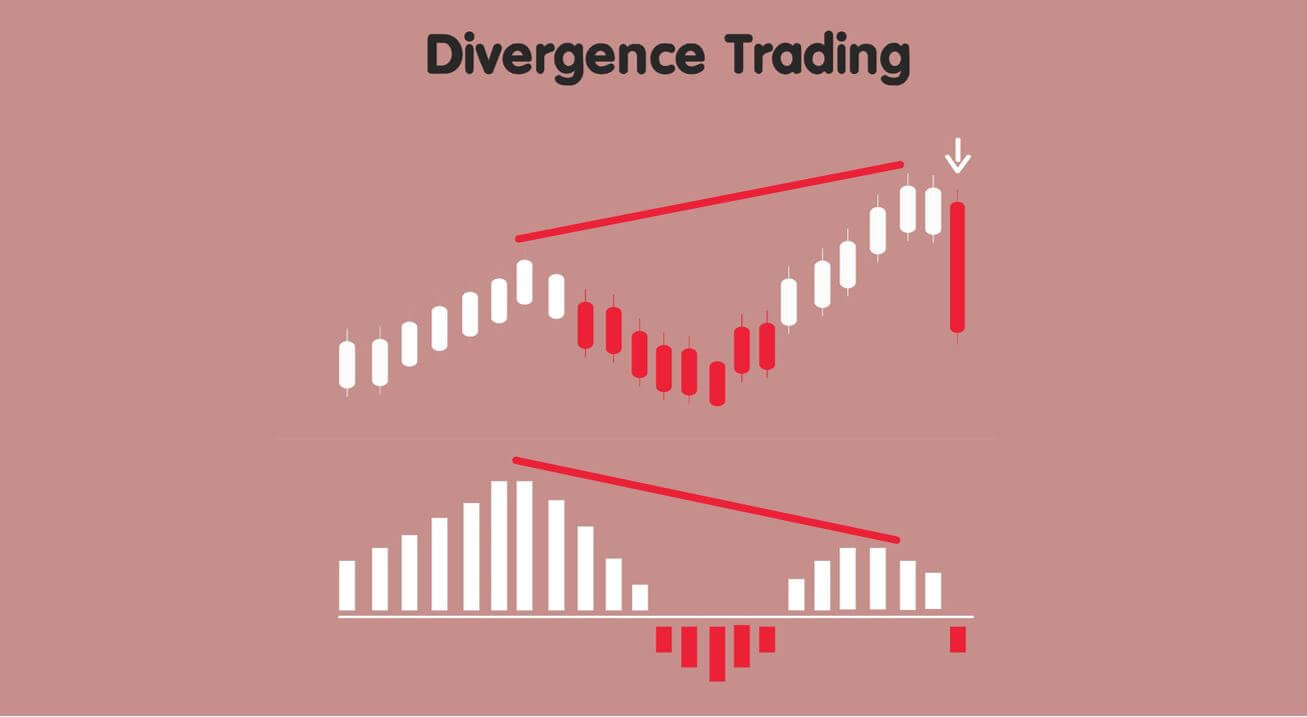
Divergence can be found by comparing the price action on the charts with an oscillator indicator. Typically, Divergence is formed in trending markets. That is, they occur in markets that move making higher highs and or lower lows.

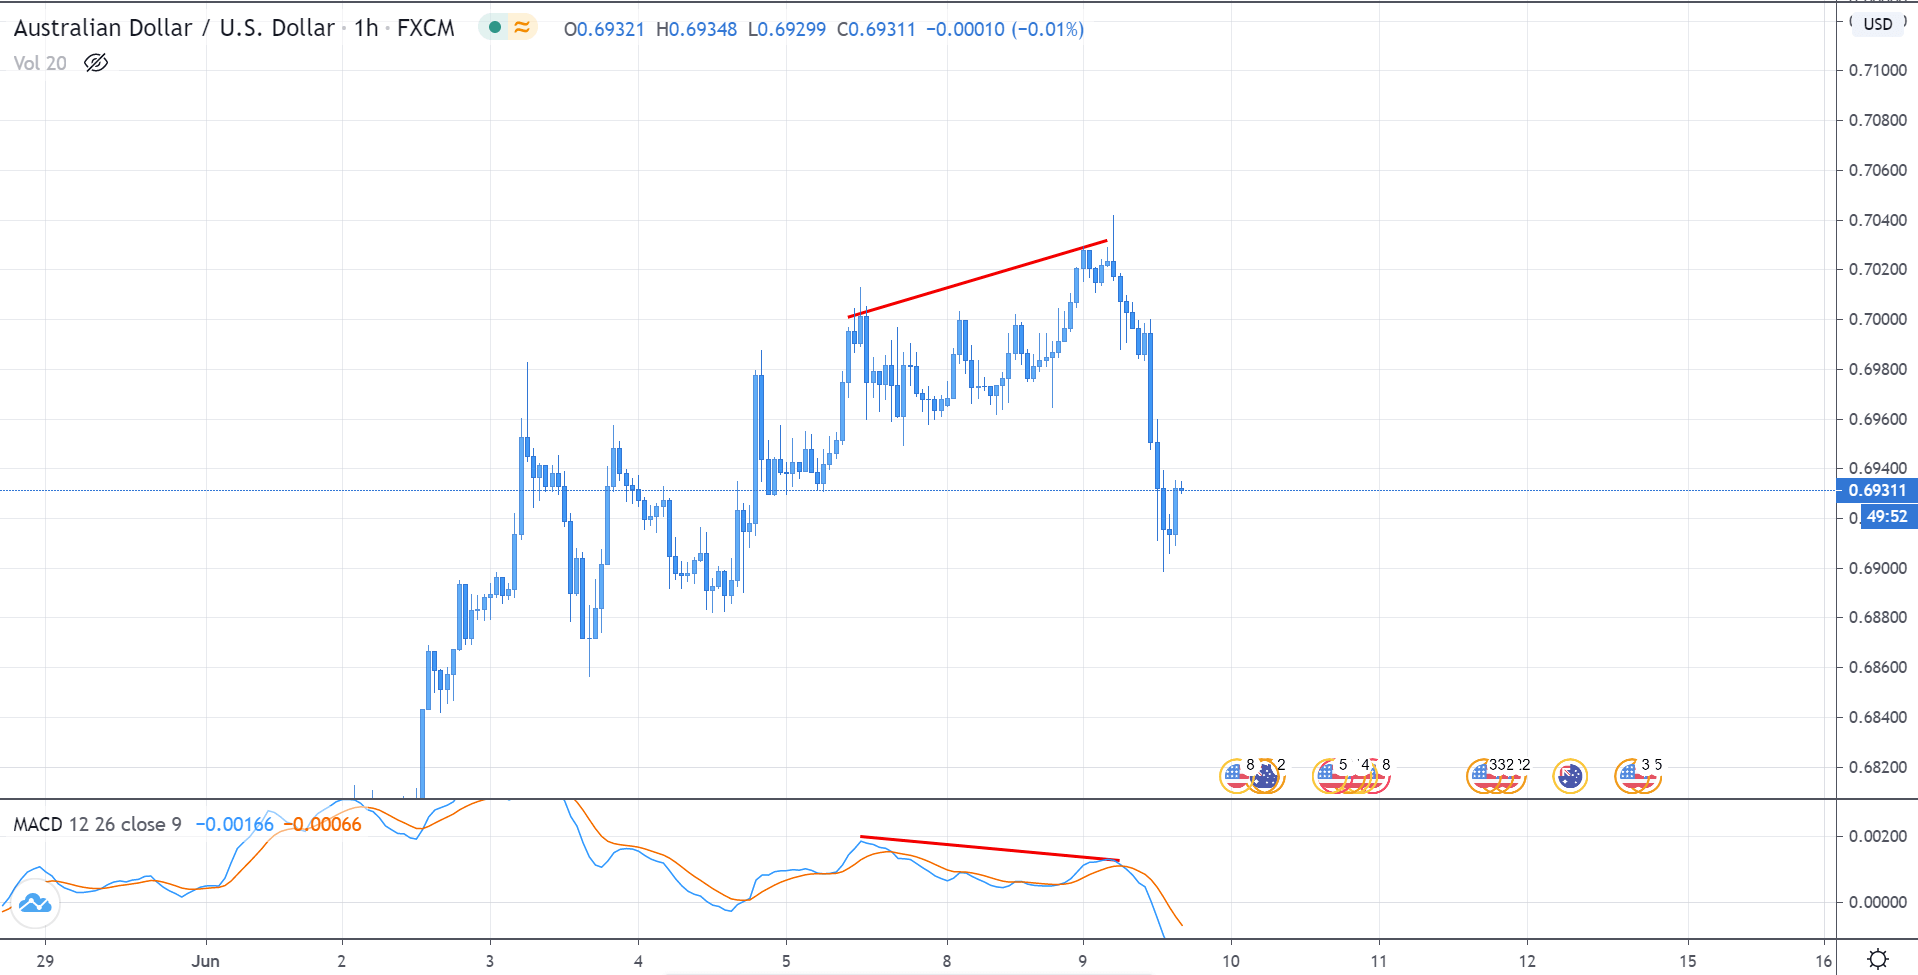
Consider a market a market making higher highs and higher lows. The job of an oscillator indicator is to follow the price action. Thus, the indicator should also follow an upward trajectory. But, if the charts make higher highs and the indicator makes an equal or higher low, then we conclude that there is a divergence in the market.

Significance of Divergence

Divergence is used to signify that there is something not right in the market and the uptrend. In an uptrend, for instance, the market breaks above the recent resistance (high), makes a new high, retraces to the Support & Resistance level, and continues the same cycle. But when the market makes a higher high with Divergence, there is a high possibility that the market might not hold at the S&R level. The market could reverse or might drop slightly below the S&R and then continue the uptrend.

Indicators used to Identify Divergence

Divergences can be identified using oscillator indicators. An oscillator, going by the name, moves between two levels – overbought and oversold. Typically, a level above 70-80 is considered overbought, and a level below 20-30 indicates an oversold market.

Following are the most commonly used indicators to identify Divergence

  1. Relative Strength Index (RSI)
  2. Stochastic Indicator
  3. Moving Average Convergence Divergence (MACD)

Types of Divergence

Based on the direction of the market, there are two types of Divergence:

Regular Divergence

This is the most used type of Divergence and very easy to spot. They are found at the top or bottom of a trend and are used to give a reversal signal. Regular Divergence can again be split into two types: Bullish Divergence | Bearish Divergence.

Hidden Divergence

Hidden divergences are relatively trickier to spot. Converse to regular Divergence, hidden Divergence is used for a trend continuation indication. They are typically found in the middle of a trend. Hidden divergences, too, can be divided into two types: Hidden Bullish divergence | Hidden Bearish Divergence.

That’s about the introduction to divergences. In the next lesson, we shall elaborate on each of the divergence types.

[wp_quiz id=”77516″]
Categories
Forex Basic Strategies Forex Daily Topic

An Old Theory about Support/Resistance

In price action trading, traders rely on support/resistance a lot. Beginners often ask a question of whether they are predetermined. In answer to this, they are predetermined to some extent. A trader can guess level/levels that may work as support/resistance. The idea is simple. Support becomes resistance, and resistance becomes support. In today’s lesson, we are going to demonstrate an example of this.

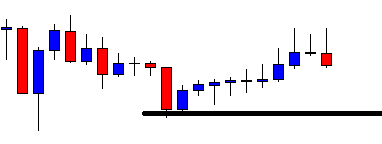
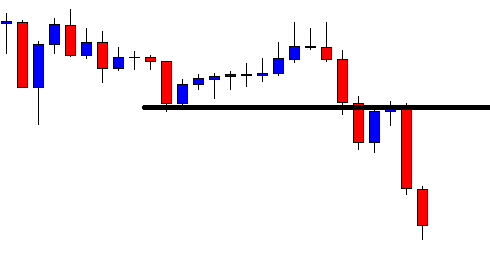
The price has a bounce at the drawn level and heads towards the North. The last candle comes out as a bearish engulfing candle. The price may head towards the South. If that happens, the sellers are to wait for a breakout at the drawn level. Let us proceed to find out what happens next.

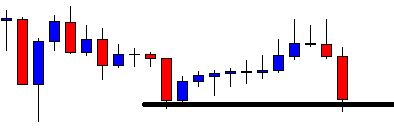
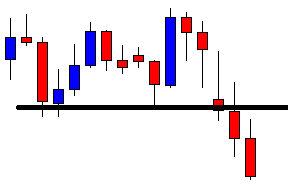
The next candle comes out as a bearish candle as well. However, it does not make a breakout. This is an interesting chart for both the buyers and the sellers. The buyers may wait to get a bullish reversal. Since this is the level where the price has bounce earlier, this may become double bottom support. On the contrary, if the price makes a bearish breakout at the drawn level, the sellers dominate in the pair.

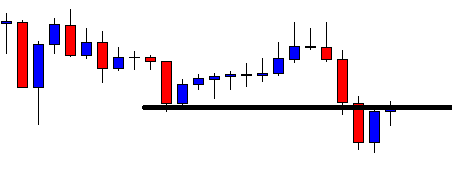
The bear wins. The last candle closes well below the drawn level. This is an explicit breakout. The sellers are to wait for the breakout confirmation. If the chart produces another bearish candle closing below the last candle, the price may find its next resistance at another significant level. In most cases, the price usually goes back and finds its resistance at the breakout level, which was the level of support earlier.

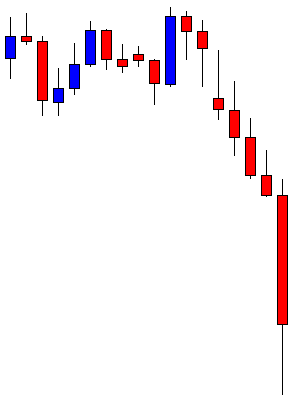
Look at the chart. The price goes back to the breakout level and creates a doji candle. Do you notice the doji candle is produced right at the drawn level? This means the level may drive the price towards the South by being the level of resistance.

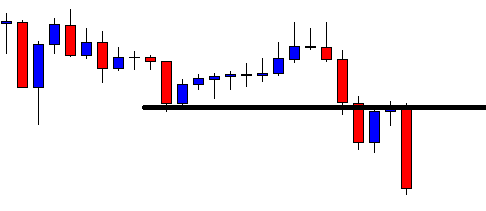
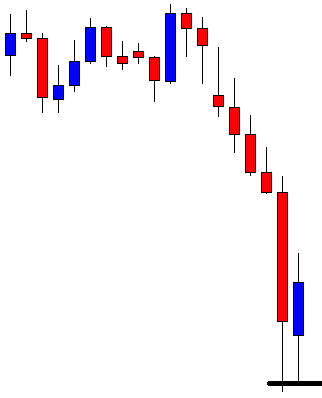
The level produces a bearish engulfing candle closing below consolidation support (This may become resistance later as well). The last candle suggests that the price may head towards the South with good bearish momentum. The sellers have found the new resistance.

As expected, the price heads towards the South for one more candle. It usually happens when support/resistance produces an engulfing candle as a reversal candle. In the end, a level of support flips and becomes a level of resistance. If we closely observe, we find this is what happens almost every time. Support becomes resistance, and vice versa. By obeying the theory, experienced traders spot out the levels of support/resistance well ahead.

Categories
Forex Daily Topic Forex Price-Action Strategies

Price Action Trading: Let it go

The Engulfing Candle is considered one of the most influential candles to indicate a trend reversal. Price action trading is closely related to identifying trend reversal for which price action traders give value to engulfing candles a lot. In today’s lesson, we are going to demonstrate an example of an engulfing candle, which does not work in favor of the traders. We try to find out the reason behind that.

The chart shows that the price heads towards the South with good bearish momentum. On its way, it makes a breakout and trades below the level for one more candle. The sellers are to keep an eye on this pair for the price to consolidate and produce a bearish engulfing candle closing below consolidation support. Do not miss the point ‘closing below consolidation support’.

The price does not consolidate. It instead produces another bearish candle. It may consolidate now. A candle like this attracts more sellers to go short on the pair. Let us proceed to the next chart.

The chart produces a bullish inside bar. This means the chart is still bearish biased. The signal candle may come out at any time. The waiting game gets intense. The sellers are to keep checking the chart since the next candle may be the signal candle.

The chart makes them wait further. It produces a bearish inside bar followed by a bullish engulfing candle. The chart is still bearish biased, but the chart may get choppy as well if the next candle comes out as a bullish candle. Let us wait and find out how the next candle comes out.

The next candle comes out as a bearish engulfing candle. Is this what the sellers want? Here is a question for you. Would you trigger a short entry?

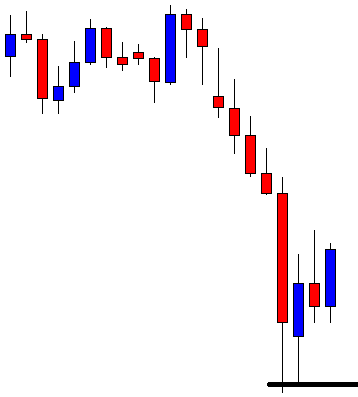
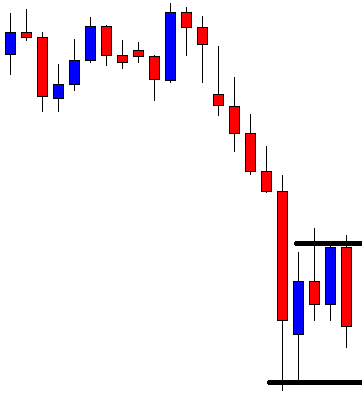
If the answer is no, you are right. The reason behind that is this is an engulfing candle, but it does not close below consolidation support. Look at the line below. This is where both candles get rejection. Thus, we may consider this one as consolidation support. Even if we consider only their bodies (not the best way), the candle closes within that level as well. The equation is an engulfing candle does not make a breakout. Thus, traders may skip taking this entry. We need to make sure these four things are there before taking entry based on this setup.

  1. Clear trend
  2. Consolidation
  3. Engulfing candle
  4. Breakout

If a trade setup misses any one of these, be patient. Let it go.