
Introduction
One of the most annoying things for a trader is getting stopped out of a ‘long’ trade on the lowest possible tick, after which the prices reverse and move higher. Likewise, nothing can get more annoying than getting out of a ‘short’ trade on the highest possible tick of the move, after which prices reverse and ultimately move in our direction for profit.
All of us would have experienced this unpleasant reality more than once. We have designed a strategy specifically to take advantage of these spike moves in currencies by carefully getting into a trade by anticipating a reversal.
Traders who like to bank on consistent and small profits might feel this strategy appealing despite experiencing frequent stop-outs. Before going through the strategy and the trade setup, we must understand that while it misses infrequently, but when it misses, the losses can be very large.
Therefore, it is absolutely crucial to honor the stop-loss in these setups because when it fails, it can mutate into a relentless runaway move than could blow up our entire account if we continue to hold on to our trades.
Time Frame
This strategy works well on all time frames above the 1 hour. This strategy cannot be used for scalping as the risk is higher.
Indicators
In this strategy, we will not be using any indicators as it is based on pre-determined rules and price action.
Currency Pairs
This strategy applies to almost all the currencies listed on the broker’s platform. However, illiquid pair should be completely avoided.
Strategy Concept
The trade setup that is formed using this strategy lies on the assumption that support and resistance points of tops and bottoms exert an influence on price action after they are breached. They act like a magnetic field attracting prices back to these points after a majority of the stops have been triggered. The thesis behind this strategy is that it takes an enormous amount of power to breakout or breakdown from tops or bottoms that are created after an extended move.
In the case of a top, for example, making a new ‘high’ requires not only huge capital and power but also enough momentum to fuel the rally further. By the time it makes a ‘new’ high, much of the momentum has passed, and it is unlikely that we will see a new ‘high.’ Dolphins have a very strong memory, and since this strategy is based on the memory of the price, we have named this strategy as ‘The Dolphin Strategy.’
Trade Setup
In order to explain the strategy, we have considered the EUR/USD pair, where we will be applying the strategy on the 1-hour time frame. Here is the step-by-step approach to executing the strategy effectively.
Step 1
First, we need to identify a sequence of ‘higher highs’ and ‘higher lows’ on the chart when looking for a ‘short’ trade setup. Similarly, we need to identify a sequence of ‘lower lows’ and ‘lower highs’ when looking for a ‘long’ trade. Then we are required to mark the highest point (‘short’ setup) or the lowest point on the chart (‘long’ setup).
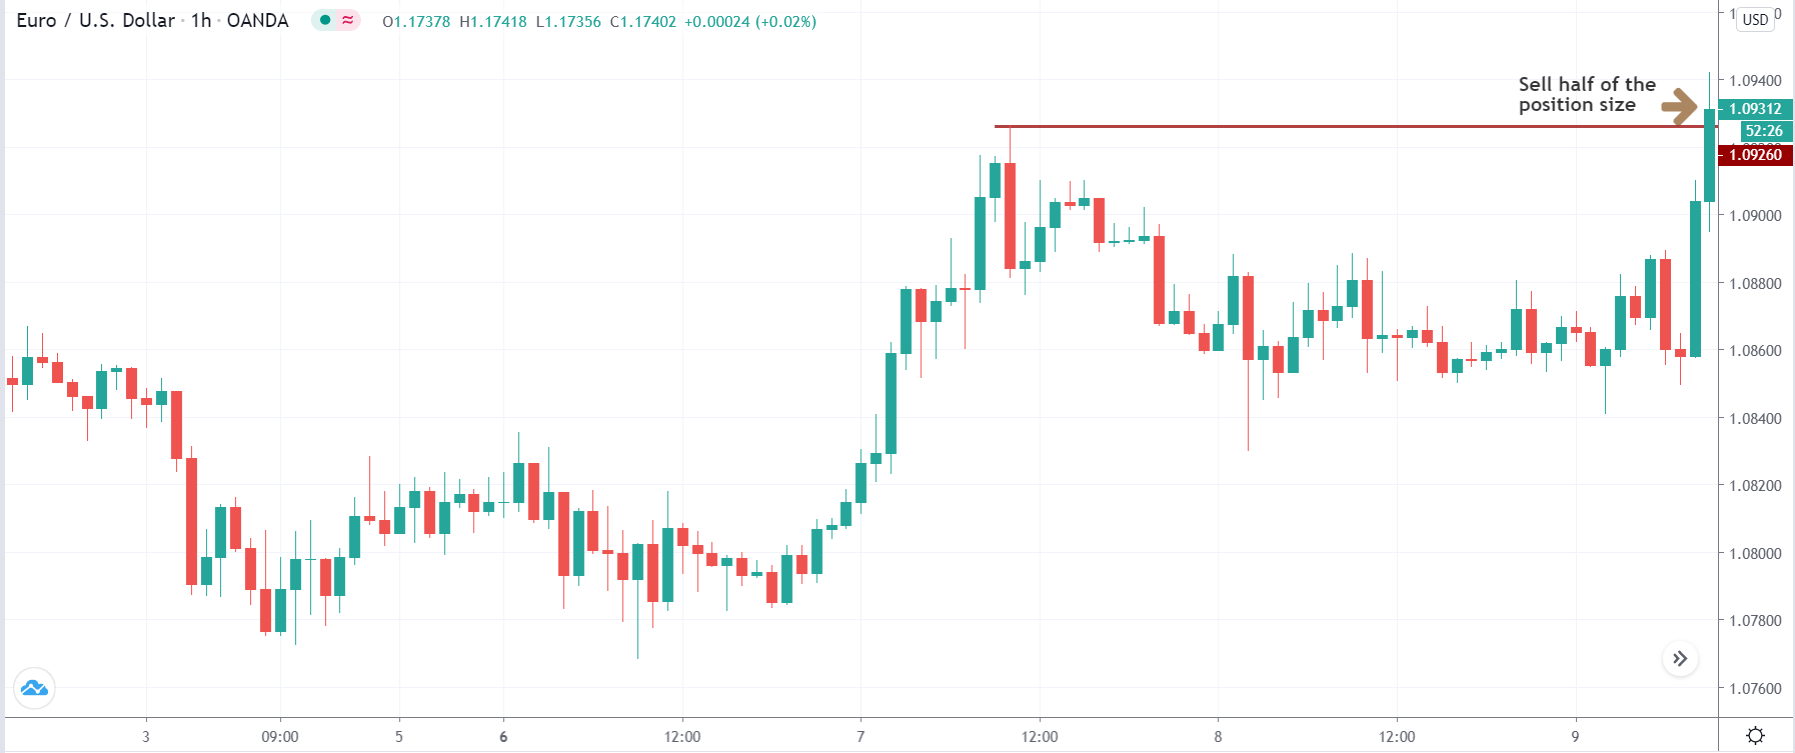
In our case, as will be executing a ‘short’ trade, we have identified a swing ‘high’ on the chart shown in the below image.

Step 2
Assuming that we have calculated our position size, we will ‘sell’ half of our position size at the ‘high,’ which was identified in the previous step. In a ‘long’ setup, we will ‘buy’ half of our position size at the ‘low’ identified previously. If the market is strongly trending upwards or downwards, we have to take a position of size lesser than ‘half.’
We are taking half of our ‘short’ positions at the previous ‘high’ once the market starts moving upwards after a retracement.
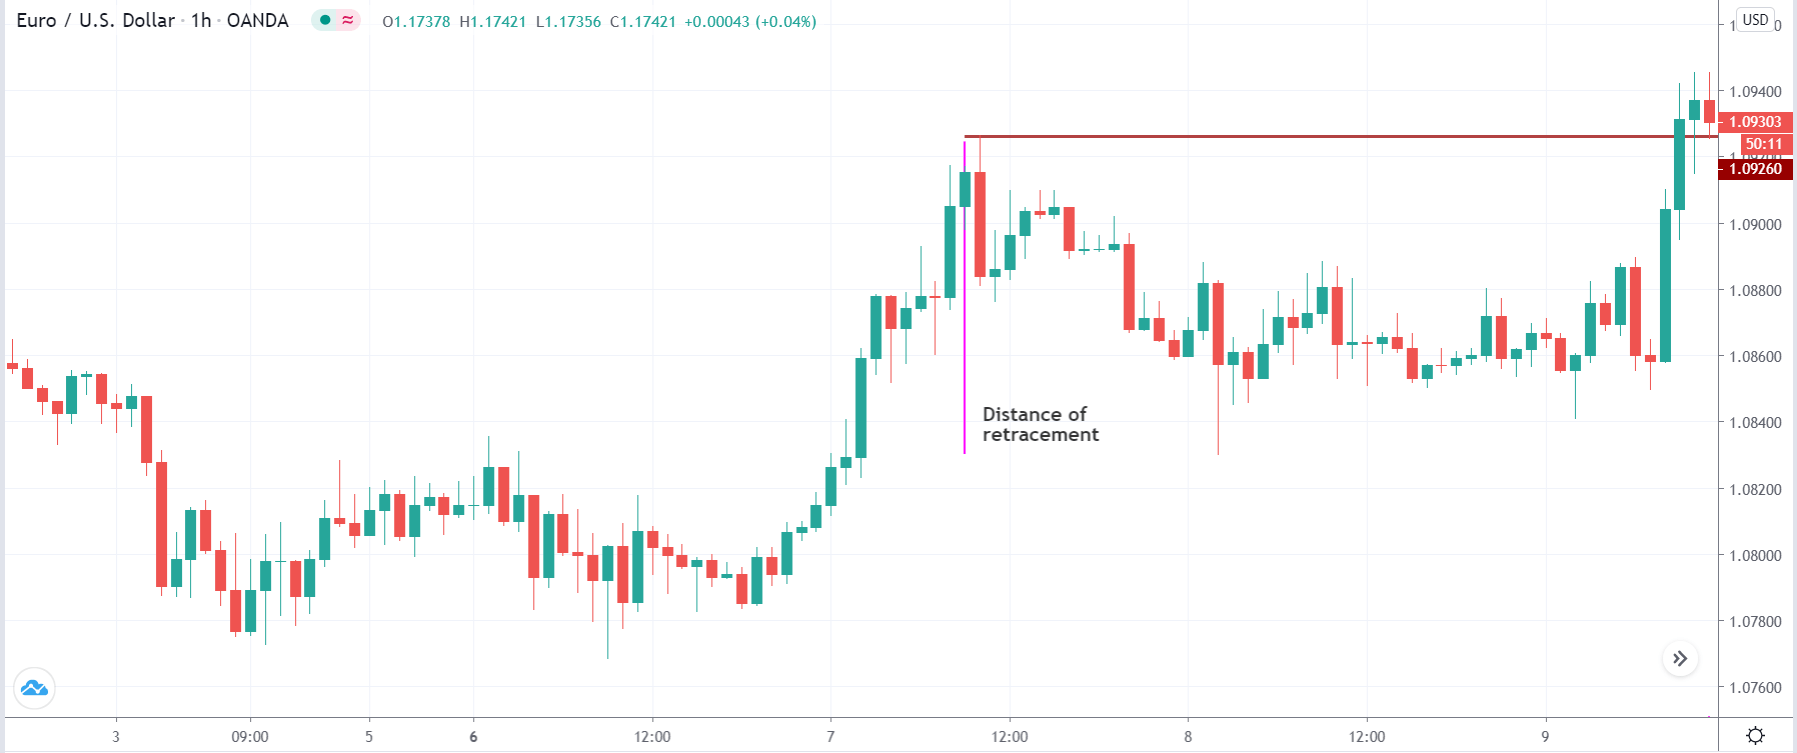
Step 3
In this step, we have to measure the distance of the ‘retracement’ or ‘pullback,’ which takes place after the price makes the ‘high’ or ‘low’ that was identified in the first step. Measuring this distance with the help of a measuring tool is crucial as further steps of the strategy are based on this distance.
The below image shows the distance of the ‘pullback’, measured with the help of a vertical pink line.
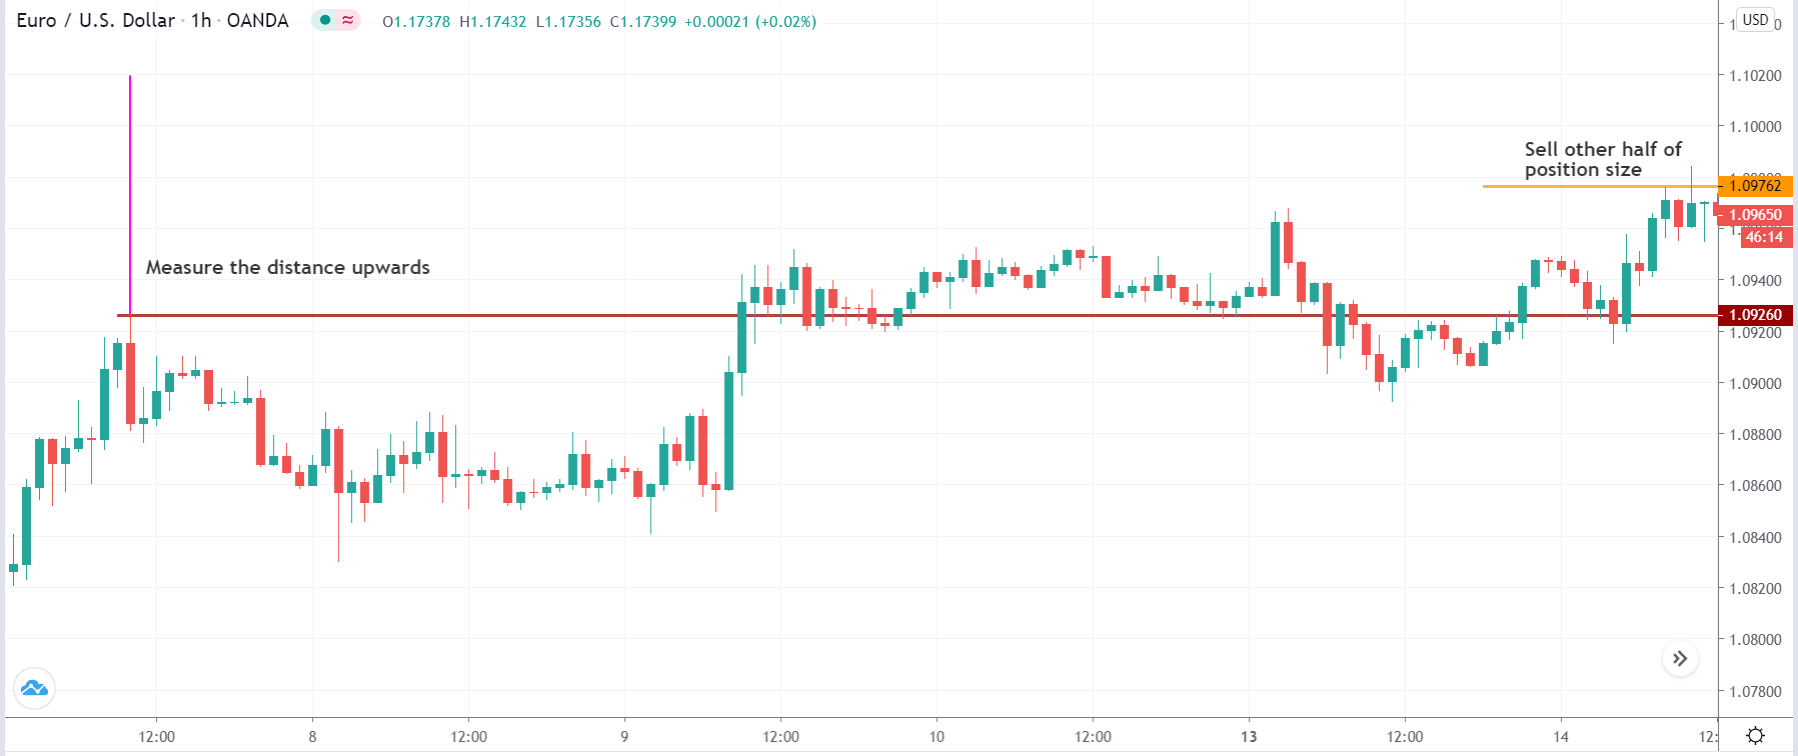
Step 4
In this step, we need to measure the exact same distance that was measured in the previous step above the ‘high’ in an up move or below the ‘low’ in a down move. In a ‘short’ setup, when the price starts moving above the ‘high,’ we will execute the remaining half of the positions at the half-way mark of this distance. Likewise, in a ‘long’ setup, we will execute the remaining half of our positions at the half-way mark of this distance, when the price starts moving lower.
The below image shows the point on the chart where we have executed the remaining positions.
Step 5
Now that we have entered the market with full position size, we have to set an appropriate stop-loss and take-profit for the trade. The ‘stop-loss’ is placed at the price corresponding to the distance of the ‘pullback’ that was measured in ‘Step-3.’ We take profits at two places in this strategy.

The first ‘take-profit’ is at support turned resistance or resistance turned support line. And the second ‘take-profit’ is at the ‘higher low’ from where the market goes back to the ‘high’ identified in the first step. In a ‘long’ trade, it will be at the ‘lower high’ from where the market goes back to the ‘low’ identified in the first step.
Strategy Roundup
One of the concerns for some traders might have with the ‘Dolphin Strategy’ is its asymmetrical structure and complex rules. Readers with good maths skills and trading experience notice the best of the trade setups using this strategy and harvest high risk-to-reward ratios. Traders need to be very strict with their stop-loss as the market might move in one direction only. However, the strategy works in our favor as it is a high probability setup.