
Introduction
In the previous set of articles, we developed techniques and strategies using the most important technical analysis indicators. We also discussed how one could enter the market and make the most out of those strategies. In today’s strategy, we shall discuss a technique that will help us to anticipate a range and trade in the later stages of the range formation.
Time Frame
The suitable time frame for this strategy is the hourly (H1) or 4-hourly (H4) chart. This means each candle on the chart represents 1 hour or 4 hours of price movement, respectively. This does not mean one cannot use the strategy on the 15 minutes or daily time frame. The only difference is that it is difficult to spot trading opportunities on those time frames.
Indicators
We will not be using any indicators for this strategy. The strategy is more price action based.
Currency Pairs
One should note that this strategy is suitable for all currency pairs listed on the broker’s platform. However, it is recommended to trade only in the seven major currency pairs, as the patterns are clearer in these currency pairs.
Strategy Concept
A pendulum in motion swings back and forth because gravity is pulling it back to the normal position every time it swings away from it. The pendulum reaches a maximum height before it starts to fall back. However, if the swinging force is a lot, the string holding the pendulum will be cut, and the pendulum will fly off.
A ranging market acts similarly to the pendulum. Every time prices pull away from the mid-point of the range towards the top or bottom end of the range, market forces pull it back towards the mid-point of the range. However, sometimes when the market gains enough momentum, prices will break the support and resistance of the range and move into a trend.
In this strategy, we wait for the pendulum to reach it’s optimal height and fall before entering the trade. We do this by executing a trade after the prices bounce back at the 10% market from either support or resistance. Our first target is set at 50% of the range, and the second target is set at the 90% mark of the range.
Trade Setup
We used the EUR/USD currency pair to illustrate the strategy, where we will be discussing a ‘long’ trade. Here are the steps to follow in order to execute the pendulum strategy.
Step 1
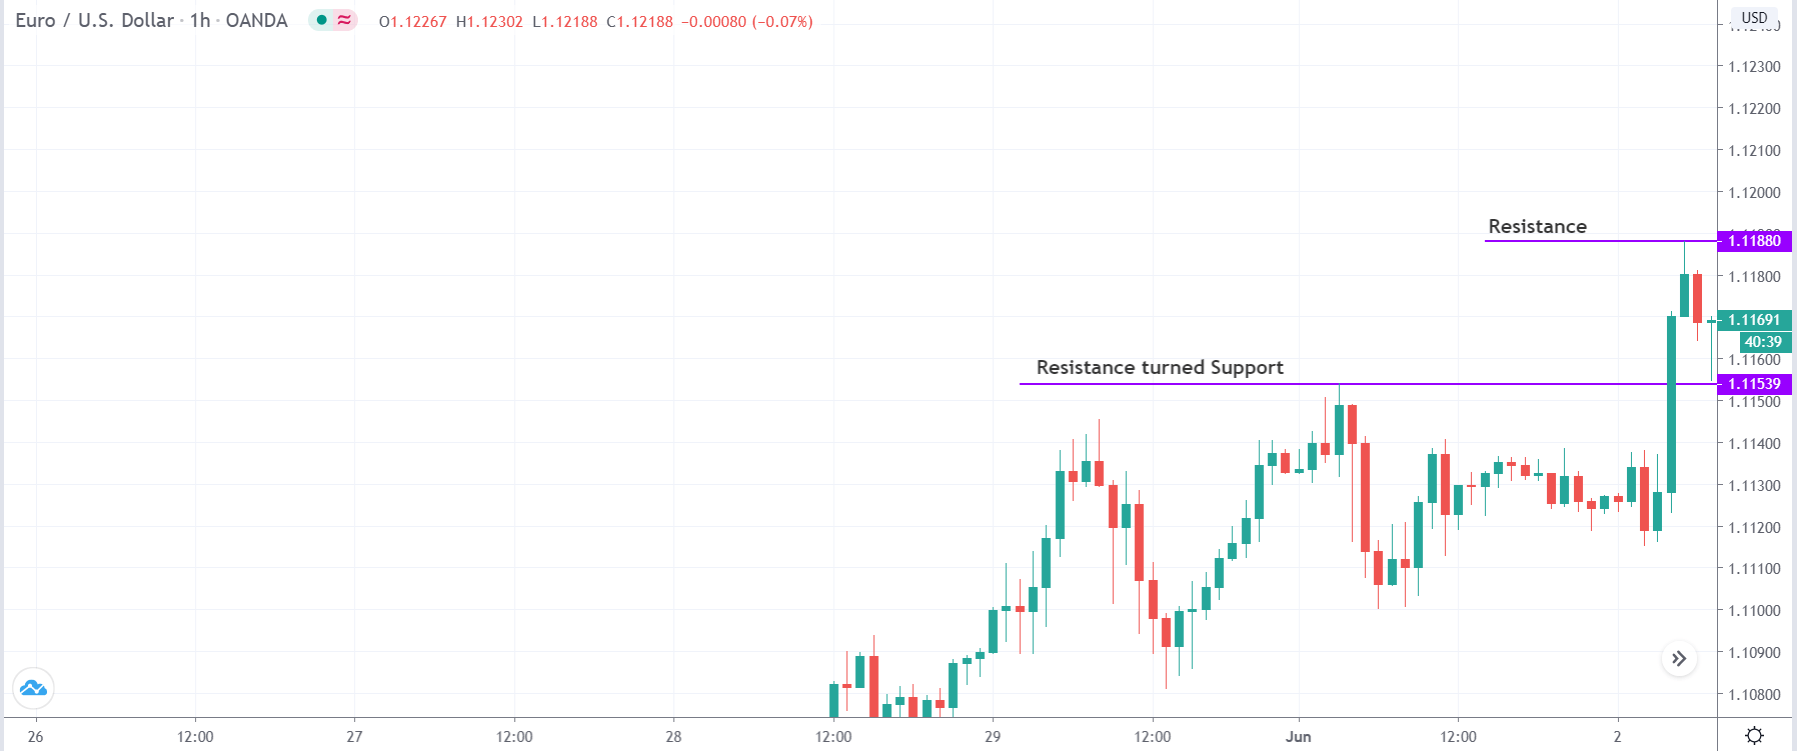
The first step of the strategy is to look for established levels of resistance turned support. By established, we mean the resistance which has now turned into support should be quite strong. It will be prominent if the breakout happens with strength, or essentially which happens after a news release. After that, we need to mark our resistance, or ‘high’ from the market retraces to our support. These two important levels are marked in the below figure.
Step 2
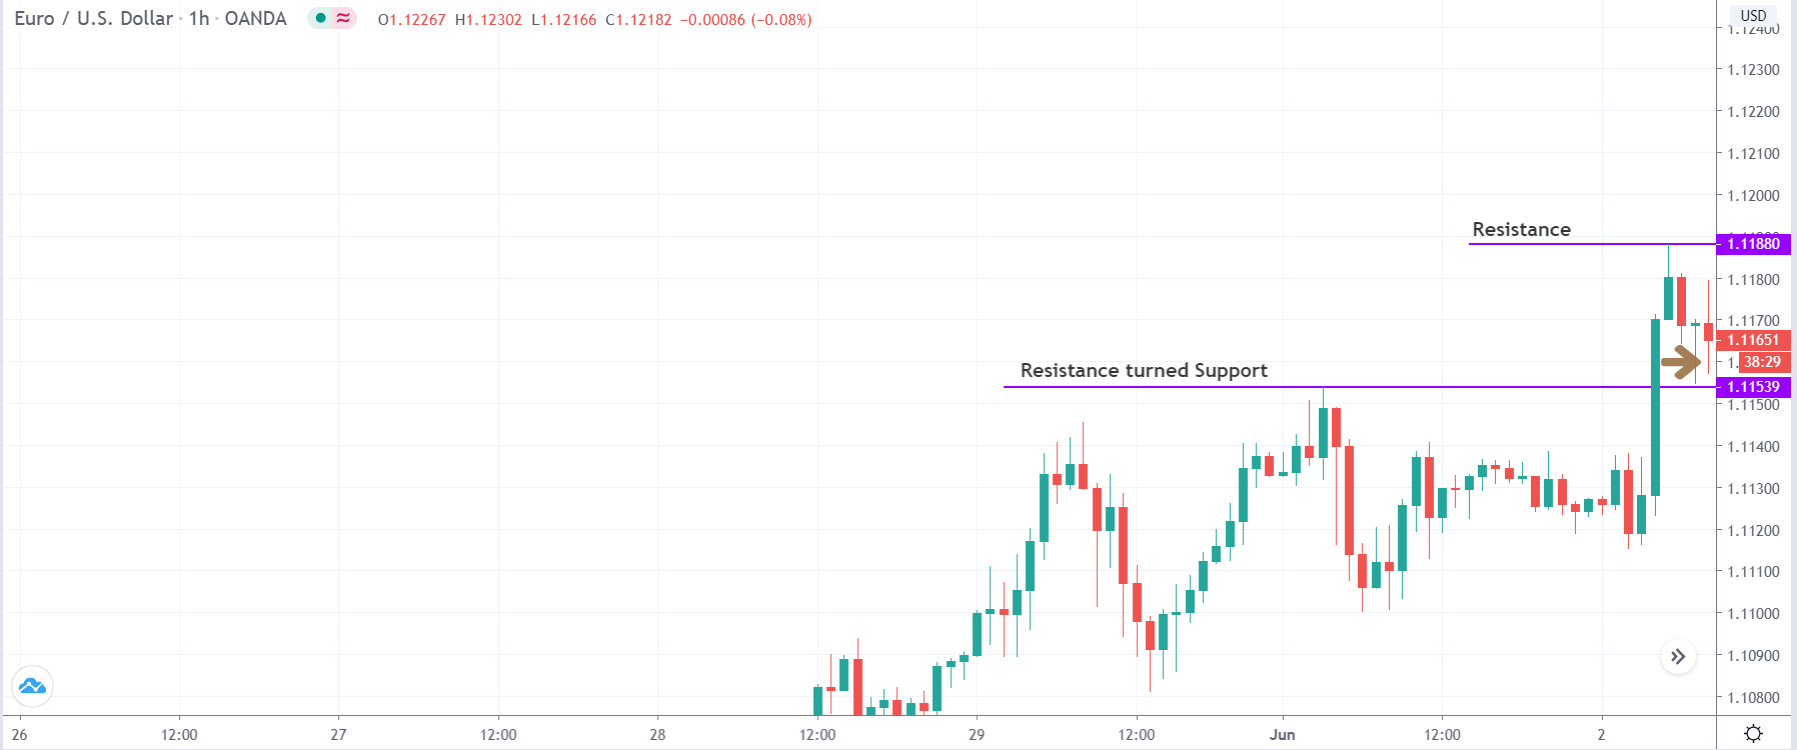
The next step is to wait for the price to bounce off from the support area by 10% of the range that is created between the two lines marked. In the above example, the arrow mark points at the 10% value of the range, as shown in the below image. We will be entering the market for a ‘buy’ exactly after this 10% bounce. The stop loss for this strategy is placed somewhere at a price where the resultant risk to reward is 1.
Step 3
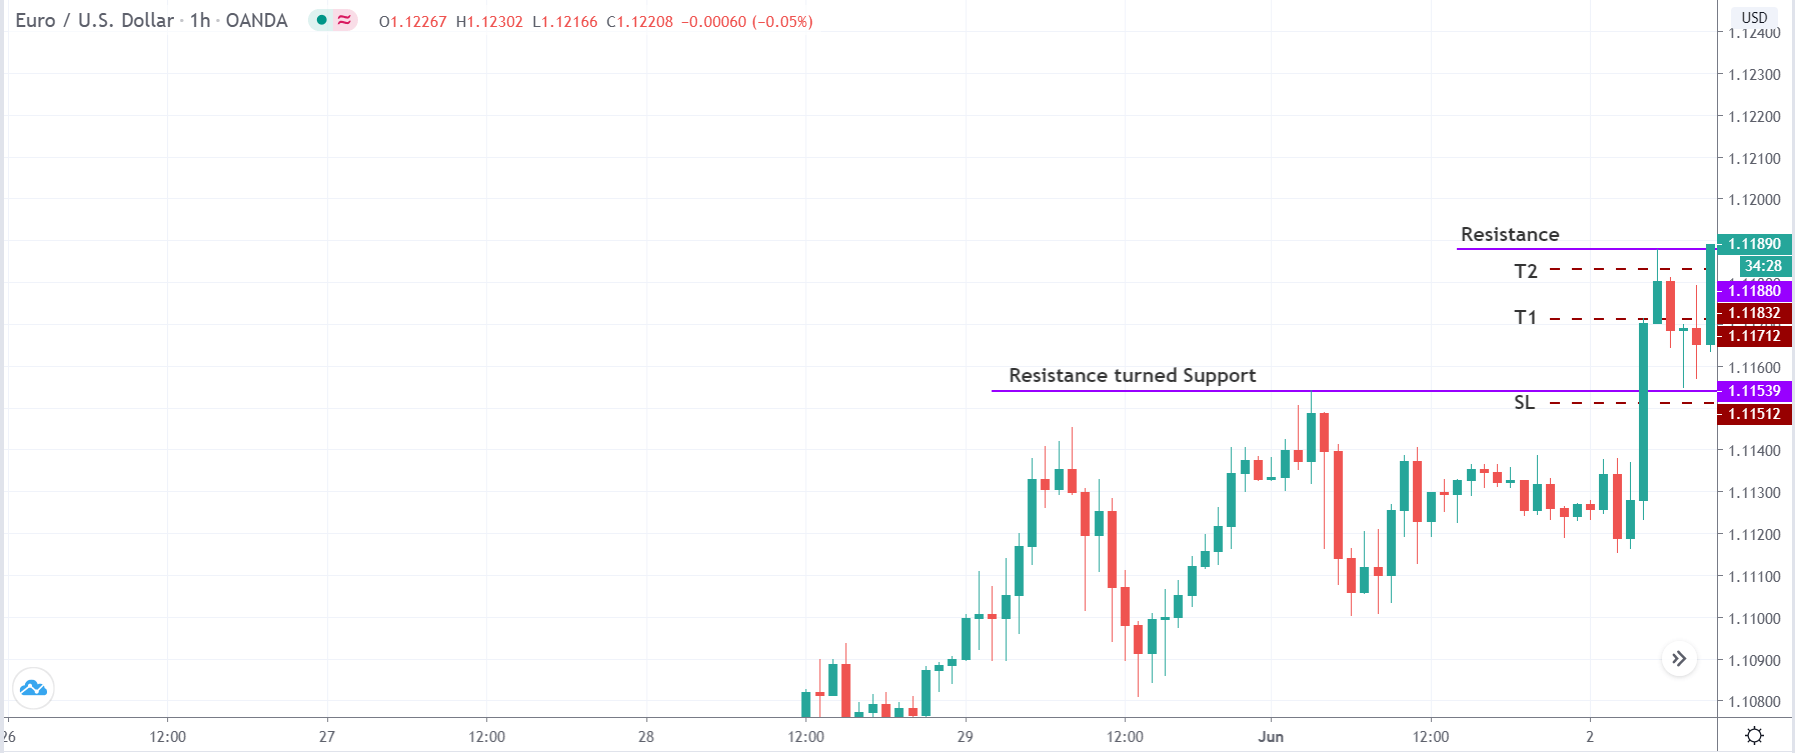
The best part of this strategy is that many emphases are put on trade management. In this step of the strategy, we remove 50% of our positions at the 50% mark of the range and 90% of the positions at the 90% mark of the range. In this, we ensure that even if the market reverses from the middle of the range and breaks below the support, we will still be profitable and would not any money even if the price hits our stop loss.
The points of the first and second targets are shown in the below figure, represented by brown dashed lines. One can also see the position of the Stop Loss marked by a brown dashed line.
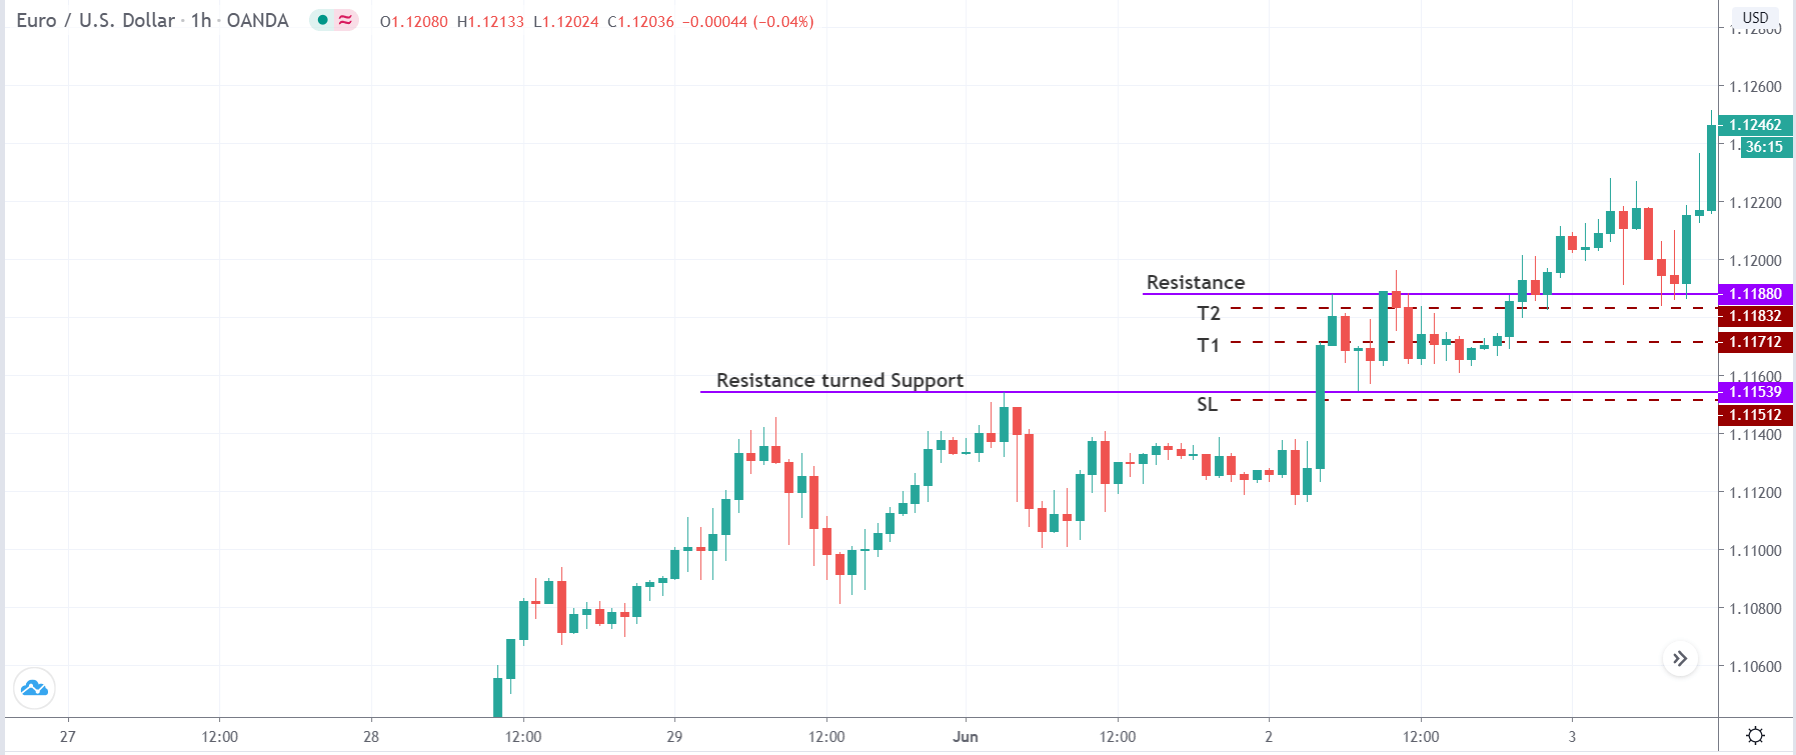
We can see in the image below that the market finally breaks out and continues its upward momentum. When critical levels of resistance turned support and support turned resistance are found in an uptrend and downtrend respectively, traders can wait for the market to make new ‘highs’ or ‘lows’ and then book their profits.
Strategy Roundup
This strategy is applicable as long as the market is swinging back and forth in the form of a range. However, the main requirement of the strategy is to find strong levels of resistance turned support in an uptrend (preferably) and support turned resistance in a downtrend (preferably). If the breakout or breakdown does not occur with strength, the strategy might not yield the desired result, or the trade might work just a little bit. Although it looks like trading simple support and resistance strategy, establishing key levels at the beginning of the strategy and application of trade management is what makes this strategy different from trading traditional support and resistance.
Point of Caution
Previously, we mentioned to look out for key levels in trending markets, but at the same time, one needs to be cautious while determining these levels. One needs to check if the market is overbought, in case of an uptrend, or oversold, in case of a downtrend. An indicator that can help us determine the overbought and oversold conditions of the market is the Stochastic indicator.