Categories
Forex Basic Strategies Forex Daily Topic

An Old Theory about Support/Resistance

In price action trading, traders rely on support/resistance a lot. Beginners often ask a question of whether they are predetermined. In answer to this, they are predetermined to some extent. A trader can guess level/levels that may work as support/resistance. The idea is simple. Support becomes resistance, and resistance becomes support. In today’s lesson, we are going to demonstrate an example of this.

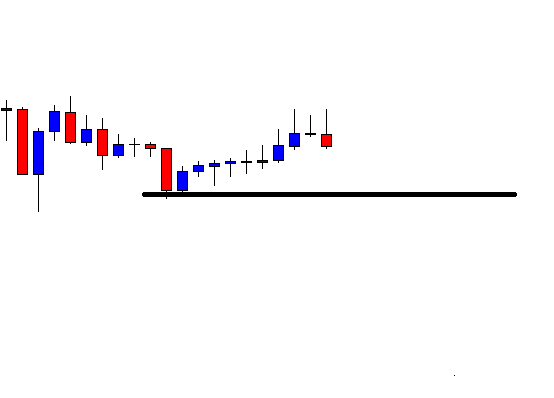
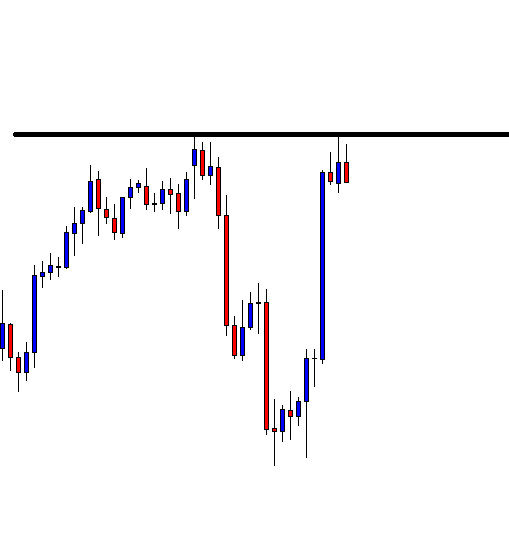
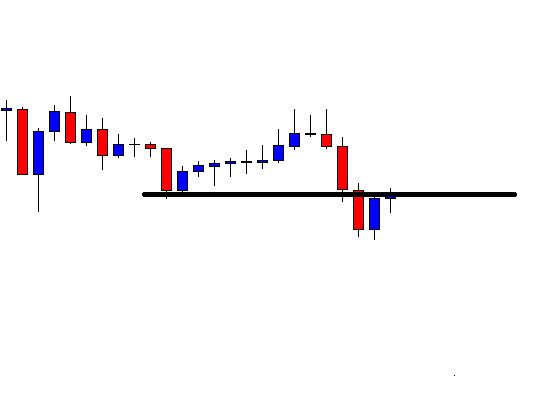
The price has a bounce at the drawn level and heads towards the North. The last candle comes out as a bearish engulfing candle. The price may head towards the South. If that happens, the sellers are to wait for a breakout at the drawn level. Let us proceed to find out what happens next.

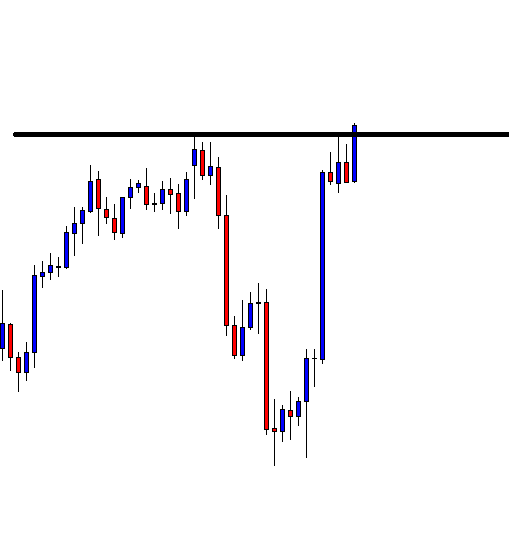
The next candle comes out as a bearish candle as well. However, it does not make a breakout. This is an interesting chart for both the buyers and the sellers. The buyers may wait to get a bullish reversal. Since this is the level where the price has bounce earlier, this may become double bottom support. On the contrary, if the price makes a bearish breakout at the drawn level, the sellers dominate in the pair.

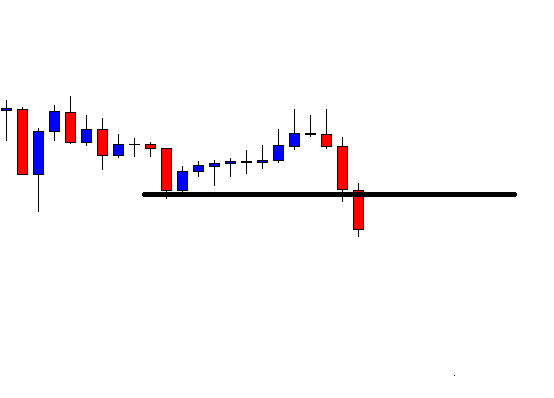
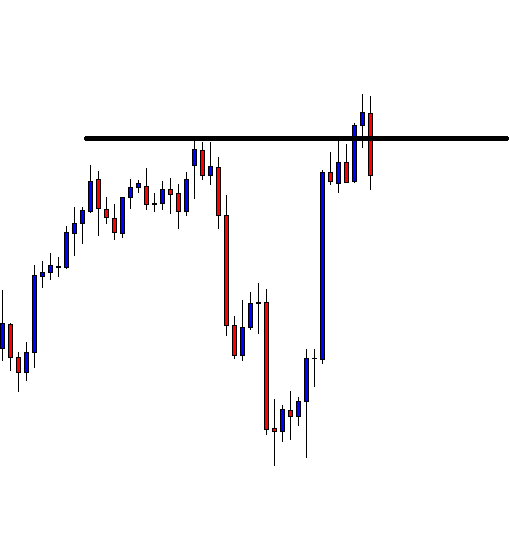
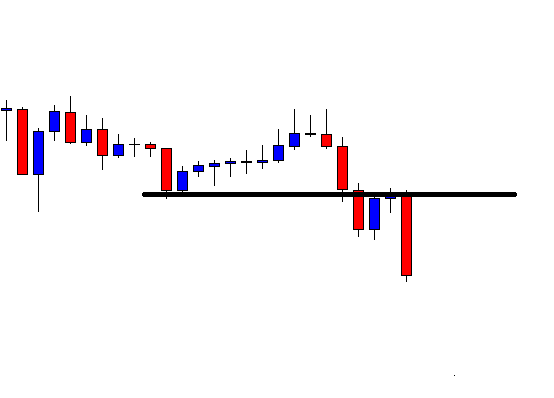
The bear wins. The last candle closes well below the drawn level. This is an explicit breakout. The sellers are to wait for the breakout confirmation. If the chart produces another bearish candle closing below the last candle, the price may find its next resistance at another significant level. In most cases, the price usually goes back and finds its resistance at the breakout level, which was the level of support earlier.

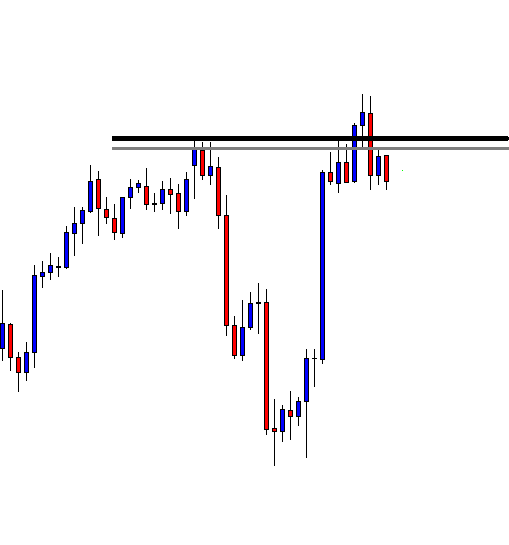
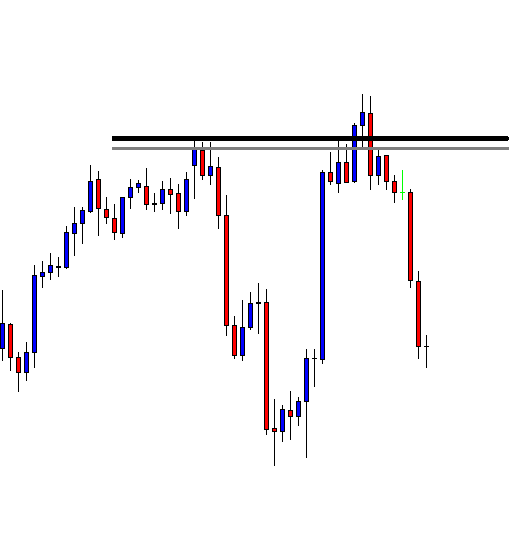
Look at the chart. The price goes back to the breakout level and creates a doji candle. Do you notice the doji candle is produced right at the drawn level? This means the level may drive the price towards the South by being the level of resistance.

The level produces a bearish engulfing candle closing below consolidation support (This may become resistance later as well). The last candle suggests that the price may head towards the South with good bearish momentum. The sellers have found the new resistance.

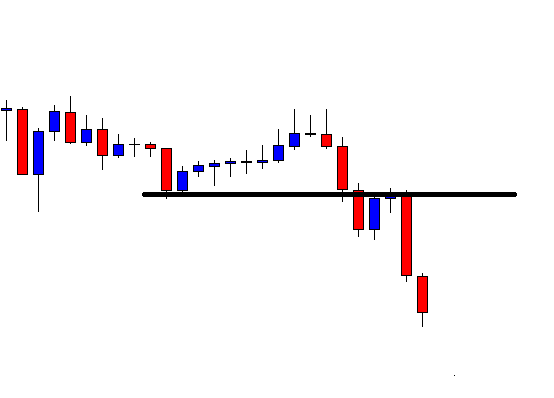
As expected, the price heads towards the South for one more candle. It usually happens when support/resistance produces an engulfing candle as a reversal candle. In the end, a level of support flips and becomes a level of resistance. If we closely observe, we find this is what happens almost every time. Support becomes resistance, and vice versa. By obeying the theory, experienced traders spot out the levels of support/resistance well ahead.

Categories
Forex Daily Topic Forex Price-Action Strategies

An Old Theory about Support/Resistance

Support and Resistance are the two extremely important components in financial trading. Price action traders rely on them as a critical component of their trading strategies.

Ideally, 90% of the indicators are able to reveal support and resistance levels. An ancient theory of support and resistance says that support becomes resistance and vice versa and interesting point is the theory still works nowadays as well as it did in the past. In today’s lesson, we are going to demonstrate an example of this long-used theory.

In the above figure, the price heads towards the North with good bullish momentum. It pauses at a level of resistance, where the price had a rejection earlier. The equation is simple here. If the price produces a bearish momentum and makes a breakout at the last swing low, the sellers are going to look for short opportunities. In case of an upside breakout, it remains buyers’ territory.

A bullish engulfing candle breaches the resistance. If the price confirms the breakout, the buyers keep dominating here. It seems that the sellers do not have any reasons to be optimistic soon.

The breakout level holds the next candle, as well. This move is a confirmed breakout. However, the buyers are to wait for price consolidation, which gives them a level of support to set stop loss and an upside breakout to trigger an entry.

Oh! No, a bearish Marubozu candle comes back in. All of a sudden, things look a bit different here. The buyers and the sellers both have chances. Let us find out what the price does next.

The price confirms the bearish breakout with an Inside Bar. Look at the last candle on the chart – a bearish engulfing candle forms at the resistance zone. The sellers may flip over to the H1 chart to take a short entry since it is an H4 chart.

The price takes some time to get bearish. It may have been consolidating on the H1 chart for several hours. However, it does get bearish in the end — the price heads towards the South with extreme bearish momentum. The last candle comes out as a Doji candle, which may make some sellers think about taking an exit. However, the way it has been heading towards the downside, most likely it may go towards the last swing low.

The Bottom Line

There are so many strategies, indicators, EAs in the market. It would be tough to suggest if you ask me which one works best. Then again, if I am asked to choose just one strategy, my choice would be “Sell at flipped over resistance; buy at flipped support.”