Categories
Forex Basic Strategies Forex Daily Topic

Trade Ranges Like A Pro with this Effective Forex Trading Strategy

Introduction

The market does not move in random directions. It either trends or consolidates. As many would not know, the market is like a closed circle, and the same states keep repeating over and over again. Thus, in trading, one must learn how to become pro at reading these market states.

On that same note, we shall be going over an effective strategy when the market is in a consolidation/ranging state. However, before jumping right into the strategy, it is important to understand the basics and related concepts.

What is a consolidation phase in a market?

There are several ways to comprehend the consolidation phase of the market. There is logical reasoning behind the occurrence of this state, and is not simply a random pattern that shows up quite often.

The consolidation state is that phase of the market when the market moves in a sideways direction. This state is also referred to as a range. The reason for its occurrence is related to the strength between bulls and bears.

Comprehending a Range

There are two parties in the market – the bulls and the bears. Their strength is what describes the state of the market. In a trending market, either of the parties is powerful. For instance, if the market is going up, it simply means that the bulls control the market. In a consolidation state, both bulls and bears show equal strength. The bulls show strength by pushing the market higher, while the bears show power by taking the price right back down. As a result, the prices in both directions – which we refer to as a range.

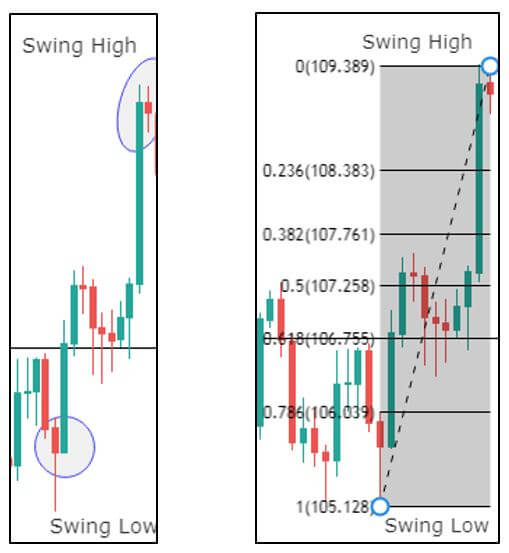
How to draw a range?

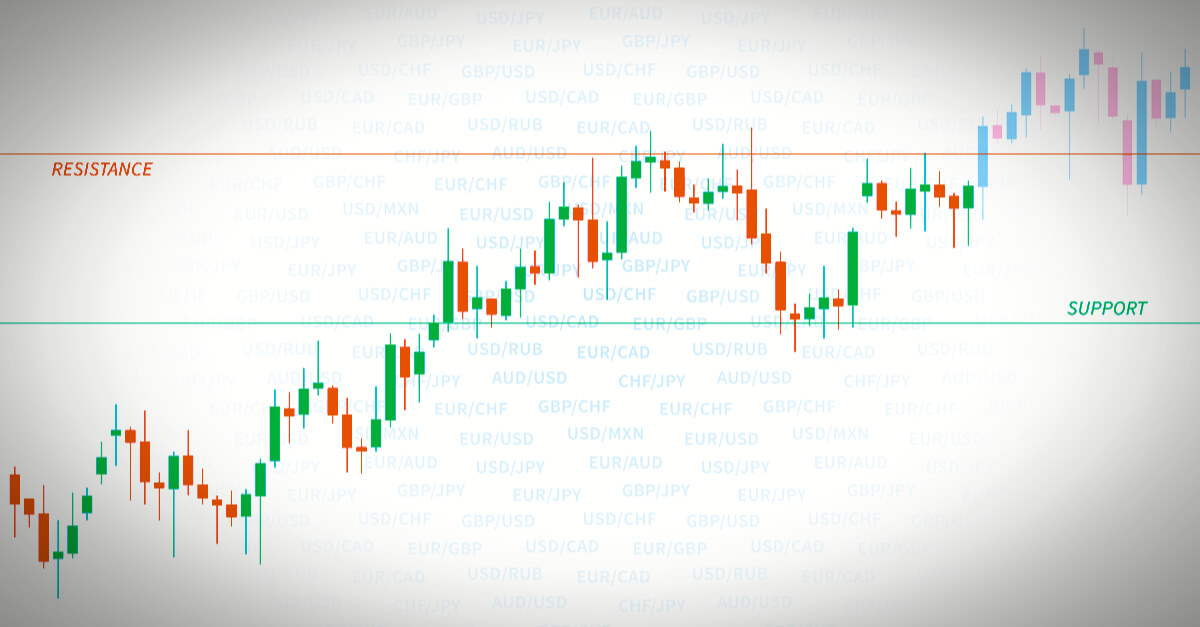
To trade this range strategy, it is vital to understand how a range is drawn. A range is made up of two levels:

  • Support
  • Resistance

Thus, drawing the correct support and resistance levels will result in a perfect range.

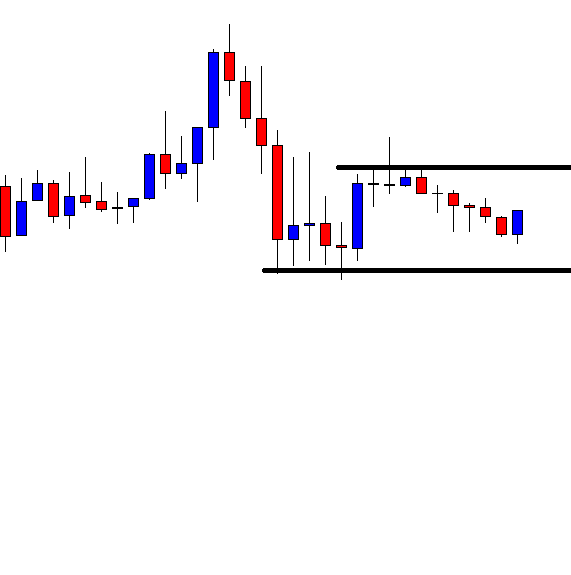
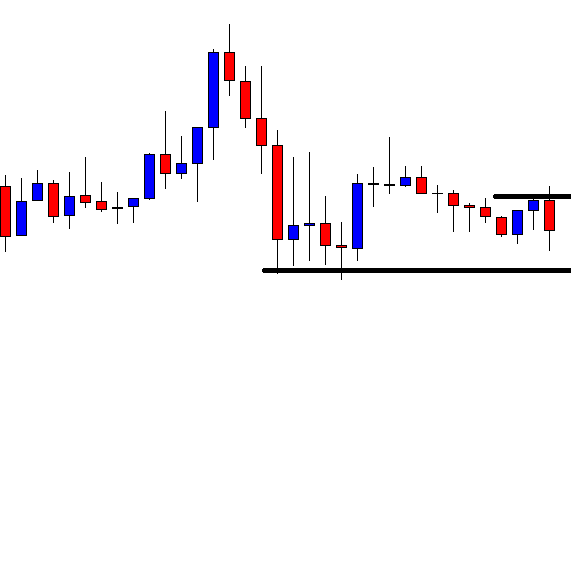
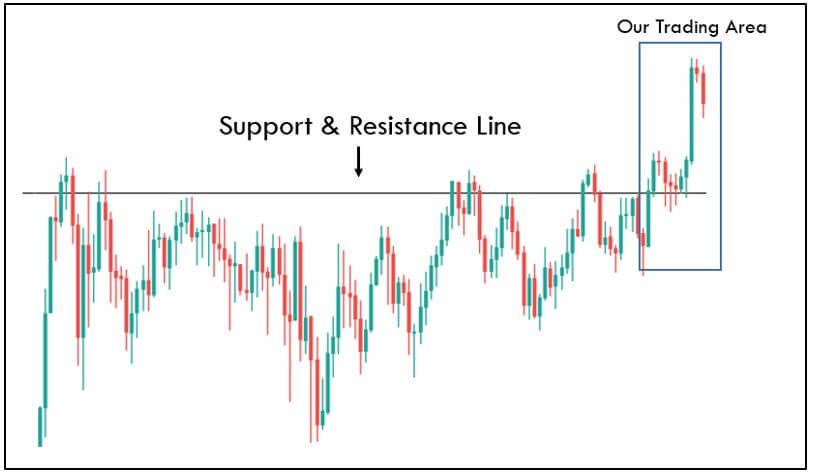
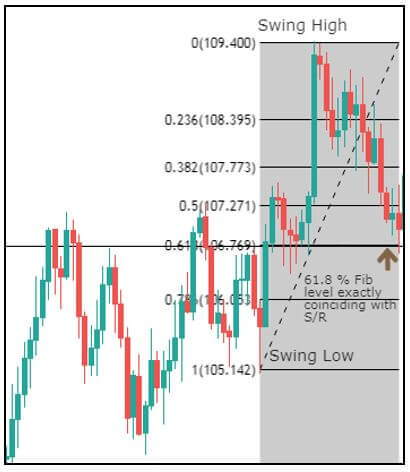
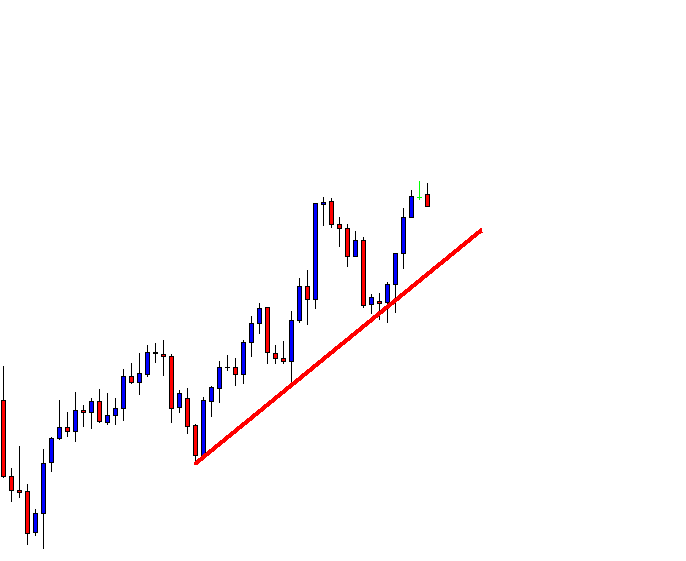
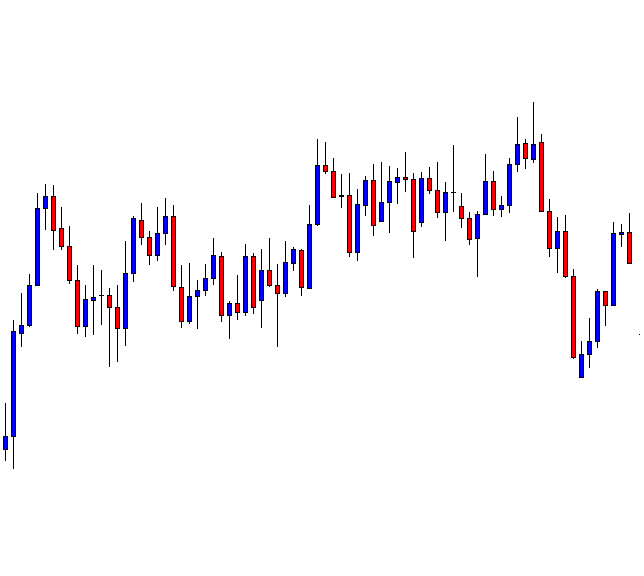
Another point considered is the size of the range. The larger the range, the better. The other small consolidations in the market are ignored. Following is an example of how we pick an ideal range.

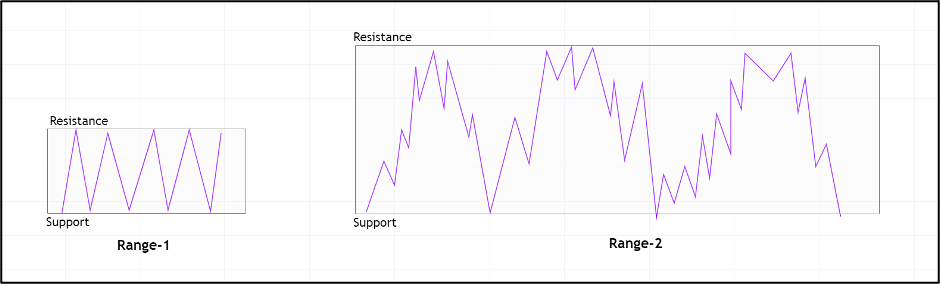
In the above example, both are ranges as the market is moving in a sideways direction. However, we do not consider range-1 as a range for our strategy. This is because a single line going up and down fails to depict the market’s price action.

Supply and Demand Range Strategy

What is the usual approach to trading a range? It is to buy at the support and sell at the resistance. But we’re going to step the game a little bit. The supply and demand range strategy uses the same principles of a typical range, in addition to other factors.

Step by step procedure to trade the Supply and Demand Range Strategy:

  1. Find a legitimate range in the market. Mark the Support and Resistance levels appropriately.
  2. Determine the direction of the market prior to the range.
  3. Find a potential supply/demand level.
  4. Get in when the market breaks through the range and reaches the supply/demand zone.

Buy Example

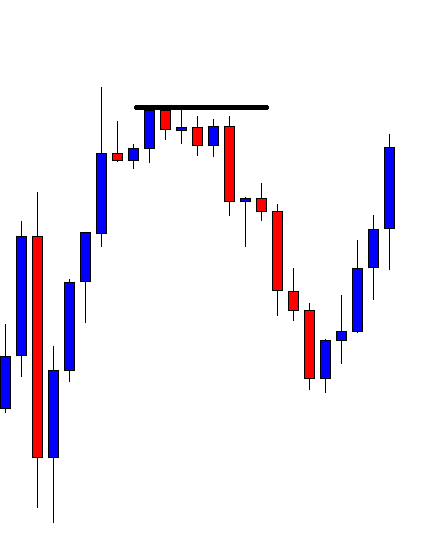
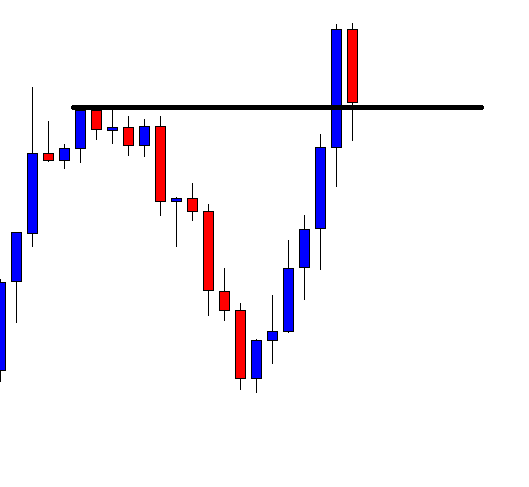
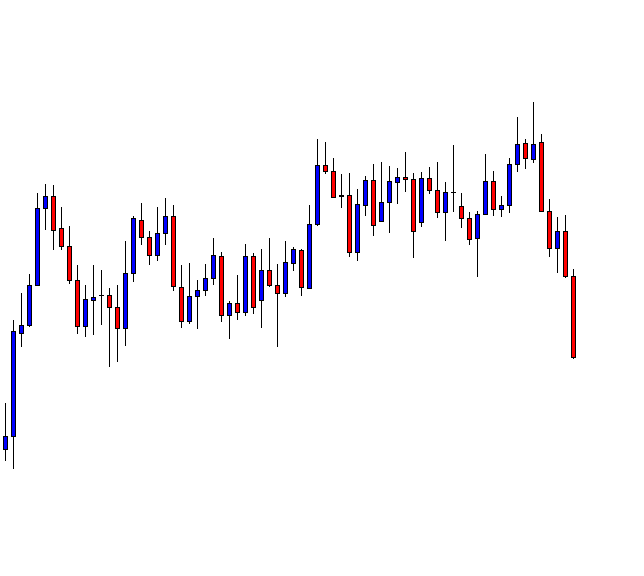
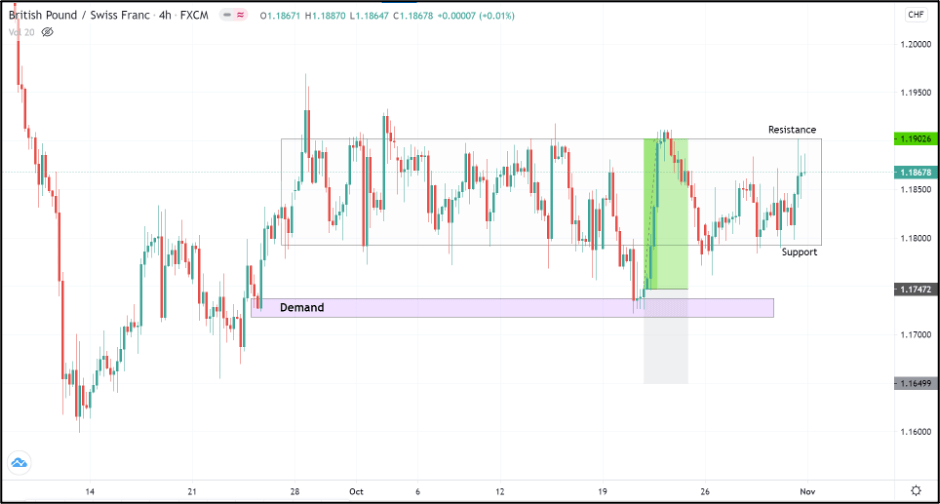
Consider the below chart of GBPCHF on the 4H timeframe. We see that the market has been ranging between 1.1902 and 1.1800. Observe that the support and resistance levels have been marked by cutting off the false market breakouts.

To trade this market, our job is not simply to hit the buy at the support and sell at the resistance. As mentioned, we take into account the preceding direction and the supply and demand levels around it.

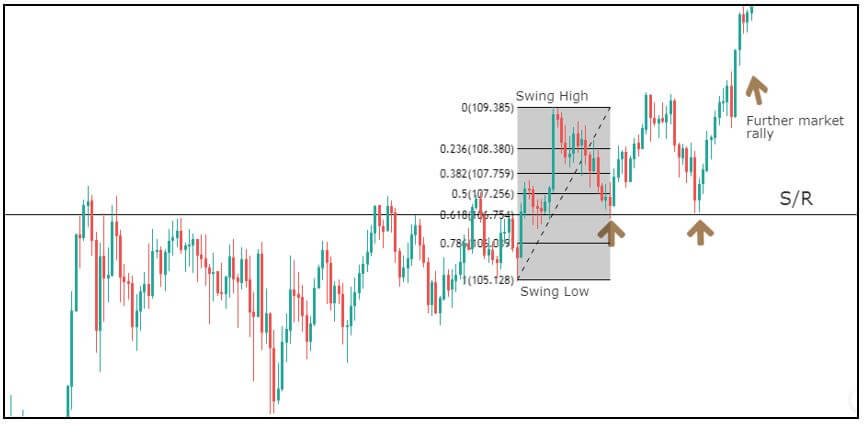
The direction of the market prior to the range was an upside, indicating that the bulls were in control previously. A point to note is that, despite the market being in a range, it does not change the fact that the bulls are still powerful. Thus, we rather look for buying opportunities than shorting signals.

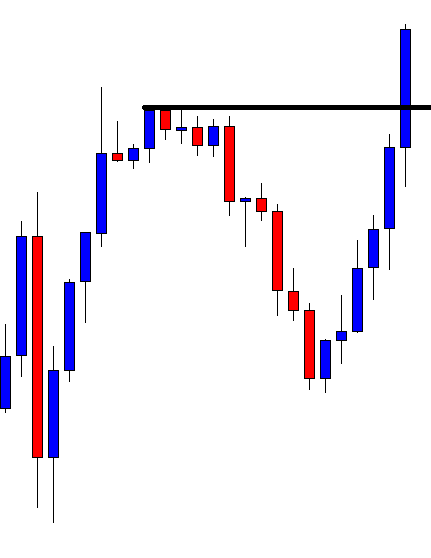
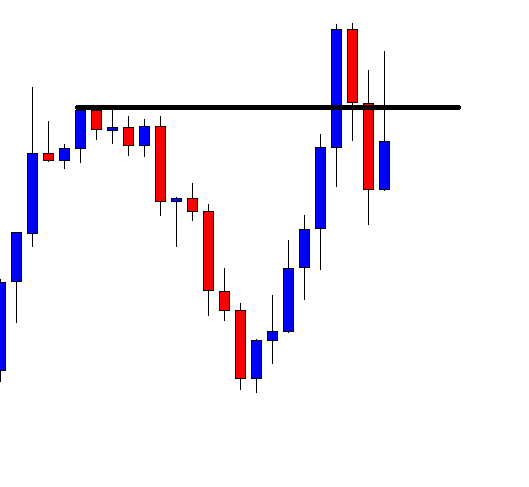
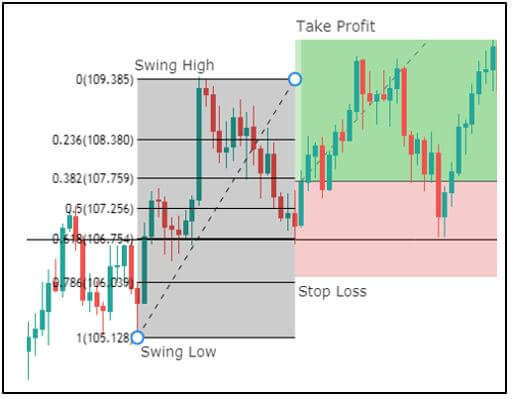
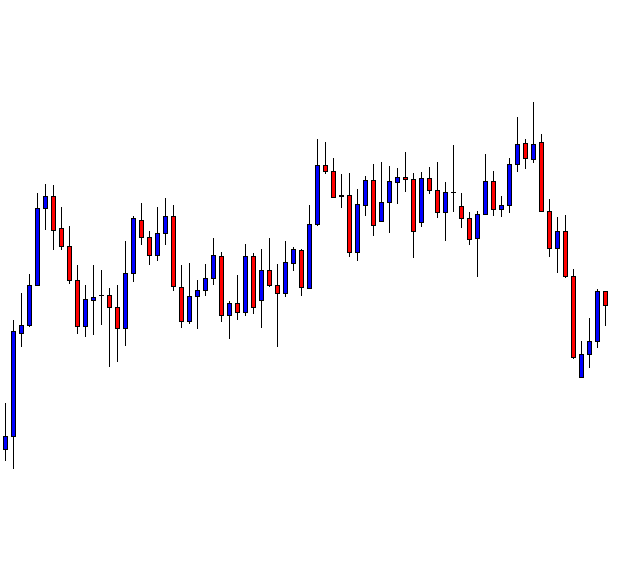
To do so, we wait for the price to drop below the bottom of the range and hold at any one of the demand zones. Once the market begins to reverse its direction from south to north around the demand zone, we can go long. The same scenario has been illustrated in the chart below.

Placements

Stop Loss – Well below the demand zone would be decent.

Take Profit – Top of the range would be an ideal spot to take profits.

Sell Example

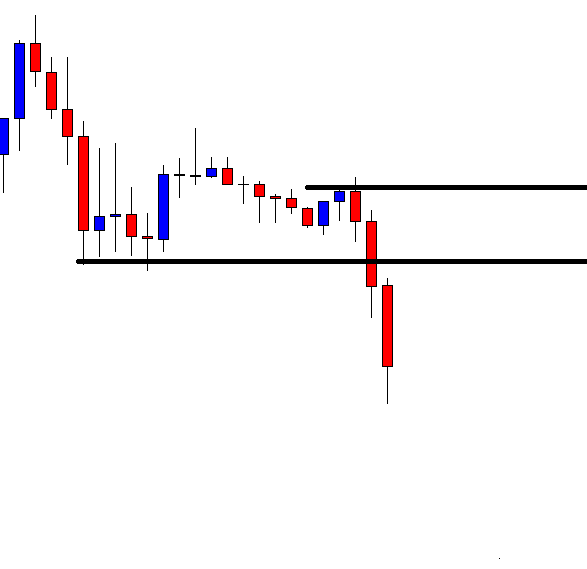
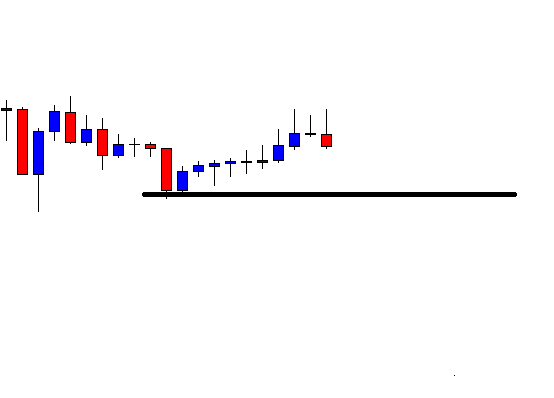
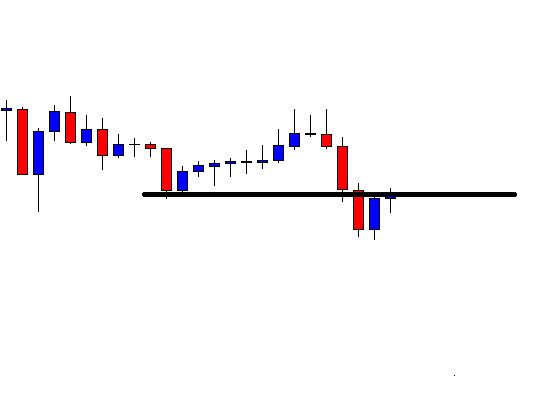
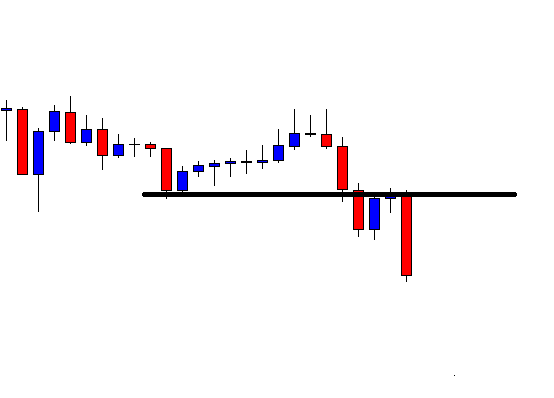
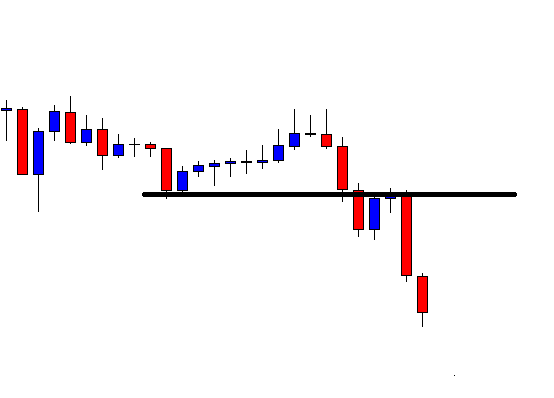
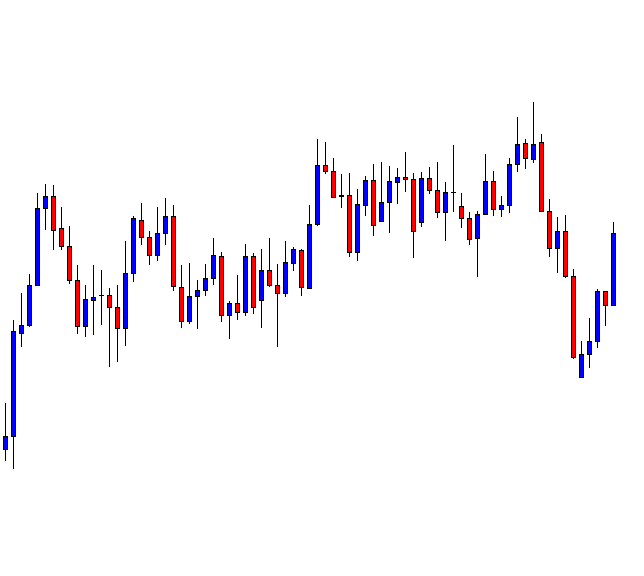
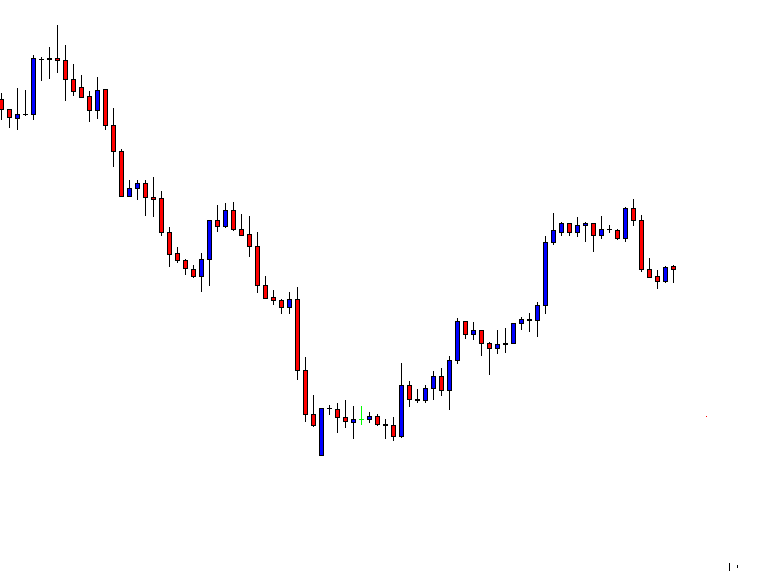
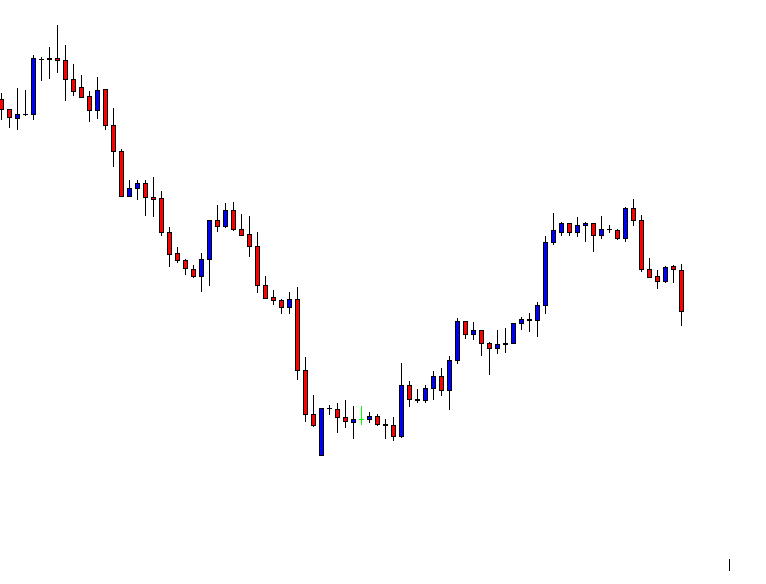
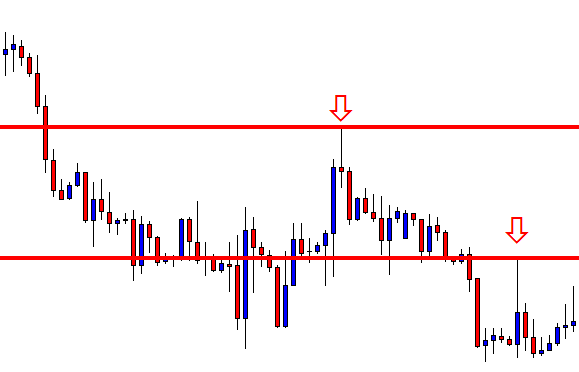
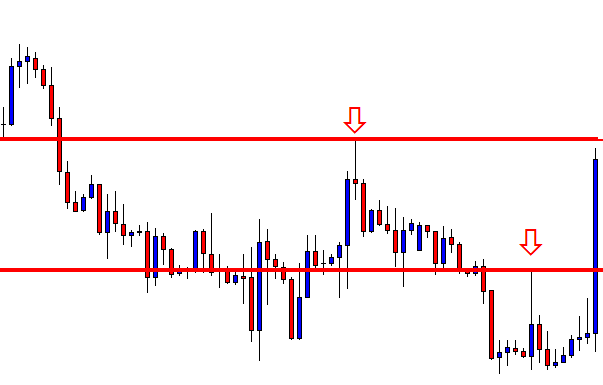
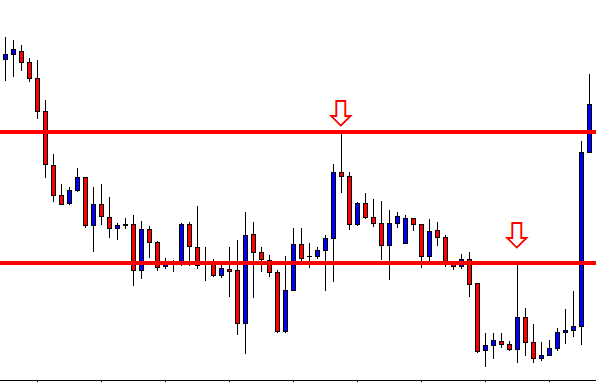
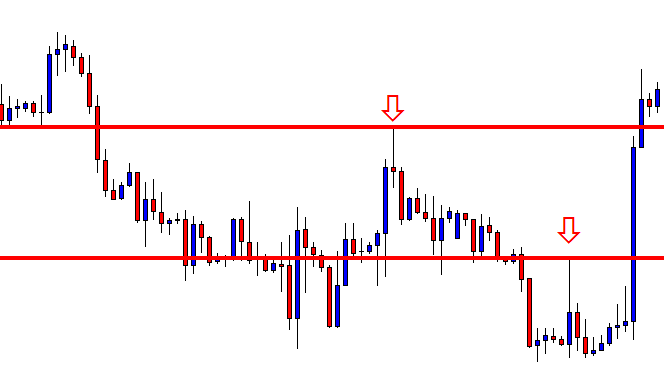
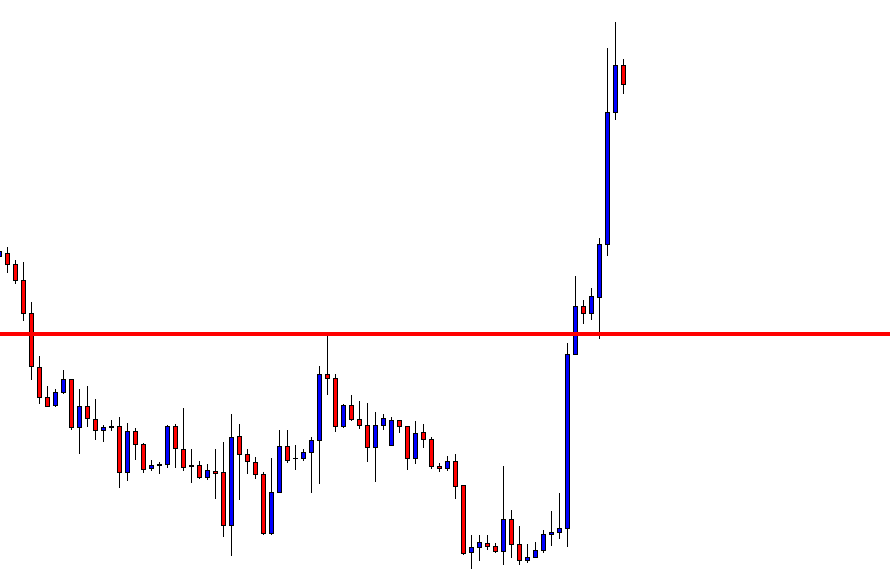
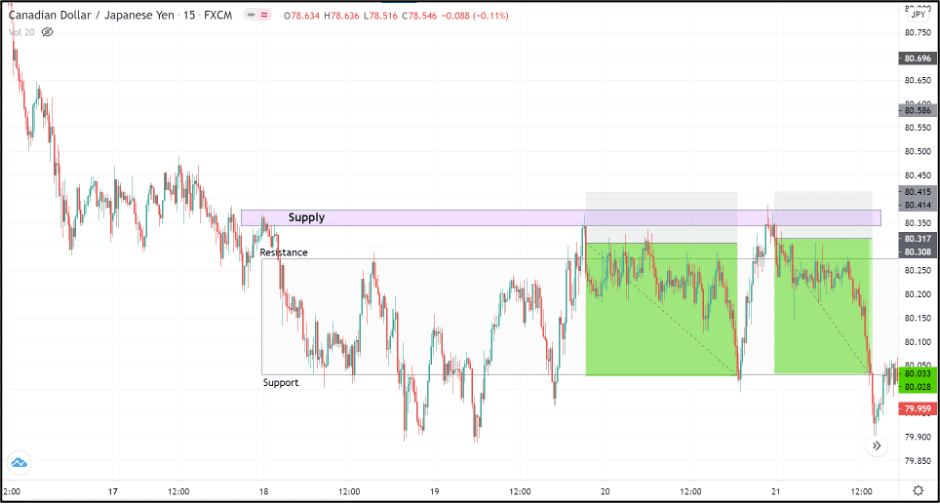
Consider the chart of CAD/JPY on the 15min timeframe shown below. The recent market price action depicts that the market is moving sideways. The market’s overall trend is down, indicating that the bears are in control of the market.

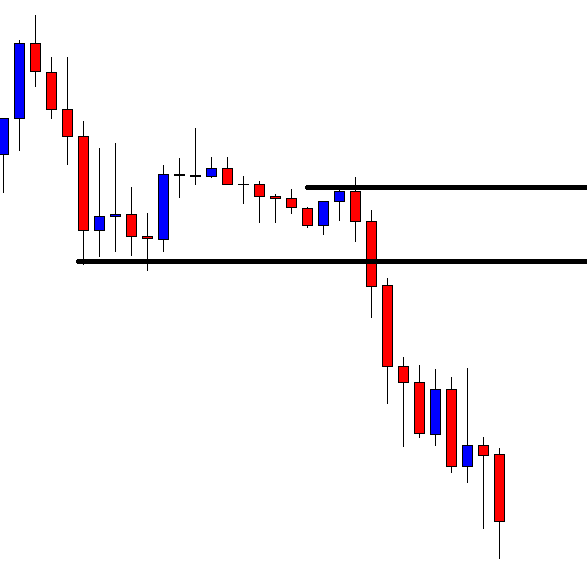
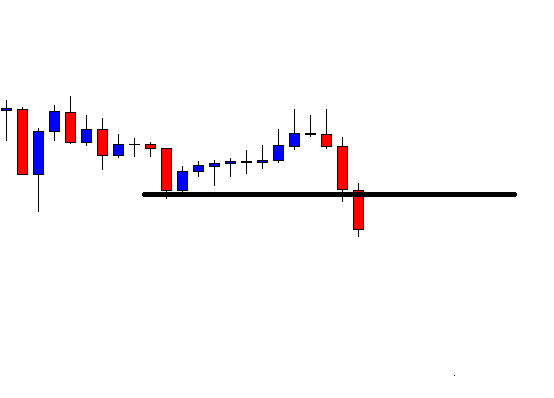
Since the scenario is opposite to the previous example, we wait for the market to break through the resistance and reach any potential supply level. In the below example, we can see that the price broke through the resistance twice reacted off from the supply, as shown. Thus, we can look for entries when the market begins to switch direction to the downside.

Placements

Stop Loss – Above the supply zone

Take Profit – Bottom of the range

Conclusion

The only way to trade a range is not by buying and selling from the top and bottom of the range. It can be professionally traded with the application of other factors. And this range strategy particularly dealt with the strength of the bulls and bears and the concept of supply/demand.

We hope you were able to comprehend our Supply and Demand Range strategy. Do test them out for yourself and let us know your results in the comments below. Happy trading!

Categories
Forex Course

128. Interpreting Regular Divergence

What is Regular Divergence?

Markets move in trend, channels, and ranges. For any market to undergo a change in the direction, it must happen as a transition. For example, a market that has to transit from an uptrend to a downtrend, it has to go from an uptrend to a channel, to a range, and then begin the downtrend. That is, at one point in time, the market does not hold at support & resistance, and stops making higher highs. And this market reversal is indicated by the regular divergence.

Types of Regular Divergence

There are two types of regular divergence:

  • Regular Bullish Divergence
  • Regular Bearish Divergence

Let’s understand each of them with the help of live charts

Regular Bullish Divergence

This type of divergence is used to give a bullish signal in the market. When the market is in a downtrend, making lower lows and lower highs, the oscillator follows the same path. At one point, the price chat makes a lower low, but the oscillator makes a lower high. The oscillator does the opposite of what the price did. And this referred to as bullish divergence. Here is an example of the same.

In the above chart of EUR/AUD, reading the market from the left, we see that it was in a downtrend. As the prices were making lower lows, the indicator followed the same. But later, when it made another lower low, the MACD made a higher low, indicating divergence in the market. When it left higher low, we see that the price did not make any lower low from the S&R level. And finally, the market reversed and began to move north.

Regular Bearish Divergence

Regular bearish divergence is used to forecast bearishness in the market. In an uptrend, the market makes higher highs and higher lows. The oscillator indicators follow the same trajectory as well. But, if the price makes a higher high and oscillator does the opposite (lower high), then it is referred to as a bearish divergence. It is an indication that something is not right with the uptrend, and there are possibilities of a trend reversal.

In the above chart of AUD/CAD, we see that the market made a higher high, and the MACD indicator made a higher high as well, indicating that the uptrend is still intact. But the second time when the market made a higher high, the indicator put a lower high—indicating that there is something wrong with the uptrend and could be a possible reversal. In hindsight, we infer that the market failed to make higher highs and then reversed.

Note that divergence provides an indication that there could be a possible reversal in the market. It does not give a signal to buy or sell. The reversal must be solely based on your strategy. Divergence is only used to confirm the strategy and increase odds in your favor.

[wp_quiz id=”77668″]
Categories
Forex Price-Action Strategies

When Price Finds New Support/Resistance

Price action traders are to be calculative and watchful. Breakout and breakout confirmation are two things that price action traders keep eyes on. Trend initiating candle is another important factor. We often see that the price upon finding its support/resistance does not make a breakout straightway. It sometimes makes a little correction and then starts trending to make a breakout. This new level of support/resistance plays a significant role in price action breakout trading. In today’s lesson, we are going to demonstrate an example of this.

The chart shows that the price after being bearish makes a bullish correction. It produces a bearish engulfing candle and drives the price towards the downside. However, look at the last candle. It comes out as a bullish engulfing candle. This means the price is to find its resistance again.

It does not take long to find its resistance. The next candle comes out as a bearish engulfing candle. The sellers are to keep their eyes on the pair to get a breakout. It seems that the price may head towards the South and make a breakout this time upon finding its new resistance.

The chart makes the breakout by the next candle. The sellers are to wait for the next candle to close below the breakout candle to trigger a short entry. Do not forget that it makes the breakout upon finding a new resistance.

The next candle comes out as a bearish candle having a long lower shadow. Thus, they should flip over to the 15 M chart to see how the last 15 M candle comes out. Despite having a long lower shadow, the last 15M candle comes out as a bearish candle too. The sellers may trigger a short entry right after the last candle closes. Stop Loss is to be set above the last resistance and Take Profit is to be set with 1R. This is why the new level of support/resistance plays a significant role.

The price heads towards the South but not with strong bearish momentum. It hits 1R though. The distance between new resistance to entry point= Entry point to Take Profit= 1R.

Whenever the price finds its new resistance/breakout, breakout traders must count those to set their stop loss and take profit level. Breakout trading needs the price to make a breakout with good momentum. If it takes any pauses before making a breakout, ignore the last support/resistance. It gives us better risk-reward as well as more chance of winning a trade.

Categories
Forex Basic Strategies Forex Daily Topic

Significance of Breakout Confirmation or Reversal at Pullback

Breakout trading is one of the most widely used trading strategies in the Forex market. Breakout confirmation is equally important. Without breakout confirmation, a breakout may not work in favor of the traders in many cases. Thus, if we want to have a tremendous rate of winning, we may wait for breakout confirmation or reversal at pullback before taking entry. In today’s lesson, we are going to demonstrate an example of this.

The price after being rejected at a resistance level heads towards the South. It produces a bullish inside bar and heads towards the North again. The momentum suggests that the price may make a breakout at the level of resistance. Breakout traders are to keep an eye on the pair to get a breakout followed by breakout confirmation or reversal candle at the pullback to go long on the pair.

The last candle breaches through the level of resistance. Candle’s attributes suggest that this is an ideal breakout candle. The candle barley has the upper shadow. The breakout traders are to wait for either for the next candle to close above the breakout candle or the price to come back at the breakout level to consolidate and produce a bullish reversal candle to offer them a long entry.

The price does not head towards the North. It comes back at the breakout level closing within the breakout level. The breakout is still valid. However, the buyers must wait to get a bullish engulfing candle to close above consolidation resistance to trigger a long entry by setting stop loss below the breakout level. Let us proceed to the next chart to find out what happens next.

The price breaches the level of support and closes well below the breakout level. The sellers may take control soon in the pair. Traders taking a long entry right after the breakout candle closing are to have a loss here. If they set stop loss below the lowest low, the risk-reward would not be lucrative. When the price breaches a breakout level, it usually generates more momentum and changes its trend. Let us see what happens here.

The price goes back to the breakout level. This time it makes a bullish correction. The equation changes completely another way round. If the chart produces a bearish engulfing candle closing below consolidation support, the sellers may go short and drive the price towards the lowest low.

The chart produces a bearish engulfing candle followed by another strong bearish candle. It looks like a different ball game completely now. It is now the sellers’ territory.

In the bullish market, the chart does not produce a bullish reversal candle; thus, the price gets bearish. In the bearish market, it produces a bearish reversal candle (engulfing) and offers entry to the sellers. By taking entry upon breakout confirmation, we may not find as many entries as we would like, but it gets us more consistency in winning trades.

Categories
Forex Basic Strategies Forex Daily Topic

An Old Theory about Support/Resistance

In price action trading, traders rely on support/resistance a lot. Beginners often ask a question of whether they are predetermined. In answer to this, they are predetermined to some extent. A trader can guess level/levels that may work as support/resistance. The idea is simple. Support becomes resistance, and resistance becomes support. In today’s lesson, we are going to demonstrate an example of this.

The price has a bounce at the drawn level and heads towards the North. The last candle comes out as a bearish engulfing candle. The price may head towards the South. If that happens, the sellers are to wait for a breakout at the drawn level. Let us proceed to find out what happens next.

The next candle comes out as a bearish candle as well. However, it does not make a breakout. This is an interesting chart for both the buyers and the sellers. The buyers may wait to get a bullish reversal. Since this is the level where the price has bounce earlier, this may become double bottom support. On the contrary, if the price makes a bearish breakout at the drawn level, the sellers dominate in the pair.

The bear wins. The last candle closes well below the drawn level. This is an explicit breakout. The sellers are to wait for the breakout confirmation. If the chart produces another bearish candle closing below the last candle, the price may find its next resistance at another significant level. In most cases, the price usually goes back and finds its resistance at the breakout level, which was the level of support earlier.

Look at the chart. The price goes back to the breakout level and creates a doji candle. Do you notice the doji candle is produced right at the drawn level? This means the level may drive the price towards the South by being the level of resistance.

The level produces a bearish engulfing candle closing below consolidation support (This may become resistance later as well). The last candle suggests that the price may head towards the South with good bearish momentum. The sellers have found the new resistance.

As expected, the price heads towards the South for one more candle. It usually happens when support/resistance produces an engulfing candle as a reversal candle. In the end, a level of support flips and becomes a level of resistance. If we closely observe, we find this is what happens almost every time. Support becomes resistance, and vice versa. By obeying the theory, experienced traders spot out the levels of support/resistance well ahead.

Categories
Forex Course

64. Trading Support & Resistance Levels Using Fibonacci Levels

Introduction

In the previous lessons, we understood how to use the Fibonacci tool to trade the pullback of a trend. We have also learnt how these Fib levels are not foolproof. Now, in this lesson, let’s extend this discussion to see how the Fibonacci tool can be used in conjunction with Support and Resistance – arguably the most critical levels on a price chart.

Support is the area where the price rejects to go down and bounce back further. This area acts as a floor where the price gets stopped. Resistance is the opposite of Support. At this level, the price finds it very hard to go up as it acts as a ceiling. The general idea is to buy at the Support and sell at Resistance. But blindly buying and selling at these levels carry huge risk as there is no guarantee that these levels will work each time.

So let’s use Fibonacci levels to determine the working of these S&R levels. Basically, we are combining both Support Resistance and Fib levels to increase the accuracy of trading signals generated. Let’s get started.

In the below chart, we have identified a strong resistance area, and now we must wait to see if it creates an area of Support after breaching the Resistance. It is always advisable to buy at ‘resistance turned support.’ Also, if the price has broken a strong resistance with multiple touches, there is a higher chance of it turning into Support. At the marked region below, we can see the price breaking the strong resistance area.

In the marked regions below, we can see the price retracing after breaking the Resistance. So in order to combine this support resistance level with Fib levels, we must identify the swing low and a swing high. As we can see below, we have also plotted the Fibonacci levels on the chart using a Fib indicator.

Ideally, if we get a retracement at the 61.8% Fib level and a confirmation candle, we can confidently enter for a buy. If the market does not react at any of the Fib levels, this could be a sign that the Support is no longer strong, and it can be broken.

As per the theory of Support and Resistance, the market must react at the previous Resistance and bounce off. From the below chart, it is clear that the retracement has reached our S/R line, which is exactly coinciding with the 61.8 Fib level. Now it is a clear indication for us to go long once we see a confirmation candle.

In the below chart, we can see that the price has exactly bounced off from the 61.8% Fib level and printed a bullish candle giving us a confirmation sign. Right after the confirmation candle, we can place our buy trade with a stop-loss at 78.6% Fib level and take-profit anywhere near the high.

Further, in the below chart, we can see the market making higher highs breaking the previous resistance levels. From this trade, we learn that, when Fibonacci is used near S/R as a confirmation tool, it increases the odds of that level performing. The price will surely take Support at the Fib levels and continue its trend.

One can notice that the ‘buy’ happens precisely at the 61.8% Fib level near Resistance turned support line. The market continues to take Support at this level until, eventually, it breakouts on the upside. This shows the power of the Fibonacci indicator when combined with S&R levels.

There are many other credible indicators that are reliable and can be combined with S&R levels. But Fibonacci is one of the most used ones by the traders across the world.

[wp_quiz id=”64461″]
Categories
Forex Basic Strategies

Is Drawing One Trendline Enough?

The Trendline is an excellent trading tool that the price action traders love using on their charts. Drawing trendline as accurate as it can get and adjustment with spikes are two factors that traders are to look after before using trendline. Another factor trendline traders often need to do is drawing multiple trendlines on the same chart. In this lesson, we are going to demonstrate an example of that.

The chart shows that the price after finding its support at the trendline heads towards the North and makes a new highest high. Thus, this is a valid trendline. Ideally, the buyers are to wait for the price to come back to the trendline again and to produce a bullish reversal candle to go long on the pair. Let us proceed to find out what happens next.

The price does not come at the trendline. It finds its support well above the trendline and heads towards the North again. This is annoying, is not it? Do not get annoyed. Concentrate on the chart. Do you see anything interesting? Have a look at the next chart.

We can draw another trendline on the same chart since the price has a bounce and makes a new highest high. Traders are to wait again for the price to come back at the trendline and to produce a bullish reversal candle to offer them a long entry.

Wow, this time, the price comes at the trendline and produces a bullish reversal candle. Traders have been waiting for such price action. By flipping over to the next chart and an upside breakout, traders may grab some green pips.

The chart shows that the price comes back near the trendline’s support again, then heads towards the North. It consolidates hard on the minor charts, as it seems. The point here is that the price does not come at the first drawn trendline or produces a bullish reversal candle. It comes at the second drawn line, and this time, it creates the bullish reversal candle right at the trendline’s support. It heads towards the North and may have offered entry as well.

The Bottom Line

In most cases, the price does not come at the first drawn trendline. It has the tendency to come at the second drawn trendline more. It is often seen that the price obeys the third drawn trendline as well. Thus, if we are to trade on the trendline, we may keep an eye on the chart to draw a trendline as many times as we need to.

Categories
Forex Price-Action Strategies

An Engulfing Candle at a Flipped Resistance

An Engulfing candle is a strong bearish reversal candlestick. This makes traders look for trading opportunities. In today’s lesson, we are going to demonstrate an example of how an Engulfing candle creates an entry. Let us proceed.

This is a daily chart. The price heads towards the downside with good bearish momentum. Traders shall wait for the price to have consolidation or an upside correction followed by a bearish reversal candle or pattern.

The price starts having the correction. It produces a bearish reversal candle after three consecutive bullish candles. The bearish reversal candle is an Inside Bar. This is not a strong bearish reversal candle. However, we still may flip over to the H4 chart (this is a daily chart) and wait for an entry.  The H4 chart does not produce any bearish momentum. Thus, the price goes towards the upside instead. Have a look at the chart below.

This is one strong bullish candle. However, the candle closed within the level, which the price breached earlier. Traders must be patient here to find out what the price does around this level. Does it make an upside breakout or produce a bearish reversal pattern?

It produces a Doji candle right at the flipped resistance followed by an Engulfing candle. This surely attracts traders to keep an eye on the pair to look for short opportunities. The question is, how do we find out entries? When the price is at correction, if we have such a bearish reversal candle at the valuable area, we shall flip over to a minor chart. This is a daily chart. Thus, we shall flip over to the H4 chart. Let us flip over to the H4 chart and find out how that looks.

The H4 chart looks bearish. We are to wait for consolidation and a downside breakout to take a short entry. This is what comes out after a while.

The price produces two bearish candles followed by a bullish one. Any bearish reversal candle breaches the support of the consolidation is the signal to go short here.

This is it. A bearish engulfing candle breaches the support of consolidation. A short entry may be triggered right after the candle closes. Let us find out how the trade looks like in a nutshell.

We may set our Stop Loss above the resistance of consolidation. The Entry-level is very explicit, as it has been explained a bit earlier. We may set our Take Profit at the last lowest low where the price started its correction on the daily chart. Alternatively, we may wait for the price to produce a bullish reversal candle. In this chart, we may come out with our profit right after the last candle (bullish) closes. The choice is yours regarding ‘Take Profit.’ Both have merits and demerits.

The Bottom Line

In the above examples, we have learned what to wait for when to flip over a chart, and on what entry shall be triggered. It does look and sound easy. Trust me. It’s never as easy as it looks when you are to deal with the live market. However, having a lot of practice, and with experience, it surely becomes easier.

Categories
Forex Price Action

How a Broken Resistance Offers Us an Entry

In today’s lesson, we are going to demonstrate an example of how the price heads towards the direction of the trend upon a breakout. We know that it is not only the breakout that traders shall be looking at. There are other factors, such as consolidation or correction, breakout confirmation, and the signal candle. Let us have a look at what the price does before offering us an entry.


The price heads towards the North and has a rejection. Look at the candle at the top (arrowed candle). This is where the price has its first rejection and lands at the support zone. The price has another rejection at the level below (arrowed candle). However, it continues the consolidation. As a trader, you have to wait for a price to make a move either to make a breakout at the support of the consolidation or the resistance level.  Let’s see what happens next.


Oh! Upside breakout! This is how a breakout candle should look like. It closes just below the second resistance. The first resistance is now a support. The price is to make a pullback to confirm the breakout. Let us see what happens next.


It rather continues its bullish journey and makes a breakout at the second level of resistance as well. Guess what shall we do here? Shall we wait for the price to come back to the first breakout level or the second breakout level? Have a look at the chart below.


The breakout level seems to be held and produces a bullish candle already. Shall we consider taking an entry here? The answer is no. The price does not come up to the breakout level. Let us see what happens next.


Look at the last candle. A bullish engulfing candle closes above the last highest high and confirms the breakout level by having a bounce on it. This is the signal candle price-action traders crave for. A buy entry may be triggered right after the candle closes by setting Stop Loss below the candle’s lowest low. In this case, the candle’s lowest low and breakout level are the same. If the signal candle had a bigger lower shadow below the breakout level, the Stop Loss should have been set below the candle’s lowest low.

About setting Take Profit level, there are several ways to determine it. To be very safe, you may have 1:1 risk and reward. This means the number of pips that we have set as our Stop Loss from the entry point; we shall set our Take Profit at a distance with the same amount of pips.

The price travels almost twice the distance than we have anticipated. Never regret, but keep studying to learn how to maximize your risk and reward ratio. We will write some articles on this. Stay tuned.