
An Engulfing candle is a strong bearish reversal candlestick. This makes traders look for trading opportunities. In today’s lesson, we are going to demonstrate an example of how an Engulfing candle creates an entry. Let us proceed.
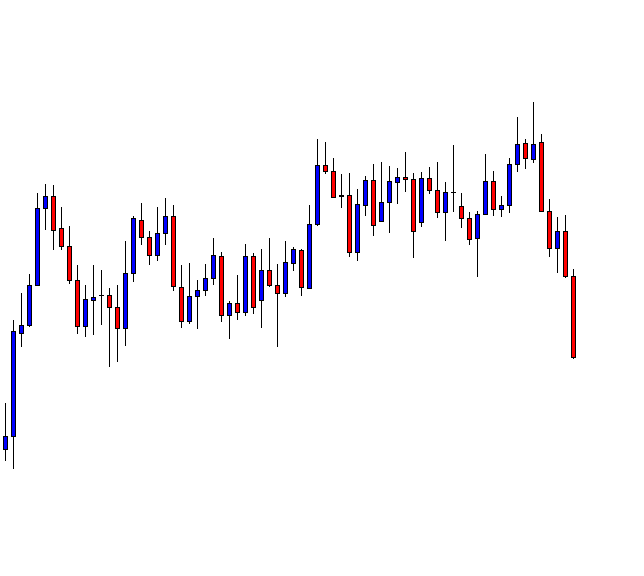
This is a daily chart. The price heads towards the downside with good bearish momentum. Traders shall wait for the price to have consolidation or an upside correction followed by a bearish reversal candle or pattern.
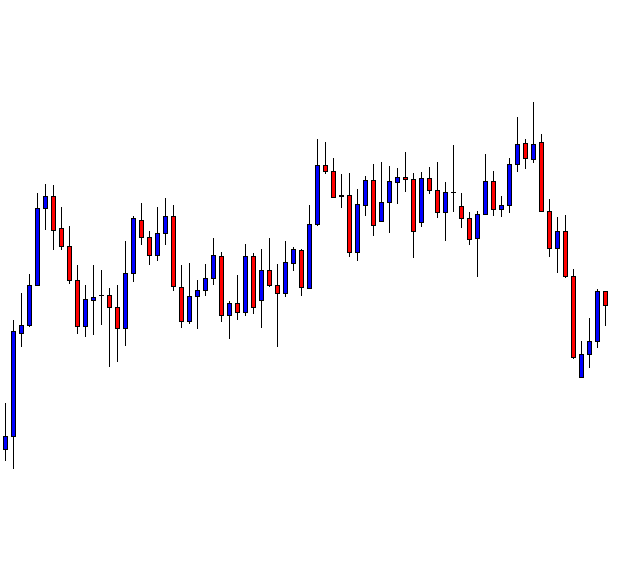
The price starts having the correction. It produces a bearish reversal candle after three consecutive bullish candles. The bearish reversal candle is an Inside Bar. This is not a strong bearish reversal candle. However, we still may flip over to the H4 chart (this is a daily chart) and wait for an entry. The H4 chart does not produce any bearish momentum. Thus, the price goes towards the upside instead. Have a look at the chart below.
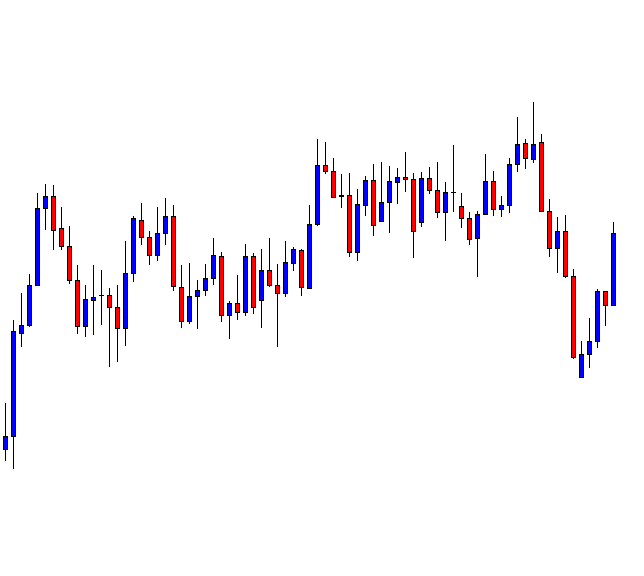
This is one strong bullish candle. However, the candle closed within the level, which the price breached earlier. Traders must be patient here to find out what the price does around this level. Does it make an upside breakout or produce a bearish reversal pattern?
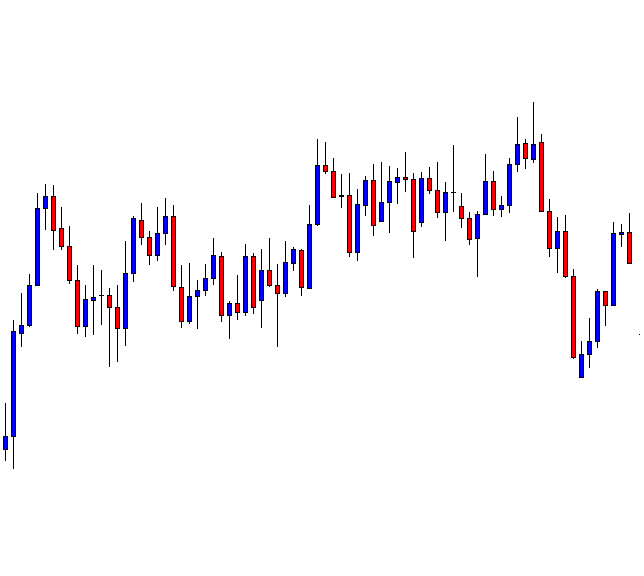
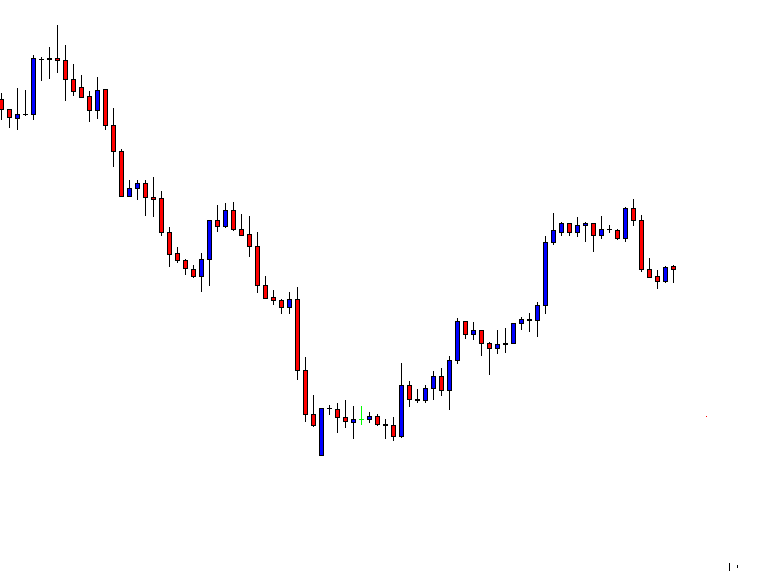
It produces a Doji candle right at the flipped resistance followed by an Engulfing candle. This surely attracts traders to keep an eye on the pair to look for short opportunities. The question is, how do we find out entries? When the price is at correction, if we have such a bearish reversal candle at the valuable area, we shall flip over to a minor chart. This is a daily chart. Thus, we shall flip over to the H4 chart. Let us flip over to the H4 chart and find out how that looks.

The H4 chart looks bearish. We are to wait for consolidation and a downside breakout to take a short entry. This is what comes out after a while.
The price produces two bearish candles followed by a bullish one. Any bearish reversal candle breaches the support of the consolidation is the signal to go short here.
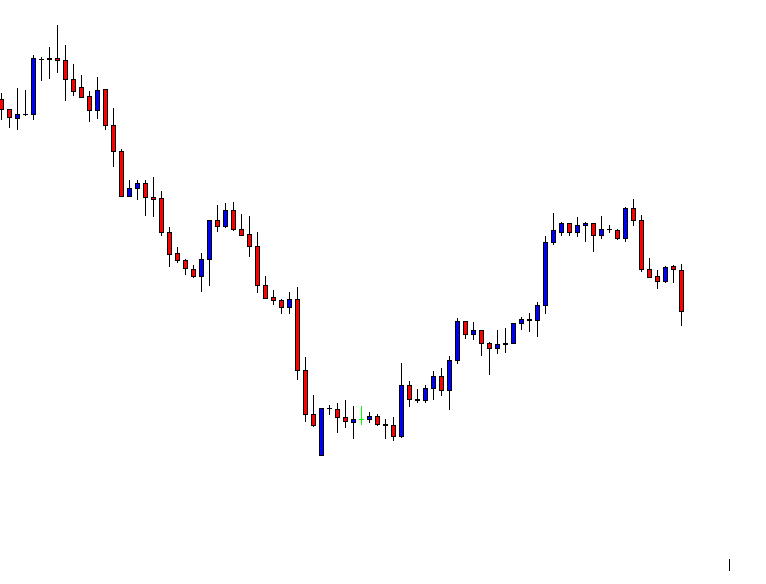
This is it. A bearish engulfing candle breaches the support of consolidation. A short entry may be triggered right after the candle closes. Let us find out how the trade looks like in a nutshell.

We may set our Stop Loss above the resistance of consolidation. The Entry-level is very explicit, as it has been explained a bit earlier. We may set our Take Profit at the last lowest low where the price started its correction on the daily chart. Alternatively, we may wait for the price to produce a bullish reversal candle. In this chart, we may come out with our profit right after the last candle (bullish) closes. The choice is yours regarding ‘Take Profit.’ Both have merits and demerits.
The Bottom Line
In the above examples, we have learned what to wait for when to flip over a chart, and on what entry shall be triggered. It does look and sound easy. Trust me. It’s never as easy as it looks when you are to deal with the live market. However, having a lot of practice, and with experience, it surely becomes easier.