
What is Regular Divergence?
Markets move in trend, channels, and ranges. For any market to undergo a change in the direction, it must happen as a transition. For example, a market that has to transit from an uptrend to a downtrend, it has to go from an uptrend to a channel, to a range, and then begin the downtrend. That is, at one point in time, the market does not hold at support & resistance, and stops making higher highs. And this market reversal is indicated by the regular divergence.
Types of Regular Divergence
There are two types of regular divergence:
- Regular Bullish Divergence
- Regular Bearish Divergence
Let’s understand each of them with the help of live charts
Regular Bullish Divergence
This type of divergence is used to give a bullish signal in the market. When the market is in a downtrend, making lower lows and lower highs, the oscillator follows the same path. At one point, the price chat makes a lower low, but the oscillator makes a lower high. The oscillator does the opposite of what the price did. And this referred to as bullish divergence. Here is an example of the same.
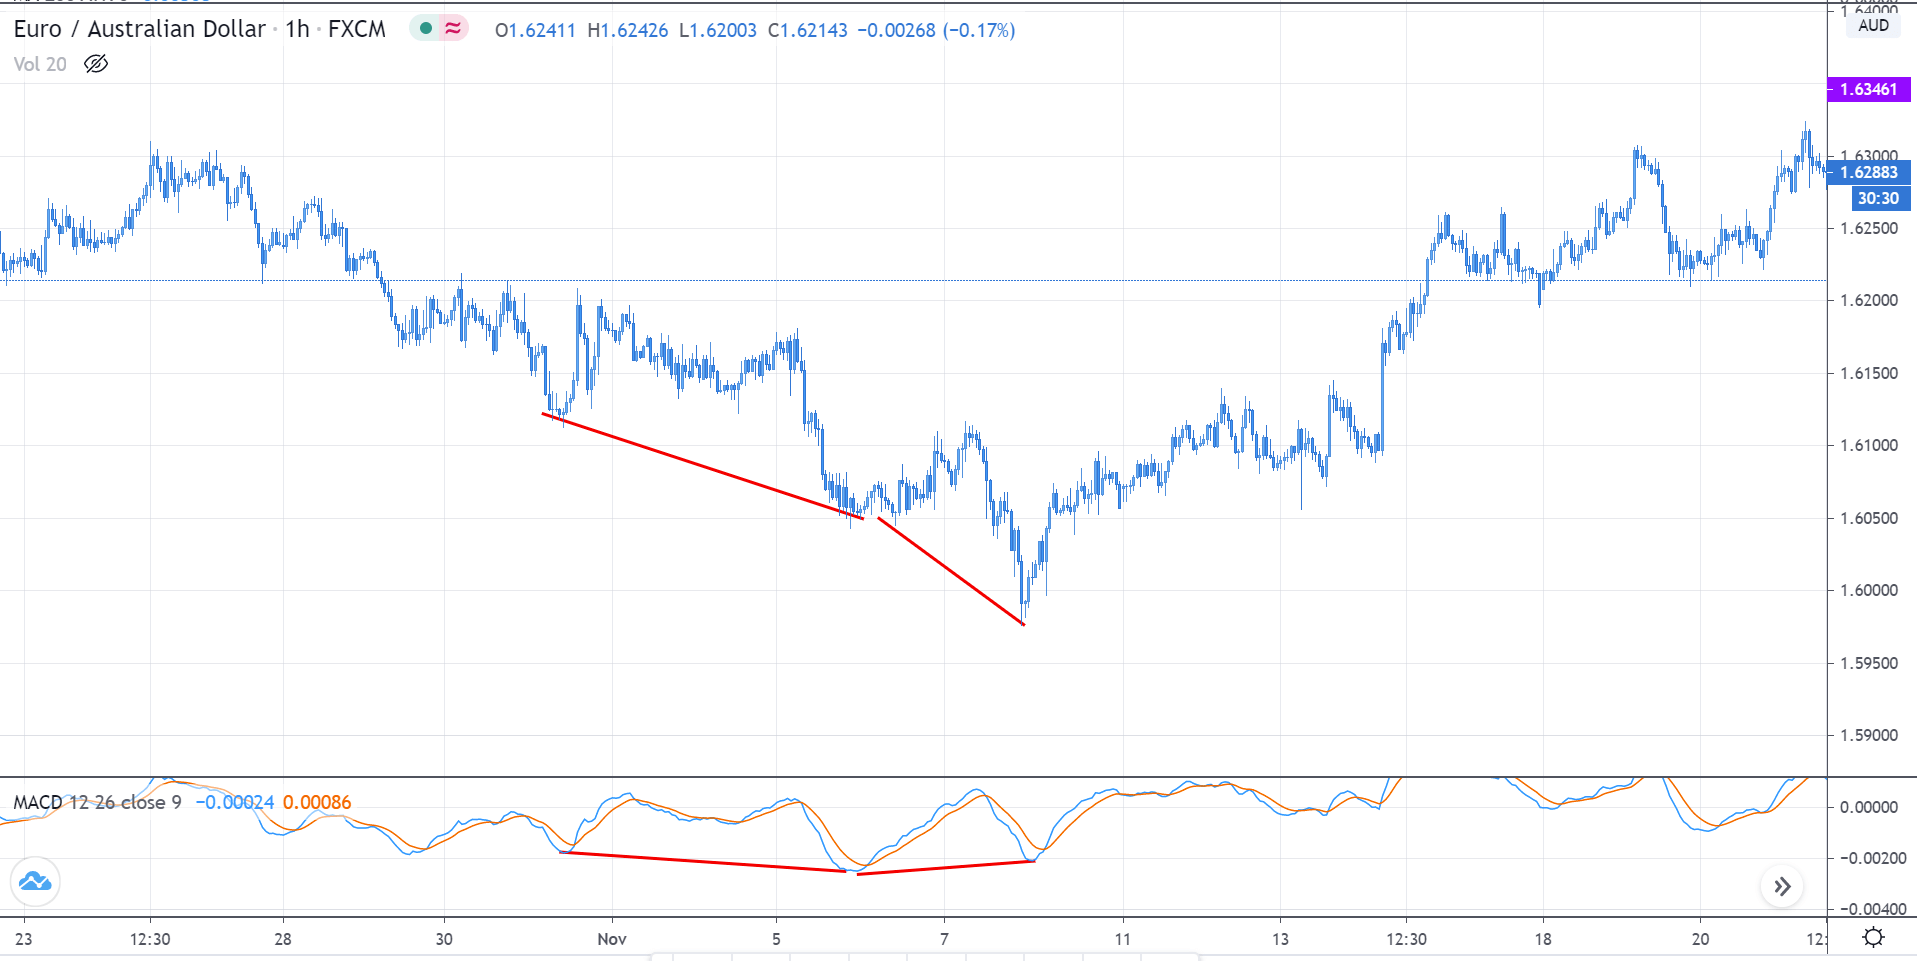
In the above chart of EUR/AUD, reading the market from the left, we see that it was in a downtrend. As the prices were making lower lows, the indicator followed the same. But later, when it made another lower low, the MACD made a higher low, indicating divergence in the market. When it left higher low, we see that the price did not make any lower low from the S&R level. And finally, the market reversed and began to move north.
Regular Bearish Divergence
Regular bearish divergence is used to forecast bearishness in the market. In an uptrend, the market makes higher highs and higher lows. The oscillator indicators follow the same trajectory as well. But, if the price makes a higher high and oscillator does the opposite (lower high), then it is referred to as a bearish divergence. It is an indication that something is not right with the uptrend, and there are possibilities of a trend reversal.
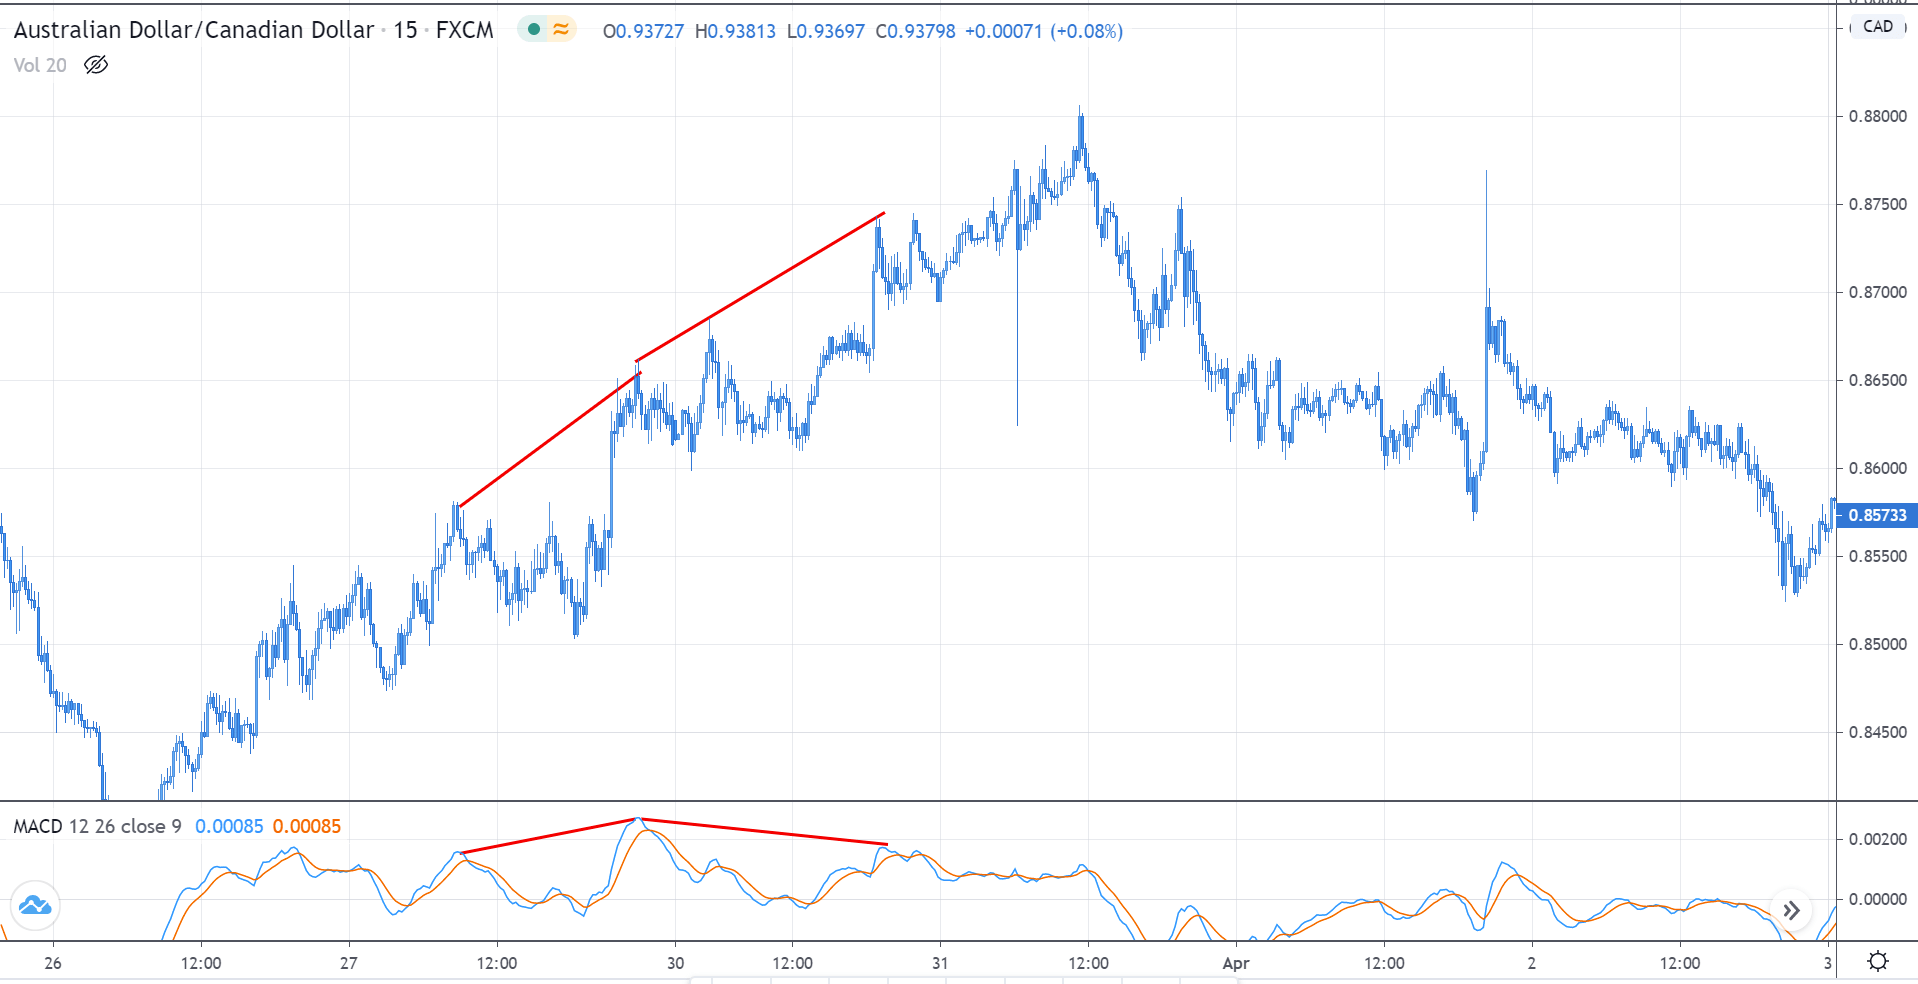
In the above chart of AUD/CAD, we see that the market made a higher high, and the MACD indicator made a higher high as well, indicating that the uptrend is still intact. But the second time when the market made a higher high, the indicator put a lower high—indicating that there is something wrong with the uptrend and could be a possible reversal. In hindsight, we infer that the market failed to make higher highs and then reversed.
Note that divergence provides an indication that there could be a possible reversal in the market. It does not give a signal to buy or sell. The reversal must be solely based on your strategy. Divergence is only used to confirm the strategy and increase odds in your favor.
[wp_quiz id=”77668″]