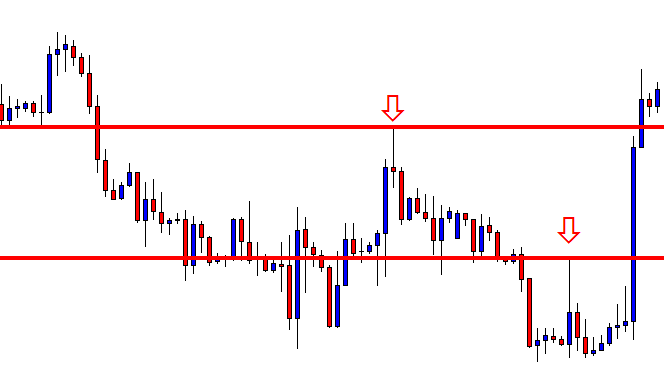
In today’s lesson, we are going to demonstrate an example of how the price heads towards the direction of the trend upon a breakout. We know that it is not only the breakout that traders shall be looking at. There are other factors, such as consolidation or correction, breakout confirmation, and the signal candle. Let us have a look at what the price does before offering us an entry.

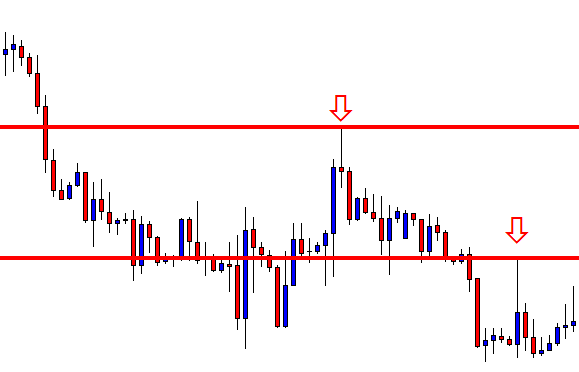
The price heads towards the North and has a rejection. Look at the candle at the top (arrowed candle). This is where the price has its first rejection and lands at the support zone. The price has another rejection at the level below (arrowed candle). However, it continues the consolidation. As a trader, you have to wait for a price to make a move either to make a breakout at the support of the consolidation or the resistance level. Let’s see what happens next.
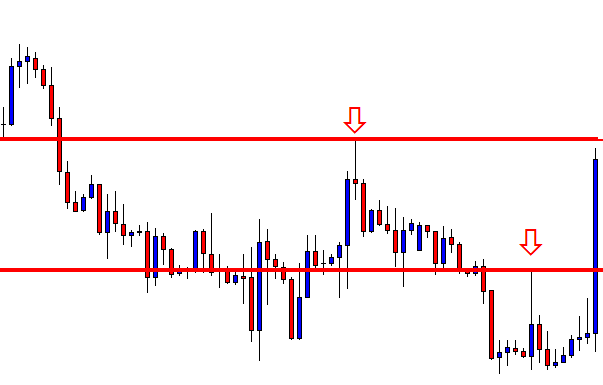
Oh! Upside breakout! This is how a breakout candle should look like. It closes just below the second resistance. The first resistance is now a support. The price is to make a pullback to confirm the breakout. Let us see what happens next.
It rather continues its bullish journey and makes a breakout at the second level of resistance as well. Guess what shall we do here? Shall we wait for the price to come back to the first breakout level or the second breakout level? Have a look at the chart below.
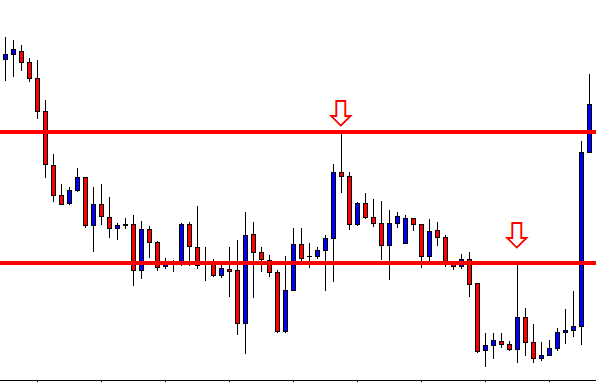
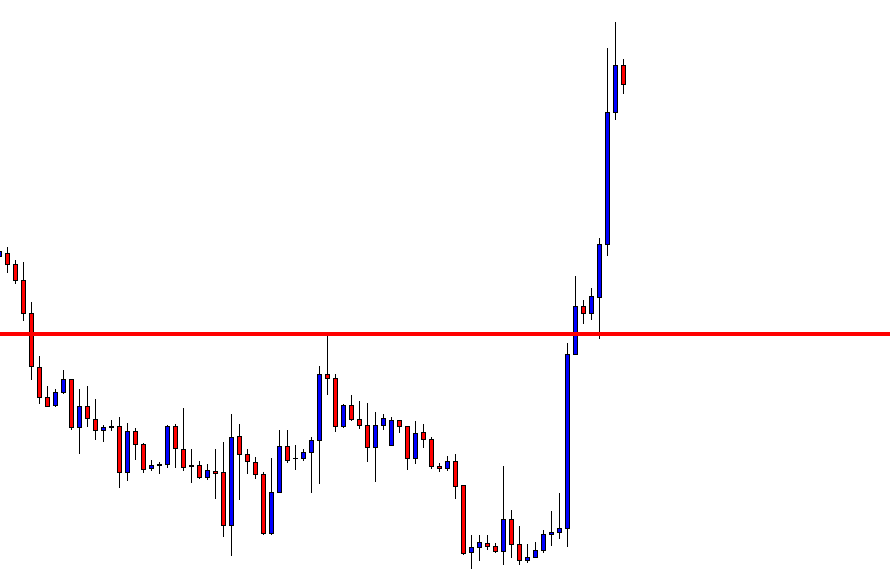
The breakout level seems to be held and produces a bullish candle already. Shall we consider taking an entry here? The answer is no. The price does not come up to the breakout level. Let us see what happens next.
Look at the last candle. A bullish engulfing candle closes above the last highest high and confirms the breakout level by having a bounce on it. This is the signal candle price-action traders crave for. A buy entry may be triggered right after the candle closes by setting Stop Loss below the candle’s lowest low. In this case, the candle’s lowest low and breakout level are the same. If the signal candle had a bigger lower shadow below the breakout level, the Stop Loss should have been set below the candle’s lowest low.
About setting Take Profit level, there are several ways to determine it. To be very safe, you may have 1:1 risk and reward. This means the number of pips that we have set as our Stop Loss from the entry point; we shall set our Take Profit at a distance with the same amount of pips.
The price travels almost twice the distance than we have anticipated. Never regret, but keep studying to learn how to maximize your risk and reward ratio. We will write some articles on this. Stay tuned.