Categories
Forex Elliott Wave Forex Technical Analysis

EURGBP Soars!, More Gains Ahead?

The EURGBP cross soared on Friday session, surpassing the psychological 0.92 barrier, advancing until the target area forecasted in our previous short-term analysis (here.)

Technical Overview

Our previous analysis discussed the completion of the complex corrective formation identified as a double-three pattern of Minute degree labeled in black, which began on last September 11th at 0.92916 and finished on November 11th at 0.88610. Likewise, after the double-three completion, the cross completed the wave B of Minor degree identified in green.

Once the EURGBP found the bottom at 0.88610, the cross began a rally corresponding to wave C. We have seen in our previous analysis the price completed wave ((ii)) at 0.88667 on November 23rd. After this completion, both the breakout of the descending trendline of the second wave in black and the strong bullish long-body candlestick formation developed in the November 27th session confirmed the start of the third wave in black.

Technical Outlook

During the last trading session of the week, the short-term Elliott wave view for the EURGBP cross exposed in the following 8-hour chart reveals the acceleration in its advance, which surpassed the supply zone between 0.92008 and 0.92181, finding resistance at 0.92298.

The impulsive upward movement observed during Friday’s session allows us to distinguish the completion of the wave ((iii)) at 0.92298 and the beginning of the fourth wave of the same degree.

In this context, the current corrective formation identified as wave ((iv)) in black could decline until the previous supply zone between 0.90686 and 0.90446, where the cross could find fresh buyers. Once the fourth wave completes, the cross should advance in a new rally corresponding to wave ((v)), which would be subdivided into a five-wave sequence. The potential target for the end of wave C is within the next supply zone between 0.92568 and 0.92916.

In summary, the EURGBP cross appears moving in an incomplete wave C of Minor degree, which, in its lesser degree count, shows the beginning of the fourth wave in black. This corrective formation could decline until the previous supply zone is located between 0.90446 and 0.90686. The cross, then, could find fresh buyers expecting the continuation of the trend that would push up the price toward the supply zone between 0.92568 and 0.92916.

Lastly, the invalidation level for this bullish scenario can be found at 0.90031.

Categories
Forex Signals

EURUSD: Heading towards the South

EURUSD produced a bearish candle on the daily chart Friday. The 15 M chart shows that the price made a bearish correction to start its trading day today. It found its resistance at 1.21380 and made a bearish move. It made a breakout at the level of 1.2110 by producing a good-looking bearish Marubozu candle. The pair produced one more bearish candle and then consolidated around the level of 1.21000. Upon producing a bearish Pin Bar, the price seems to get more bearish. It may head towards the level of 1.20700 with good bearish momentum. The price may consolidate or make a bullish correction around the level before finding its next direction as far as the 15M chart is concerned.

Trade Summary:

Entry: 1.21002

Stop Loss: 1.21002

Take Profit: 1.20802

The risk for the trade per standard lot is $100, Mini lot $10 and Micro lot $1. The risk-reward is 1:2. Thus, the reward for per standard lot is $200, Micro lot $ $20 and Mini lot $ 2.

Categories
Forex Basic Strategies

The Best Tools to Trade Pullbacks Effectively

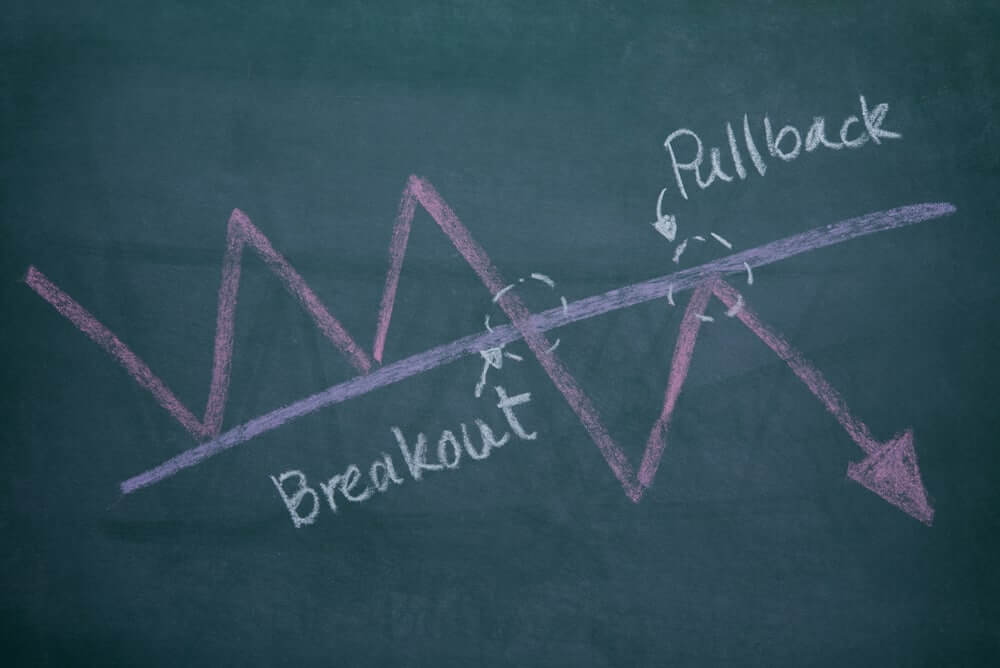
A Pullback is a pause, retracement, or consolidation of a price from the most recent peak during an ongoing trend. The pullback is widely seen as a trading opportunity after the underlying asset experienced a large upside or downside move. For example – Any forex pair is in a strong uptrend, and some healthy news came, and price action dropped back to the most recent support area that indicates the professional traders are booking the profits.

Pullbacks happen all the time, and if you learn how to trade them successfully, it can be a great skill as a trader. Trading the pullback is the easiest way to trade the market, sometimes you will recognize the high probability pullback trades and sometimes extreme volatile pullbacks, and you can enhance your repertoire and find many higher probability trades. If you are new in the market, then pullback trading is a fantastic and easy way to find superior risk-to-reward ratio trades. In this article, we will explore five trading strategies that provide excellent pullback trades.

Pullback Trading Strategies

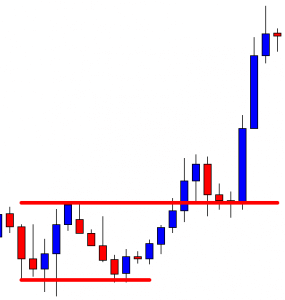
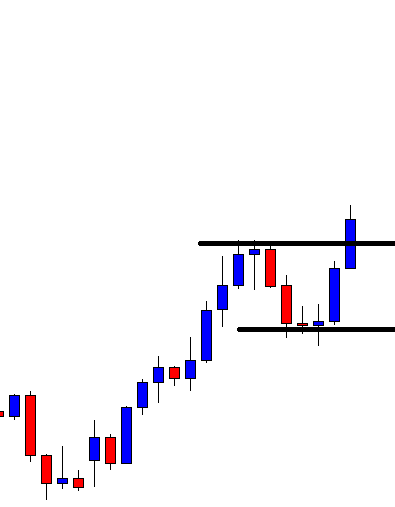
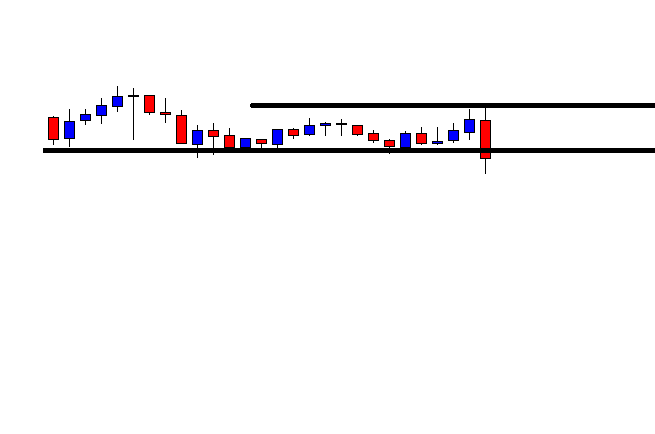
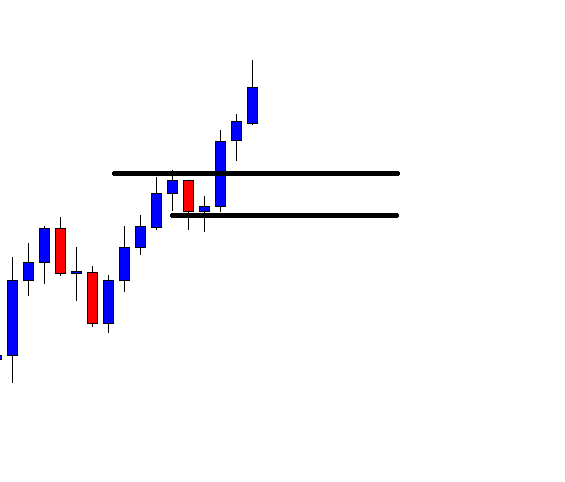
Two-Legged Pullback To The MA 

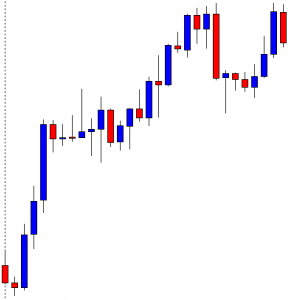
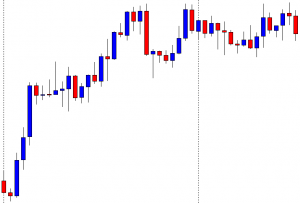
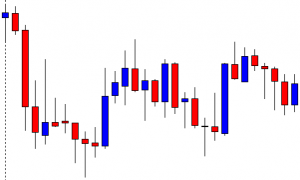
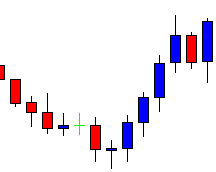
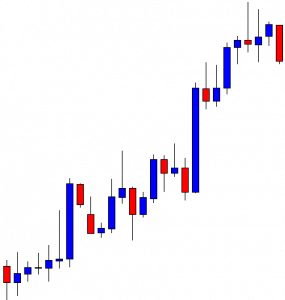
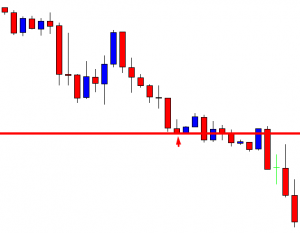
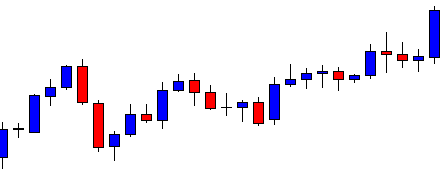
Al Brooks popularized the concept of two legs pullback in his price action books. He explained most of the time, price action print two legs to reach the moving average. We backtested his strategy and found out that his techniques work very well in the trending market, but sometimes in the strong trending market, you will only witness one leg.

This is because most market operators are in a hurry to move the market; this may be because of any fundamental news. To filter out all the low probability trades, it is advisable to find a trending market and then wait for the price action to print the two legs towards the moving average, and when all the moves complete, take the buy entry.

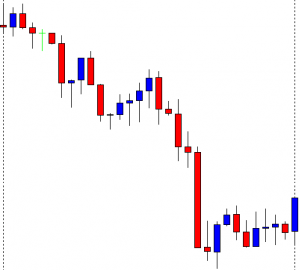
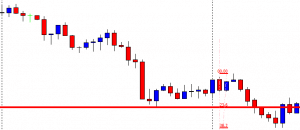
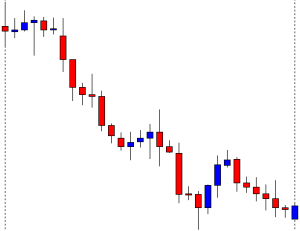
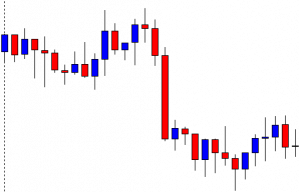
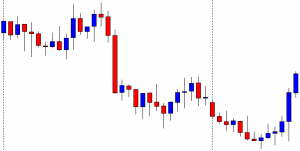
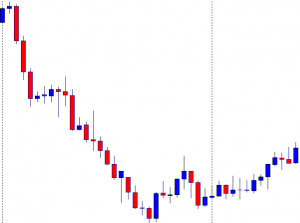
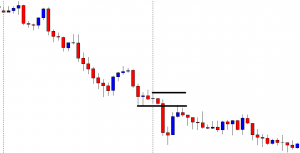
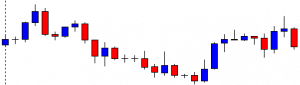
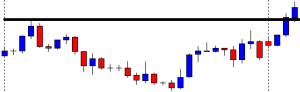
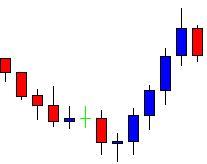
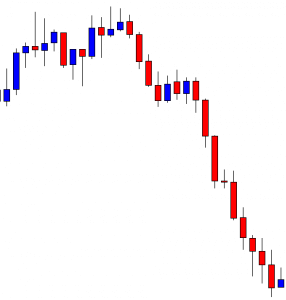
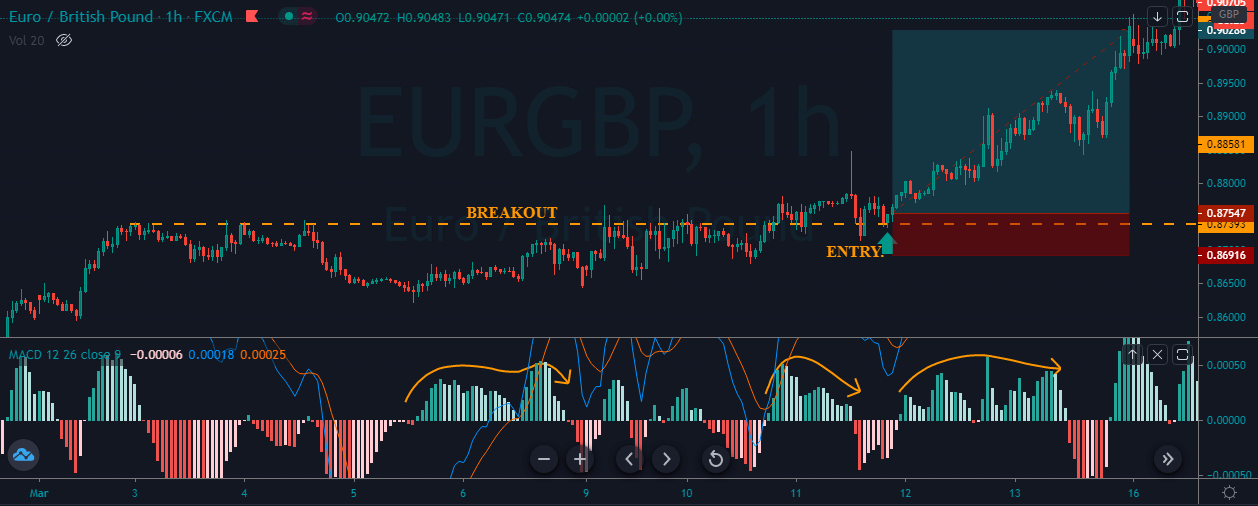
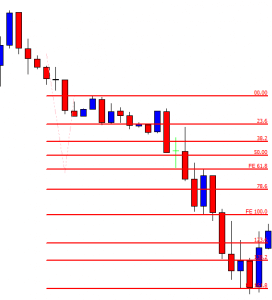
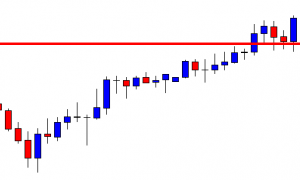
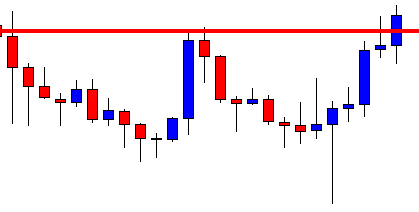
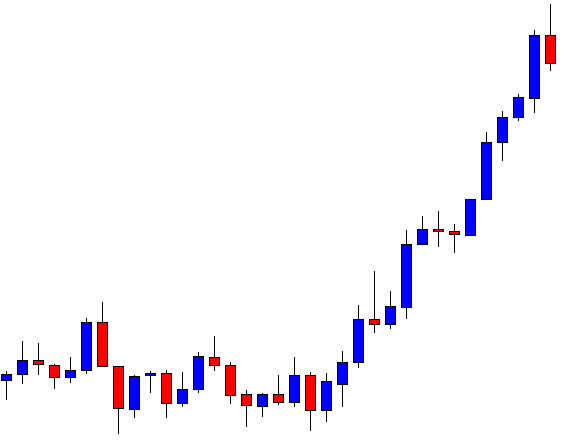
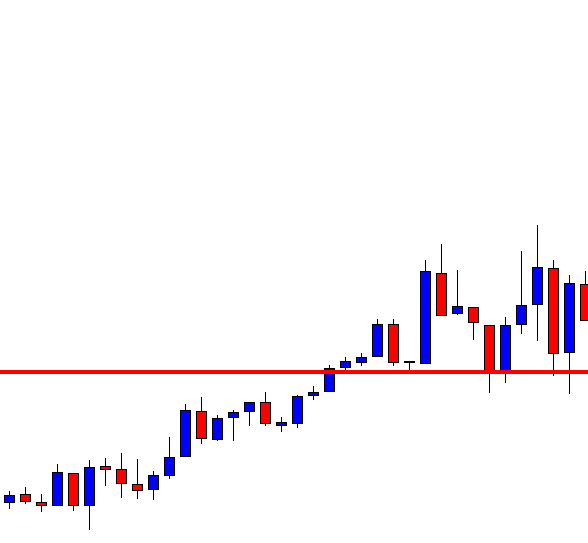
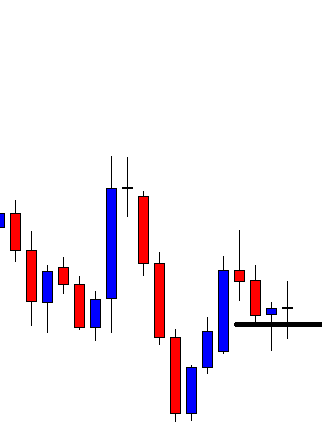
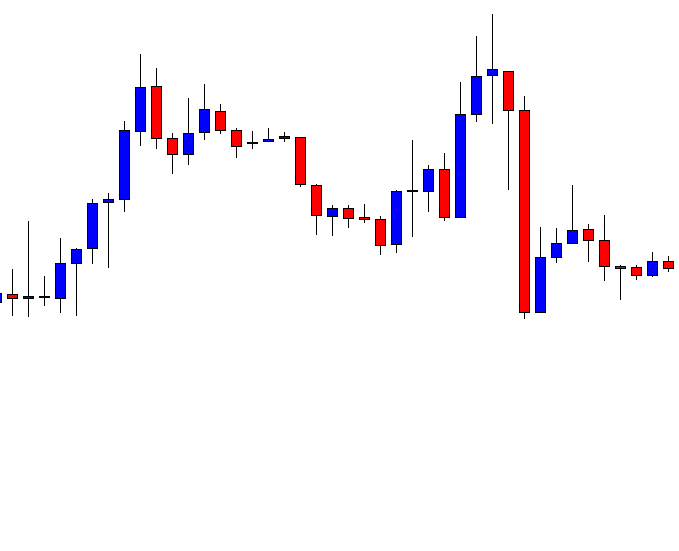
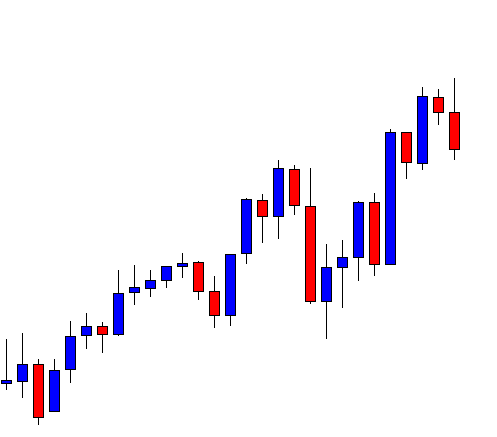
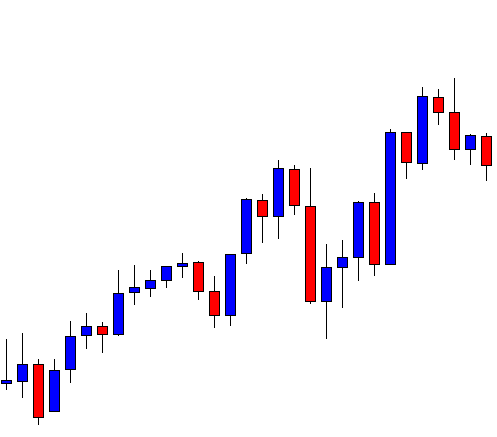
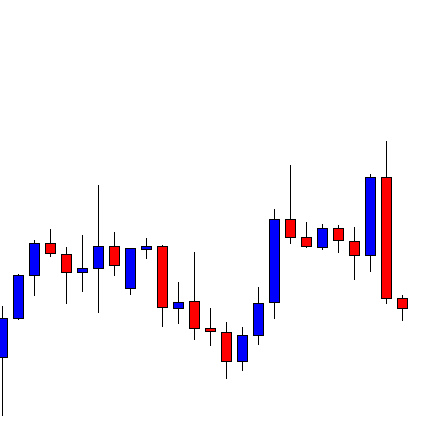
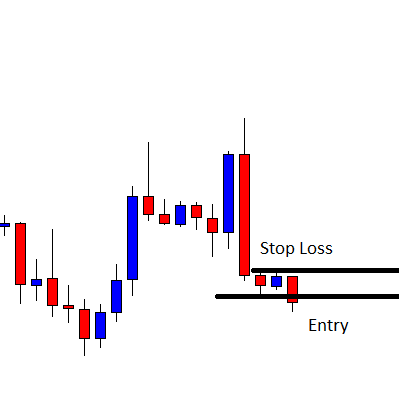
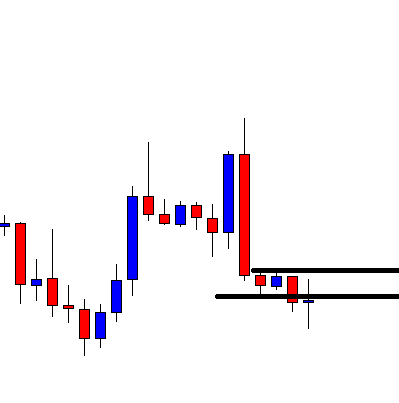
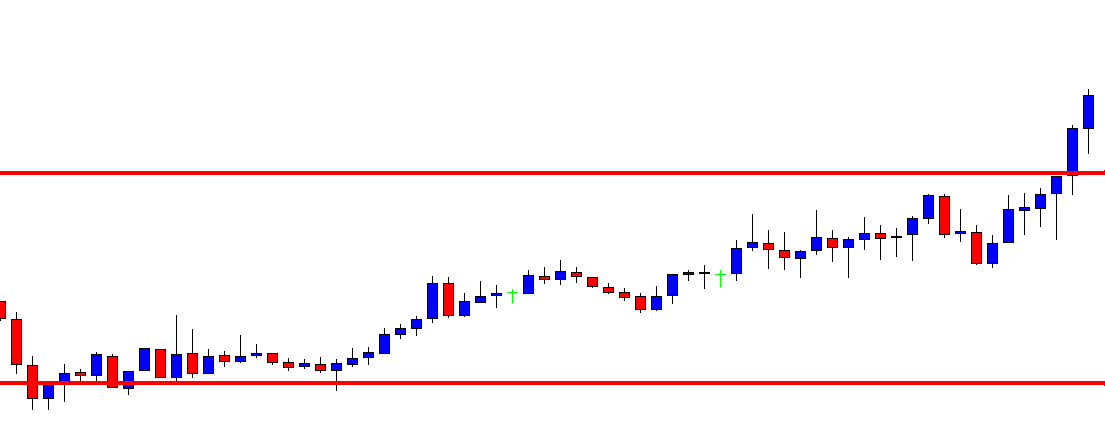
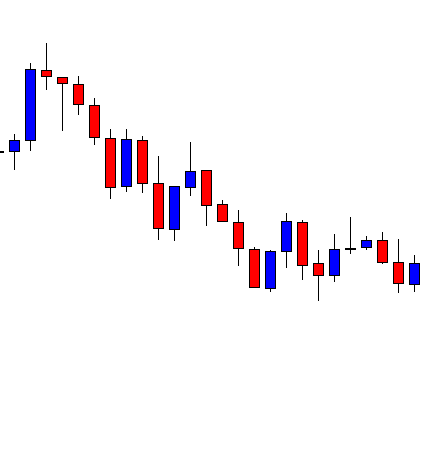
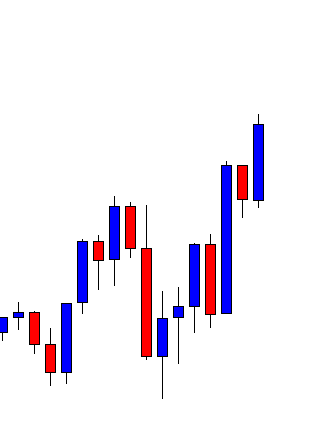
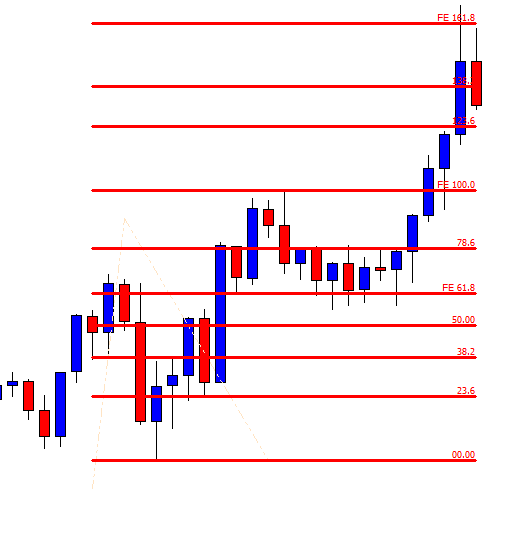
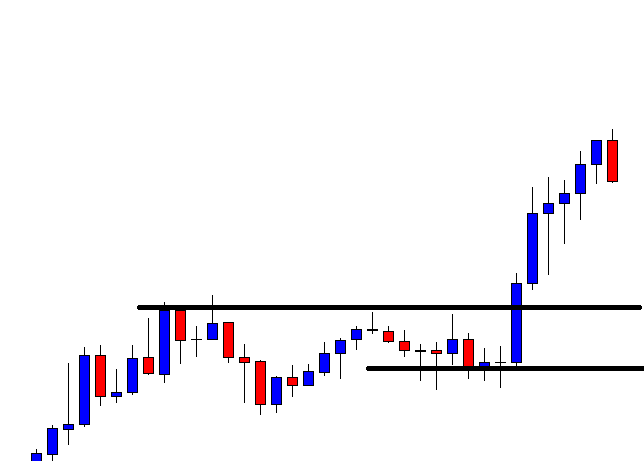
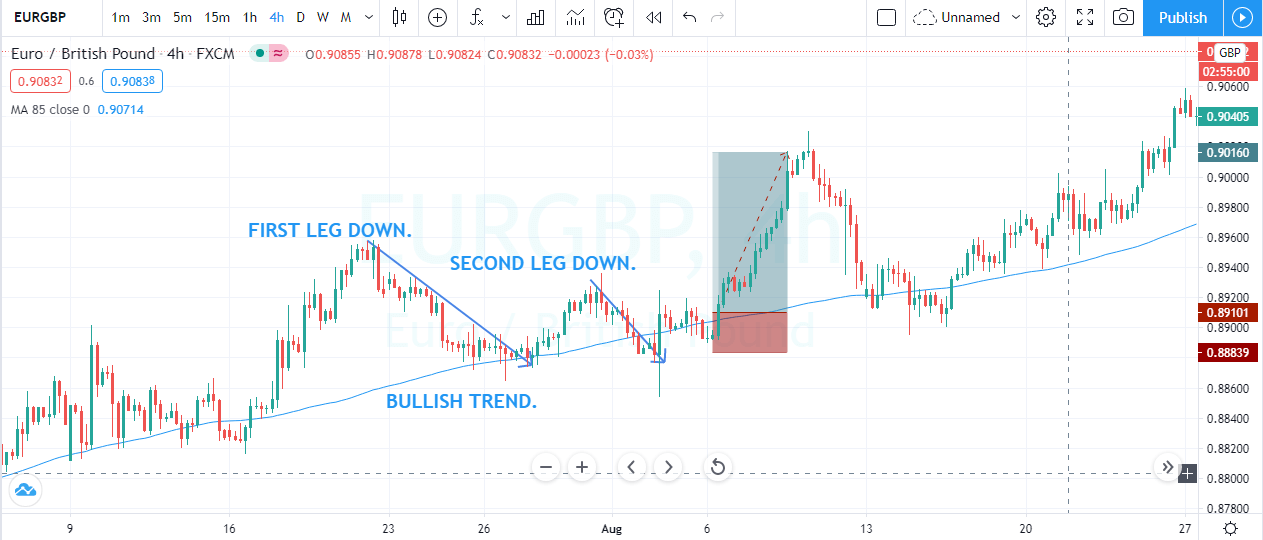
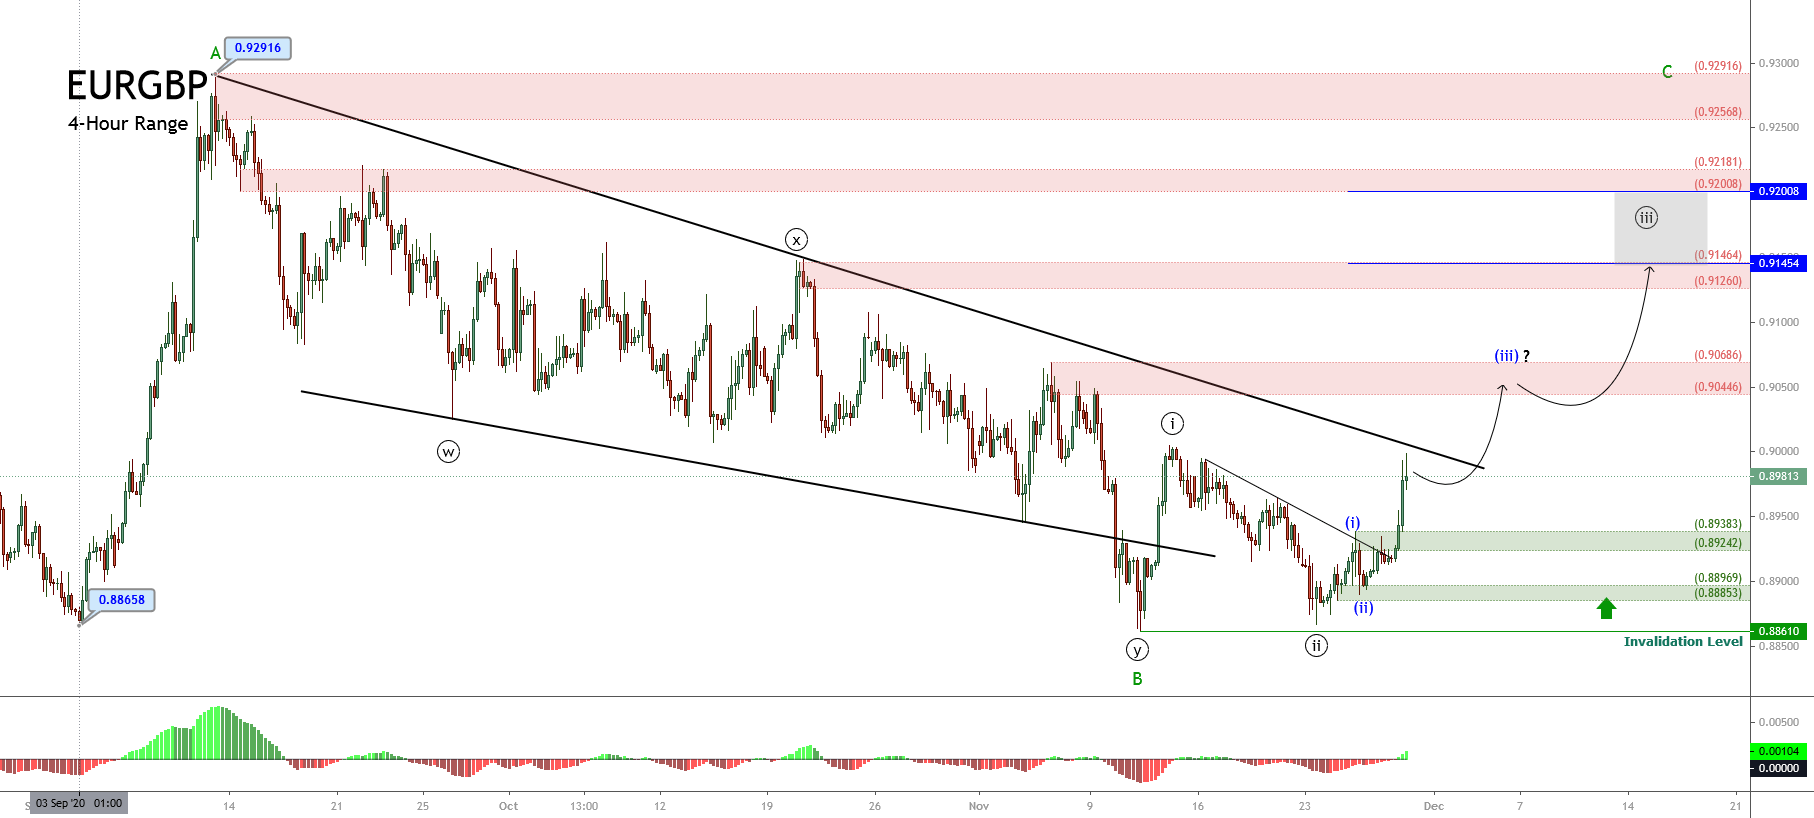
The image below represents the buying trade in the EURGBP forex pair. The moving average indicates the buying trend in the currency. Price action pulled back to the moving average, prices responded from the moving average and goes a bit higher and end up printing the second leg. The second leg goes down to the moving average, but the strong buyers smack back up and close above the moving average. Furthermore, the price slows down a bit, and we took buying entry with the stops below the entry, and for taking profit, we choose the brand new higher high.

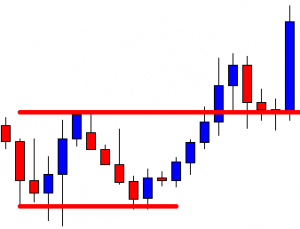
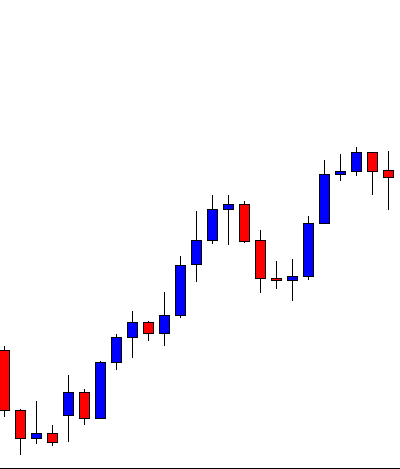
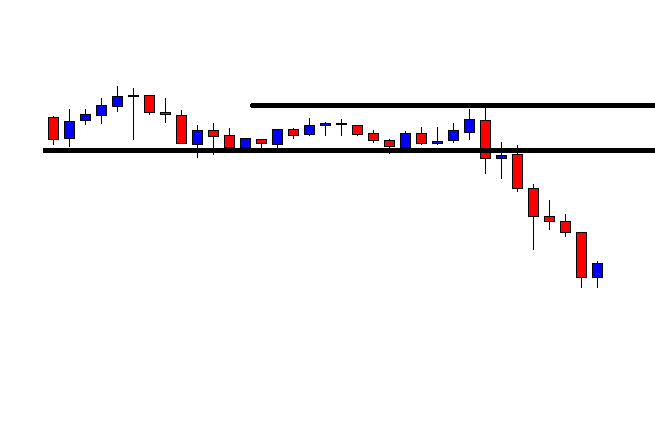
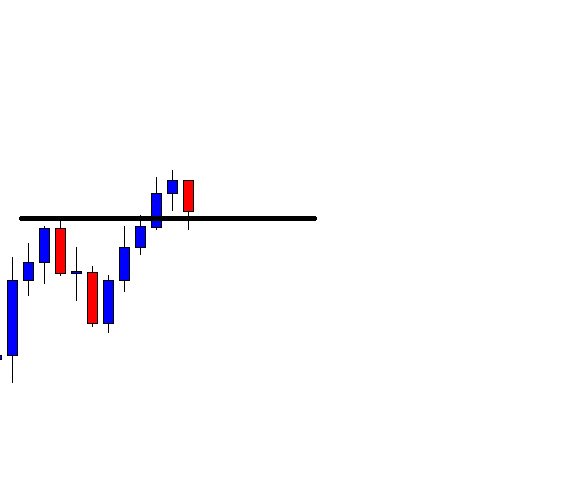
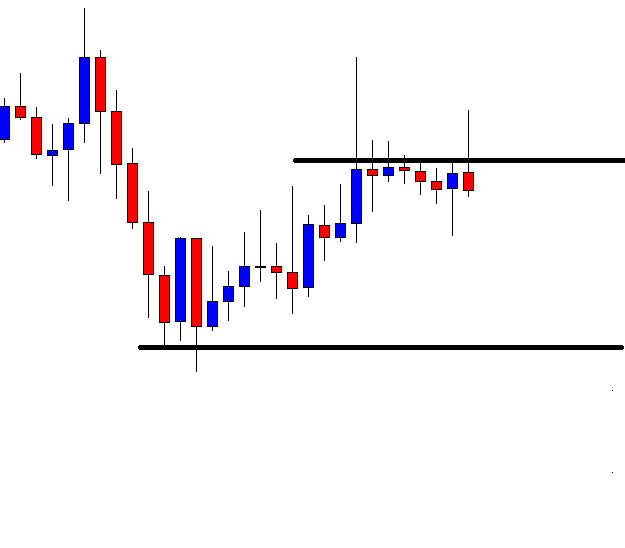
Candlestick Pattern + MA

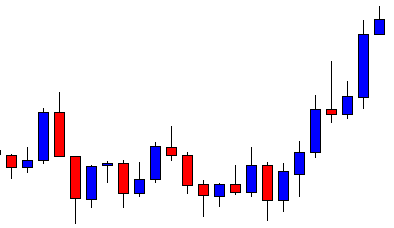
This method will use the bullish engulfing candlestick pattern with a moving average to successfully trade the market.

Here we need two ingredients.

  1. Price action pullback to the moving average.
  2. The market forms a bullish engulfing pattern.

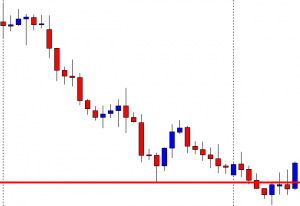
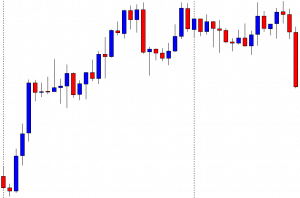
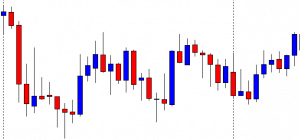
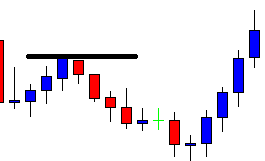
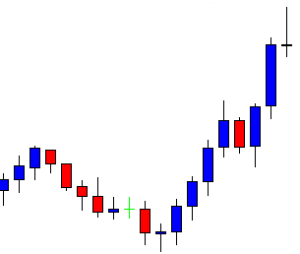
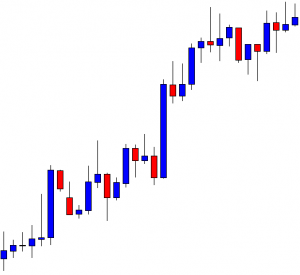
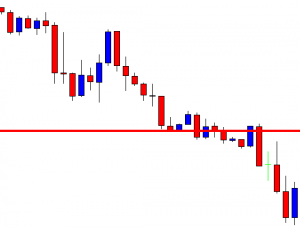
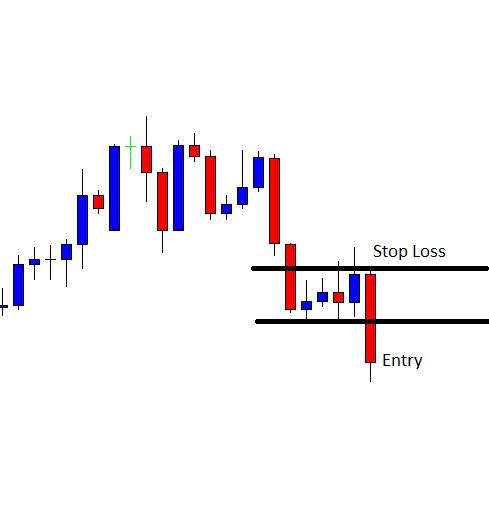
First of all, look for the strong trending market and wait for price action to approach the moving average. At this stage, if the price action prints the engulfing pattern,  it’s the right time for you to go for a buy entry. Otherwise, no entries are allowed for you. An  Engulfing Pattern indicates the sellers try to print the brand new lower low, but because of dynamic support of moving average prices pulled back and buyers end up eating all the sellers. As a result, we witnessed the Bullish Engulfing pattern.

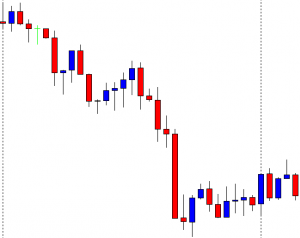
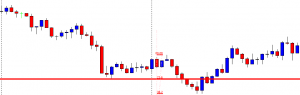
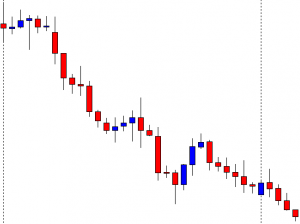
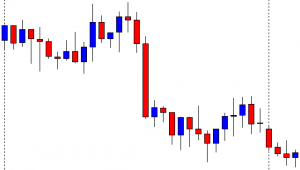
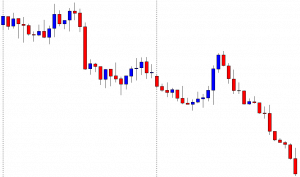
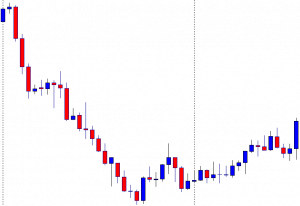
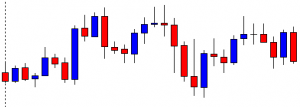
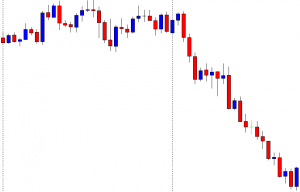
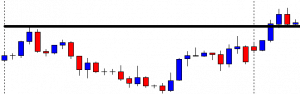
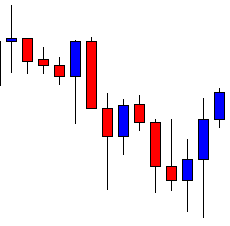
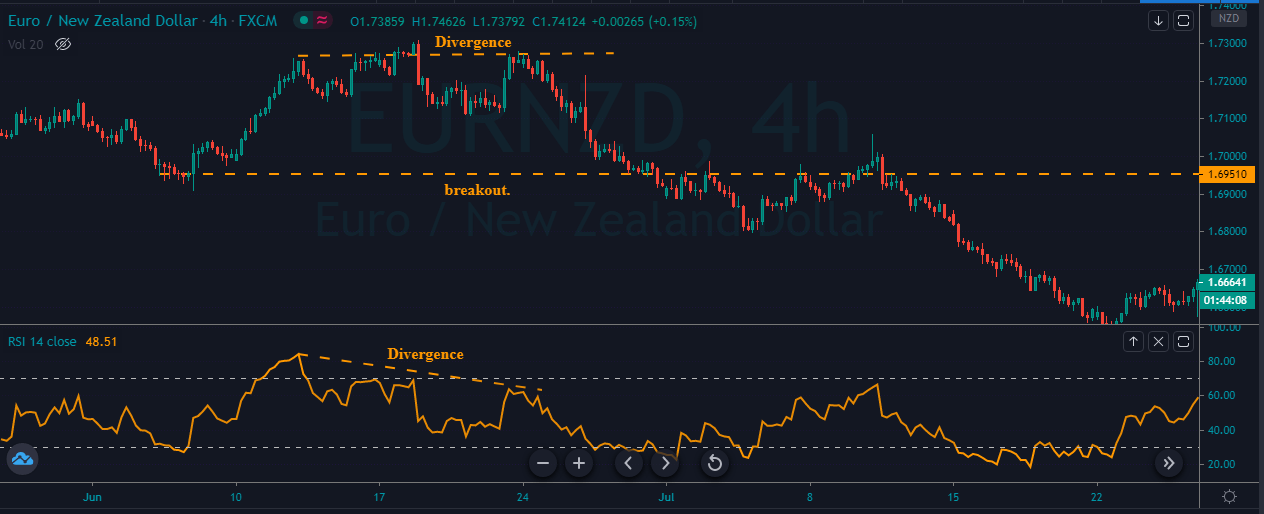
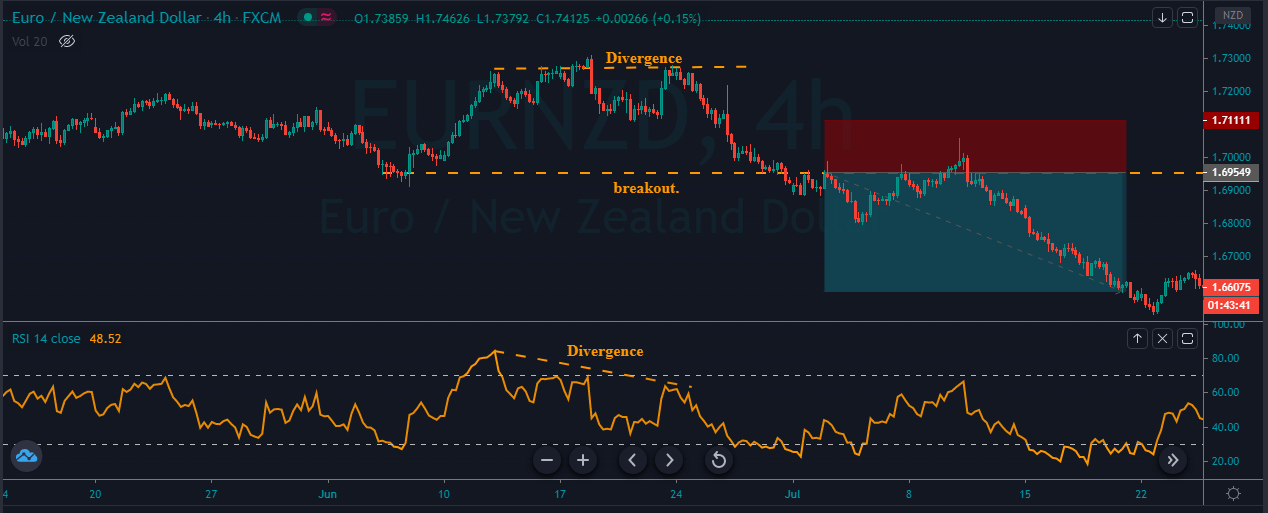
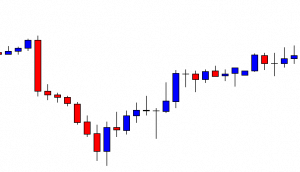
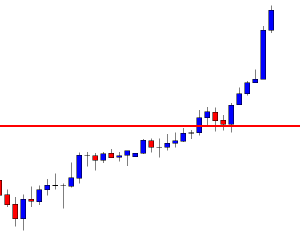
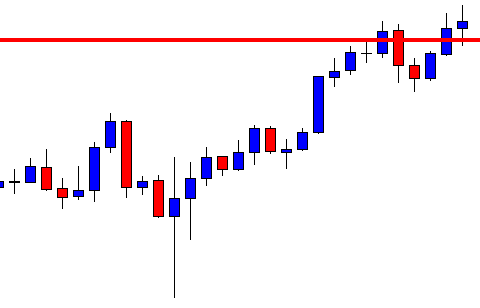
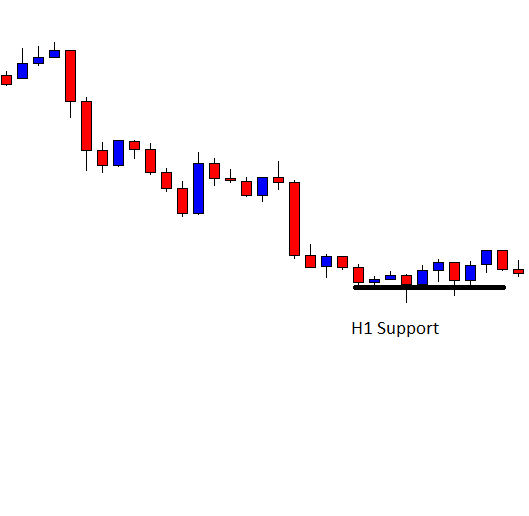
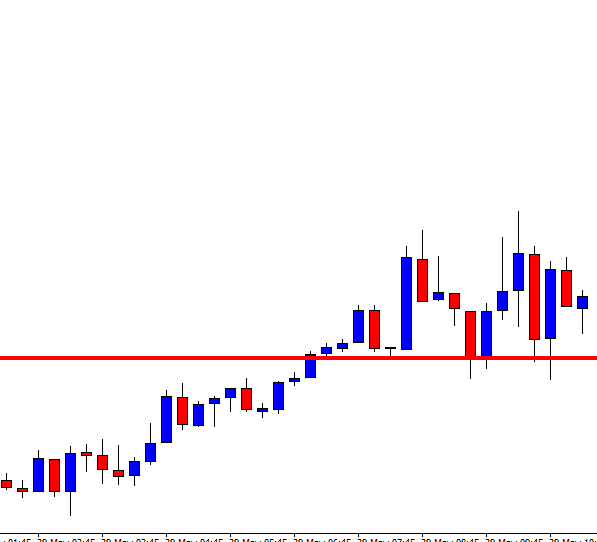
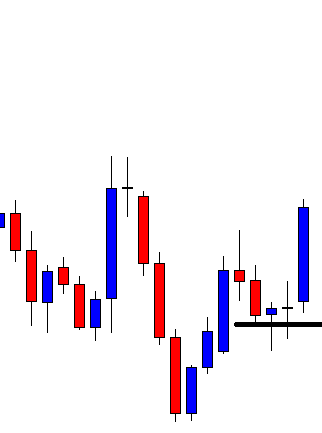
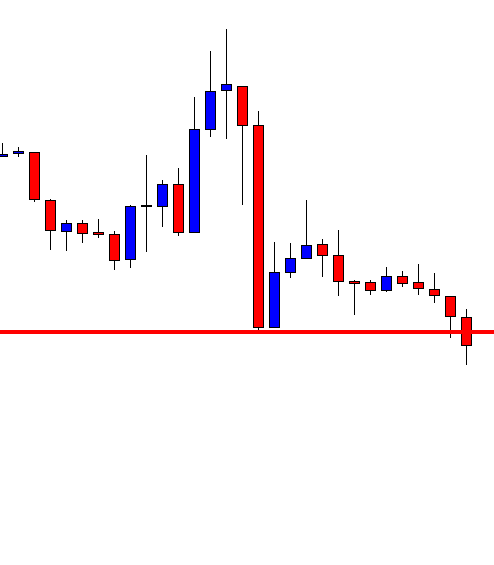
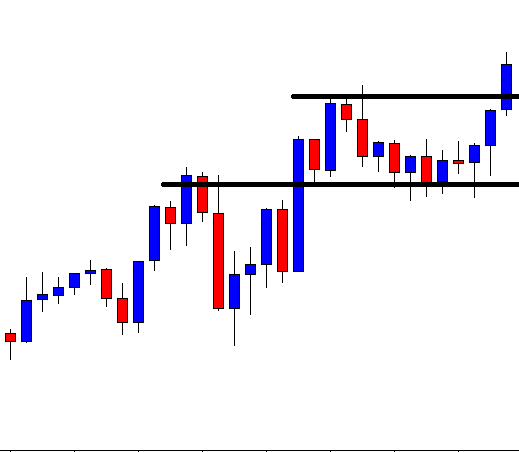
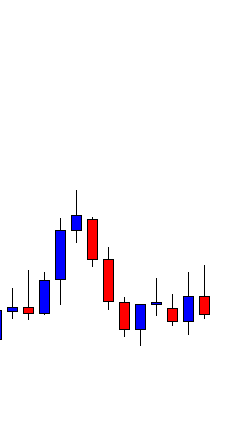
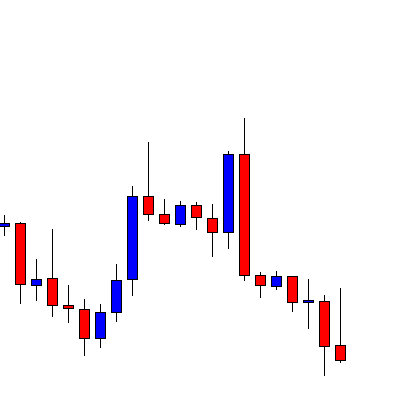
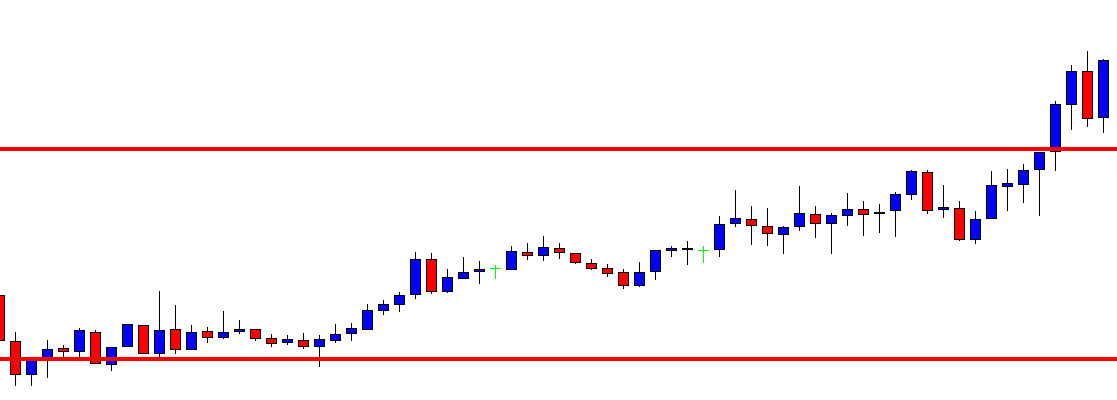
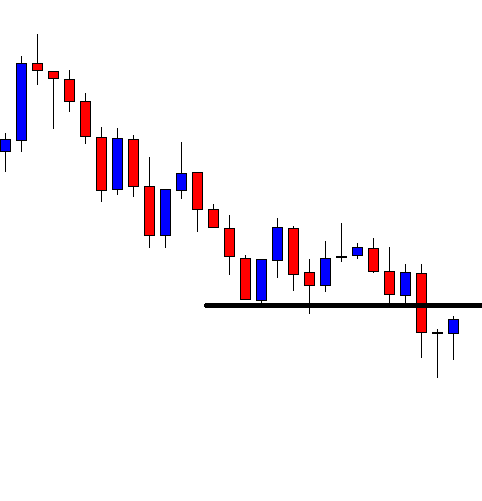
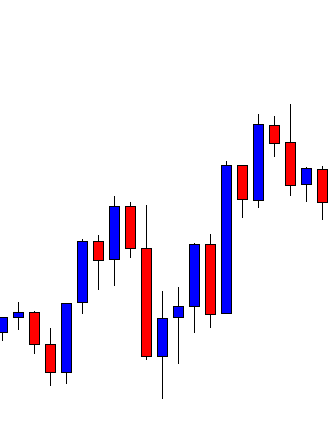
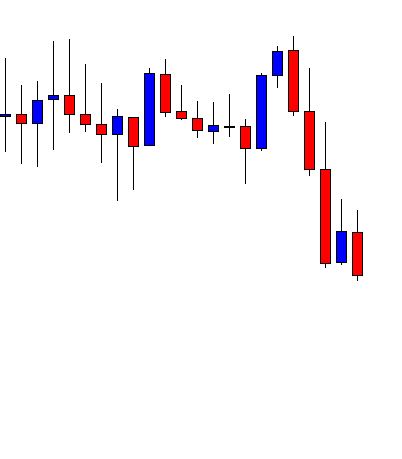
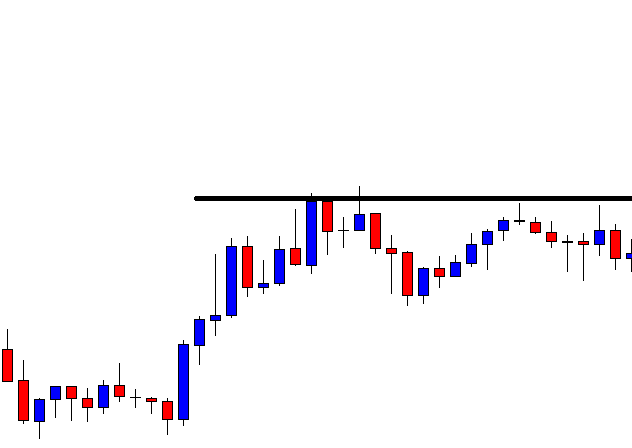
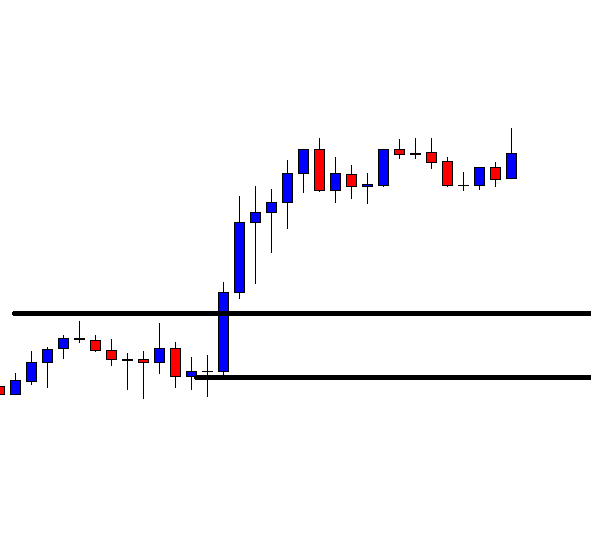
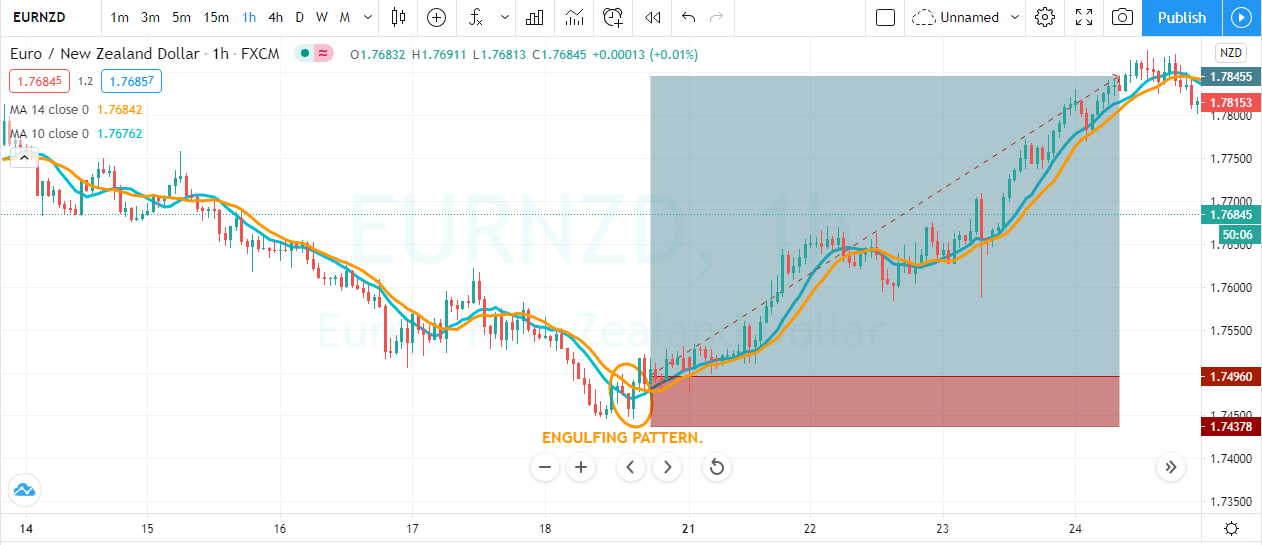
The image below represents the buying trade in the EURNZD forex pair. As you can see, at the end of the downtrend, price action goes above the moving average, and we witnessed the engulfing pattern. The trading pattern closed above the moving average, which was a confirmation of buyers came back to the show and were expecting the brand new higher high.

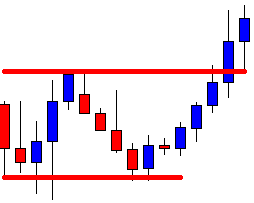
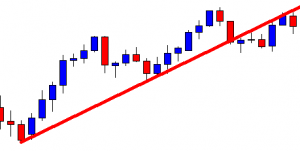
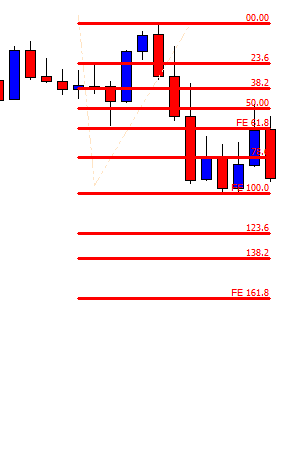
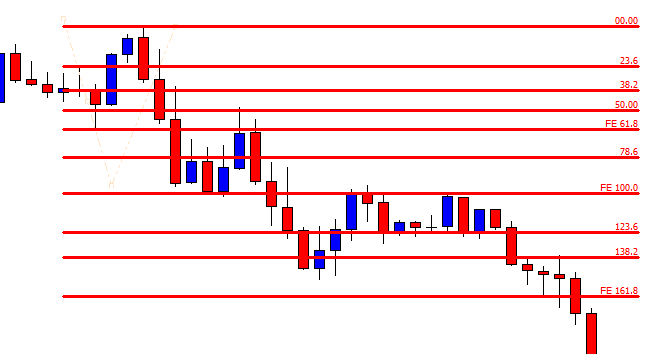
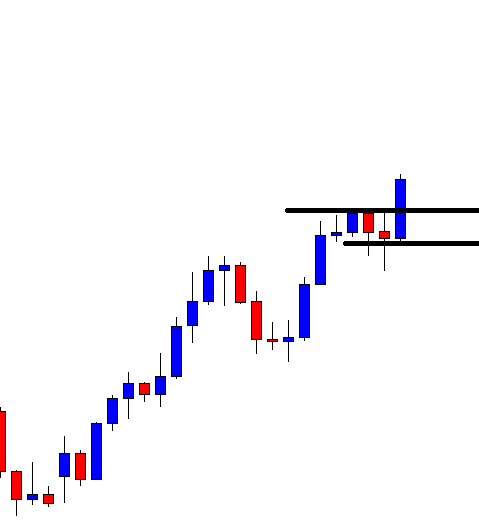
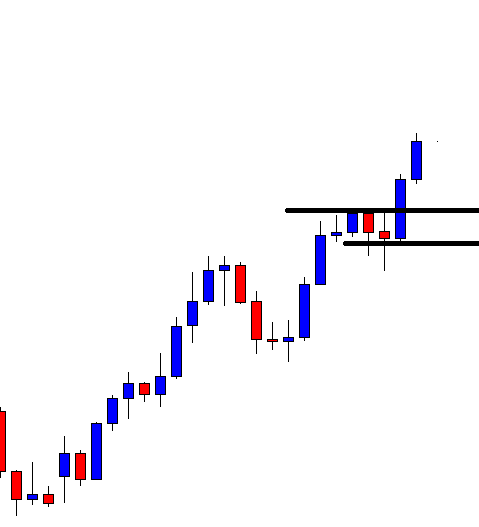
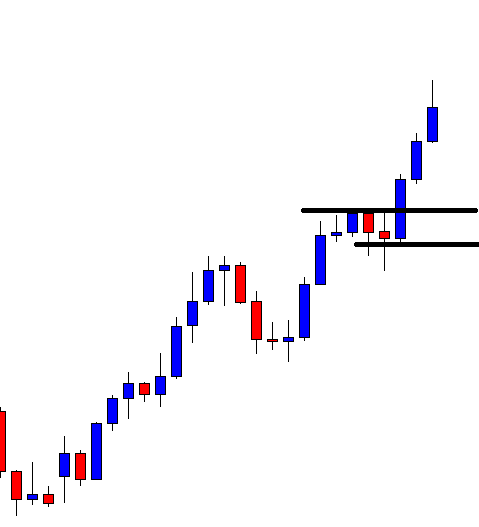
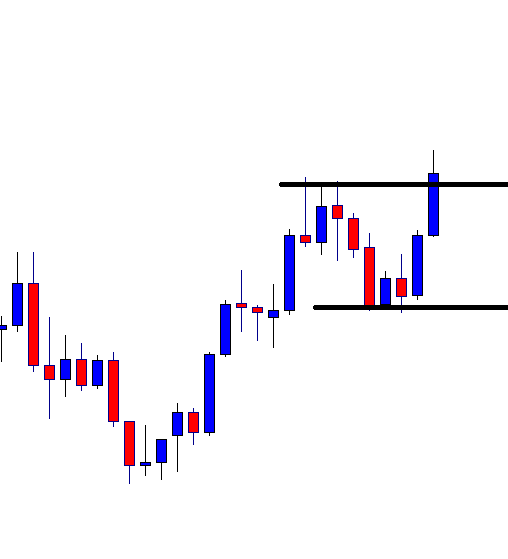
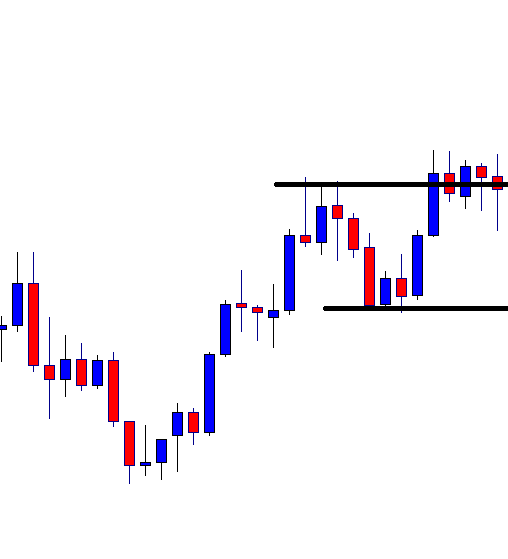
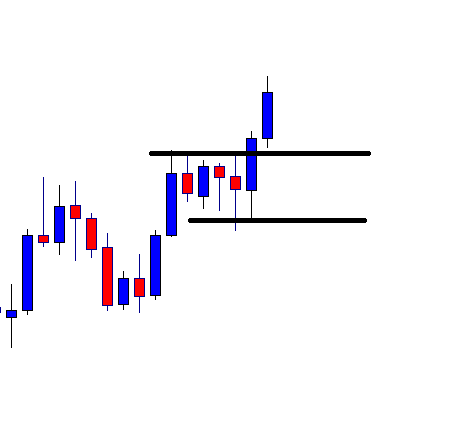
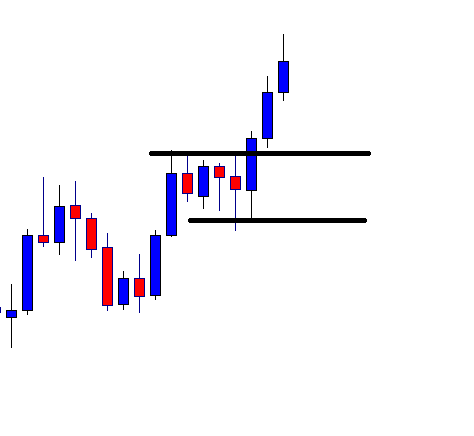
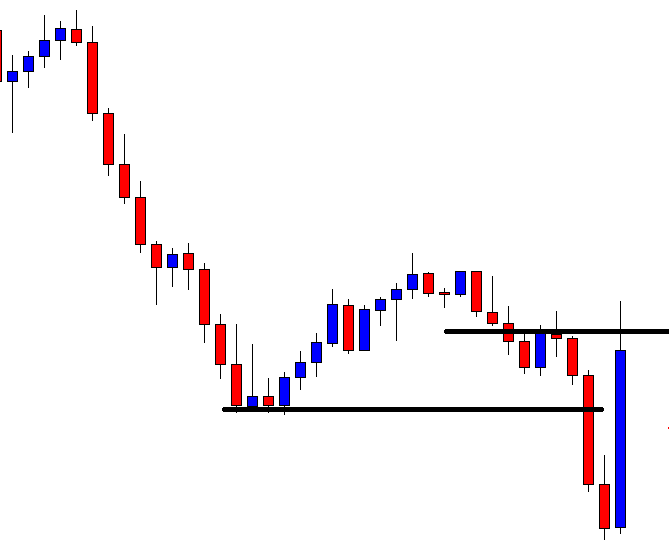
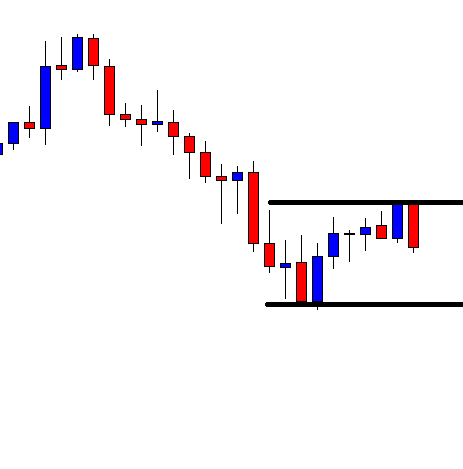
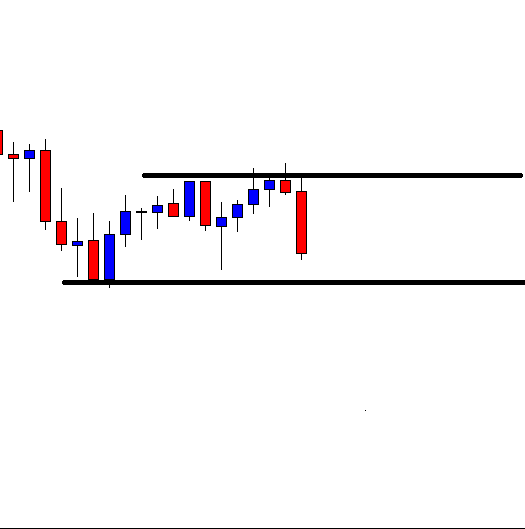
Trendlines + Channel Trading

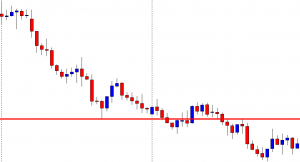
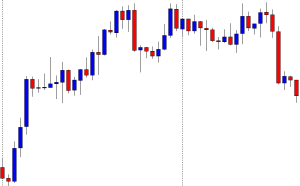
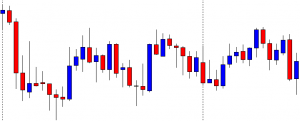
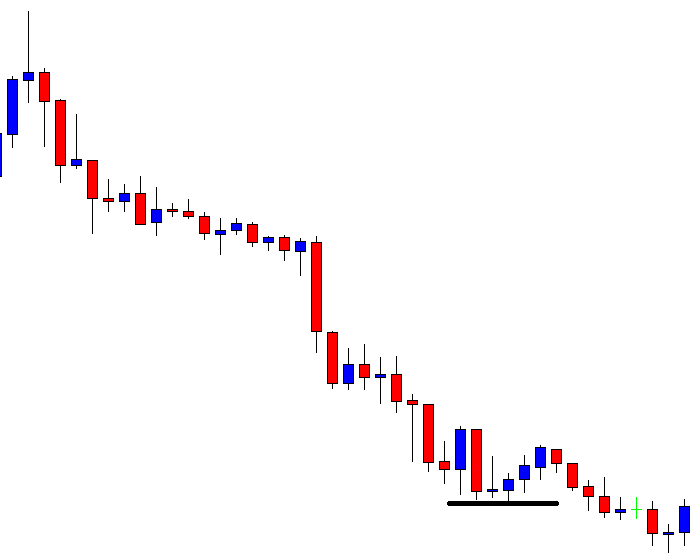
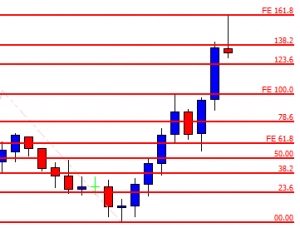
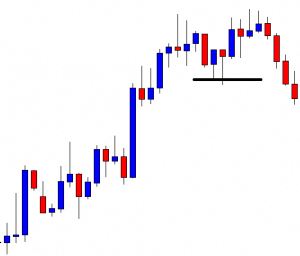
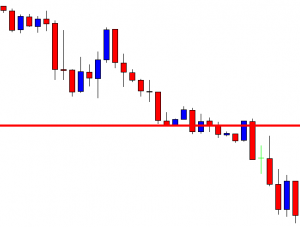
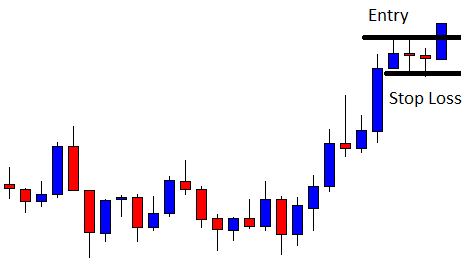
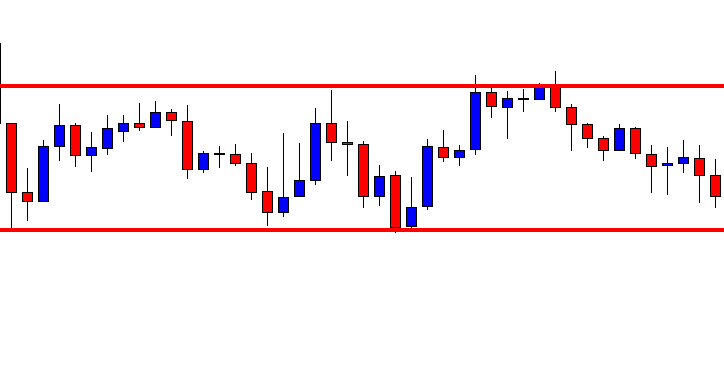
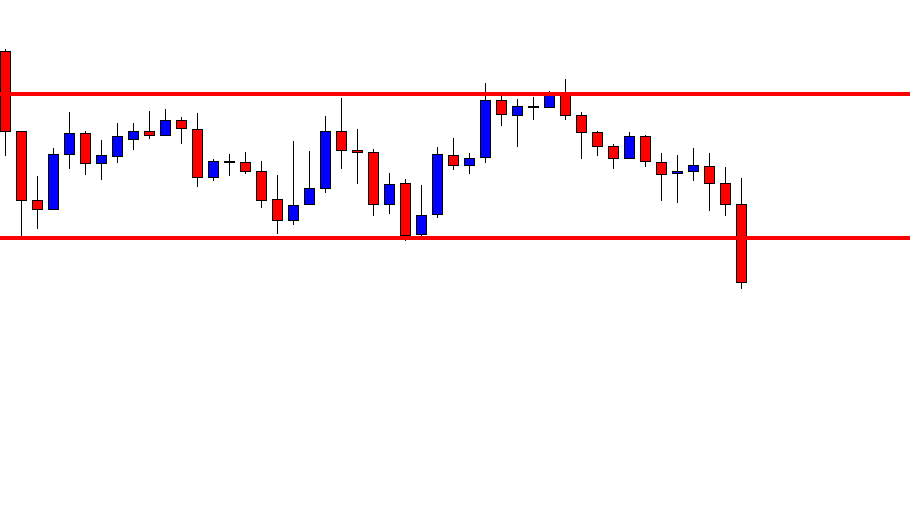
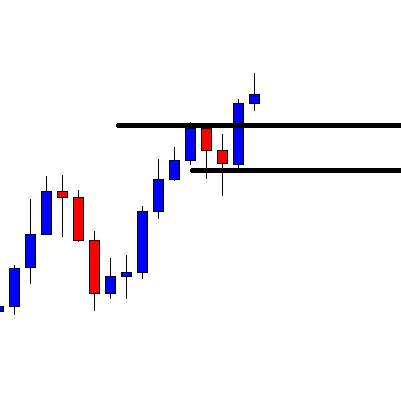
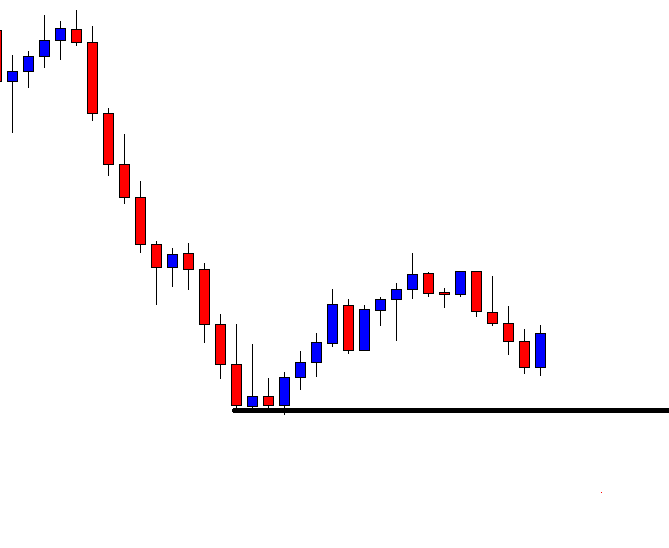
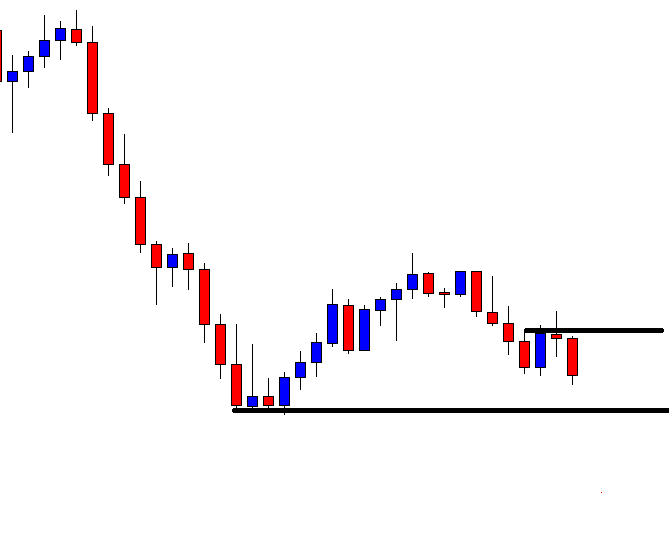
This one is the simple trading approach, which is not much popular, but it often generates wonderful trading results. First of all, you must draw the trend line to the ongoing trend, and when the price action pulls back enough, then draw the price channel to identify the oversold and overbought area. When price action approaches the trend line as well as the lower line of the price channel, it is an indication to go long.

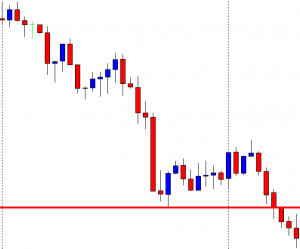
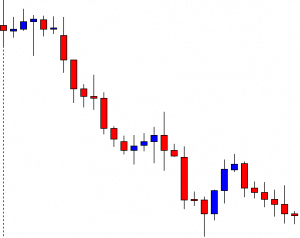
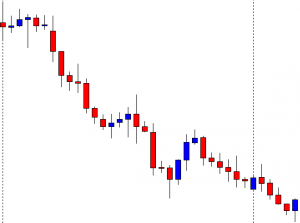
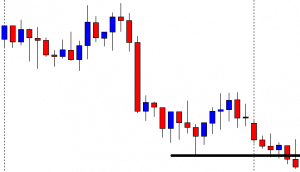
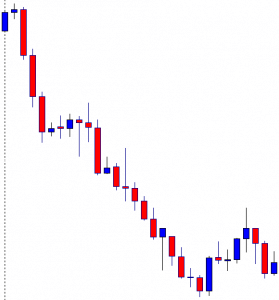
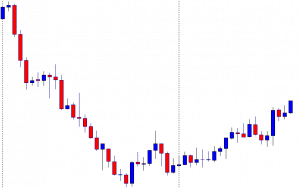
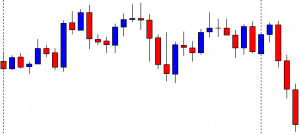
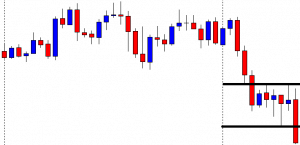
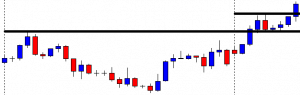
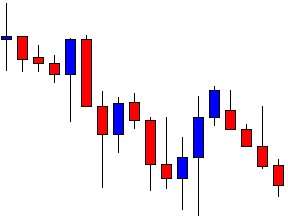
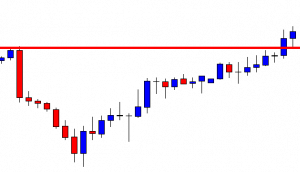
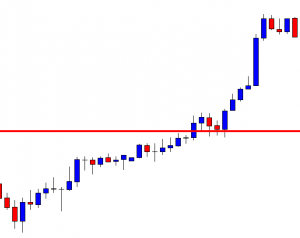
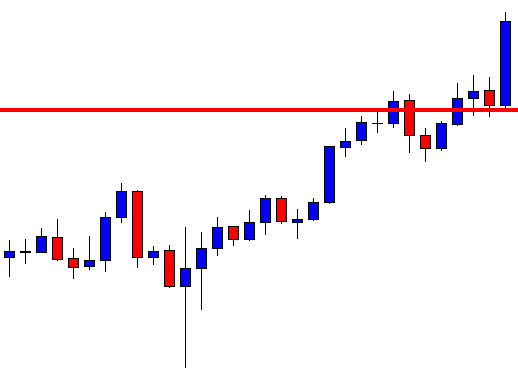
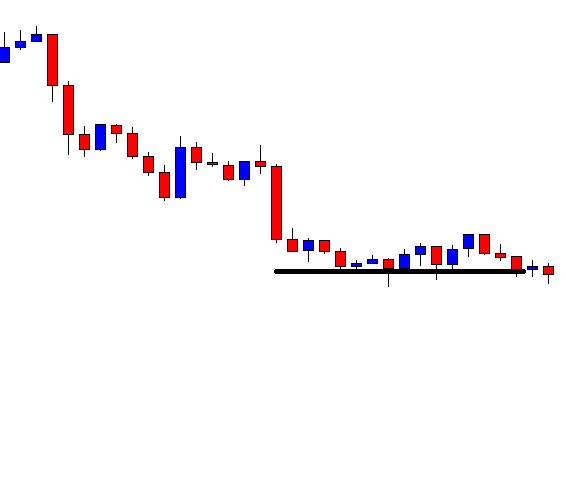
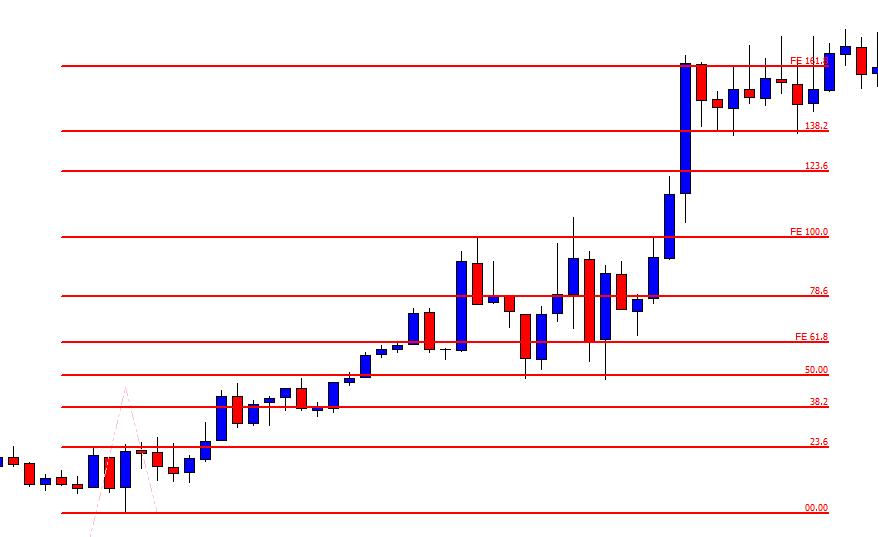
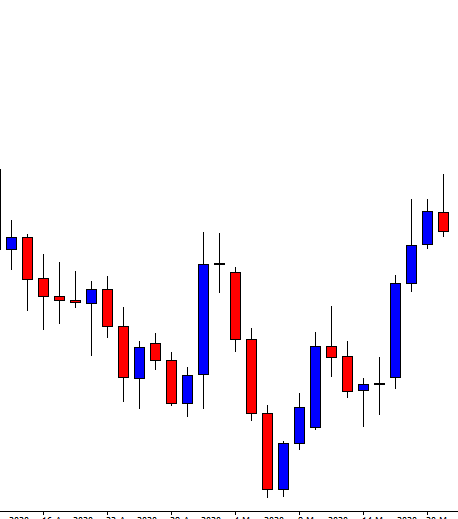
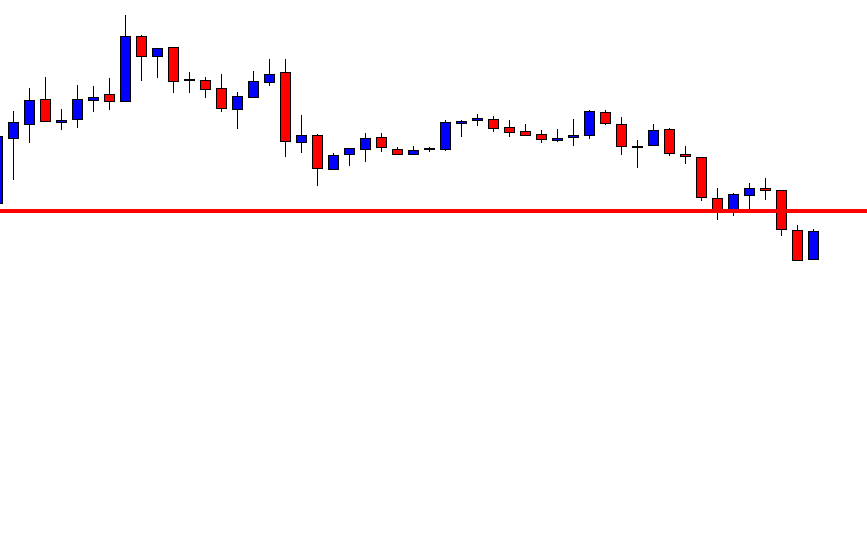
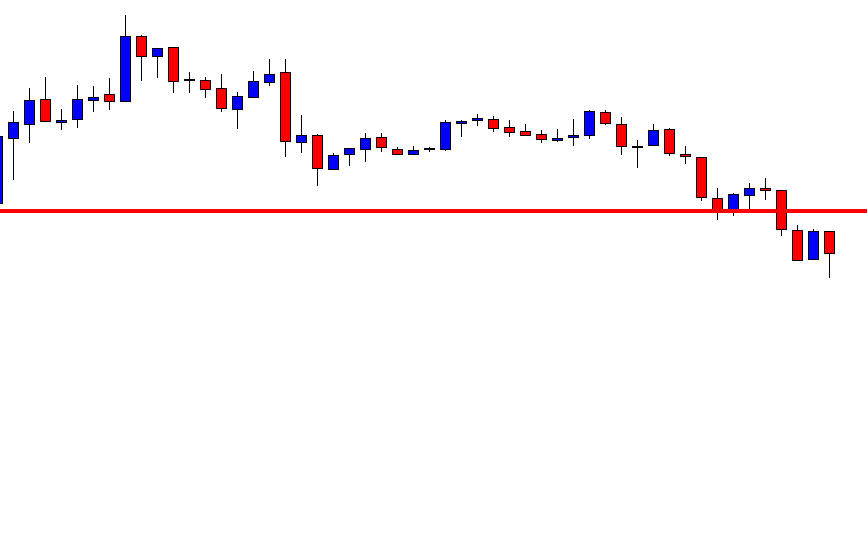
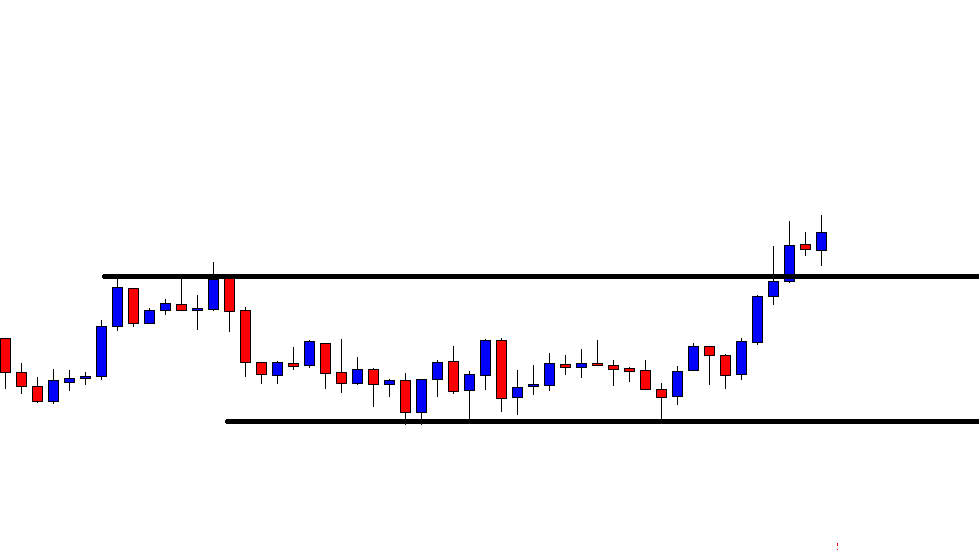
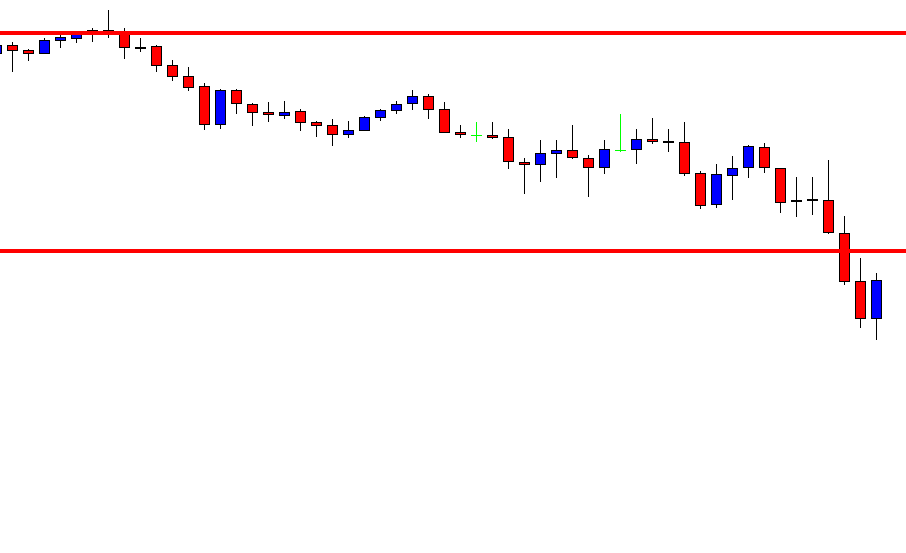
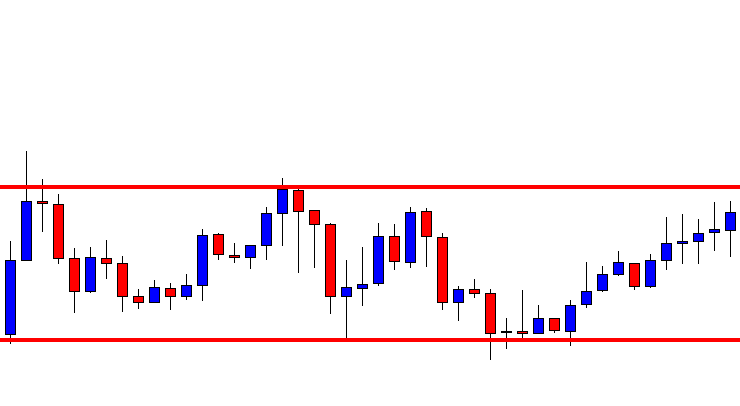
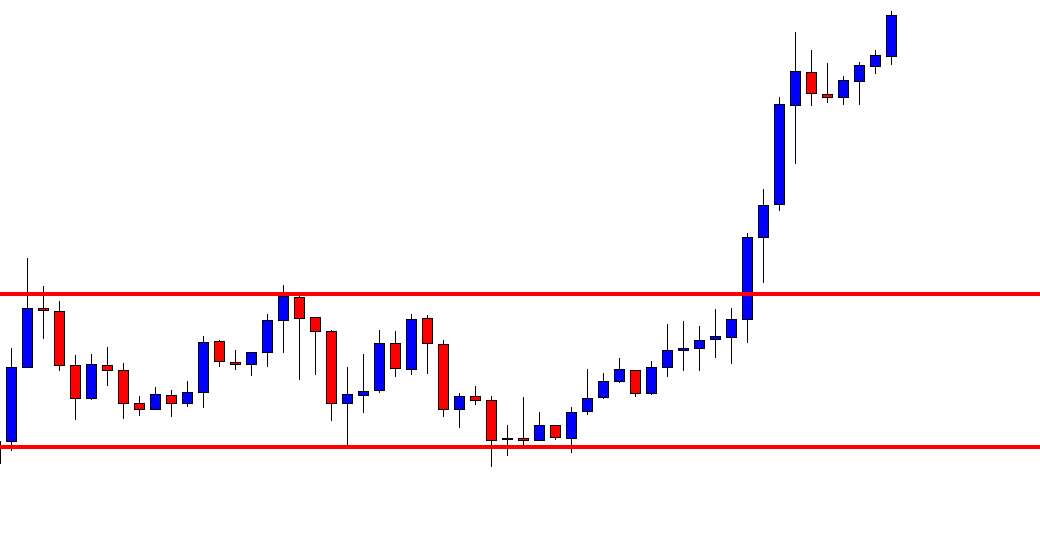
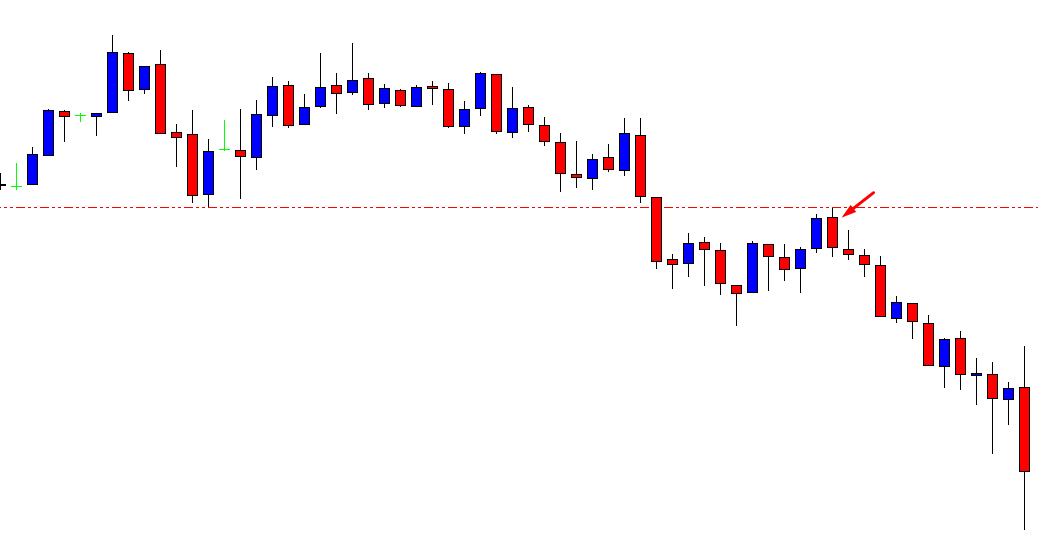
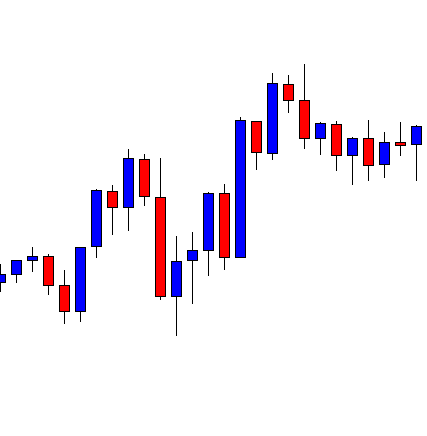
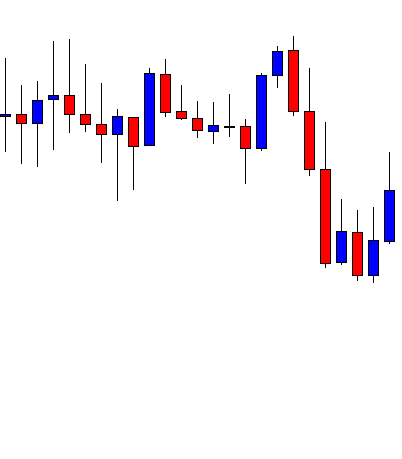
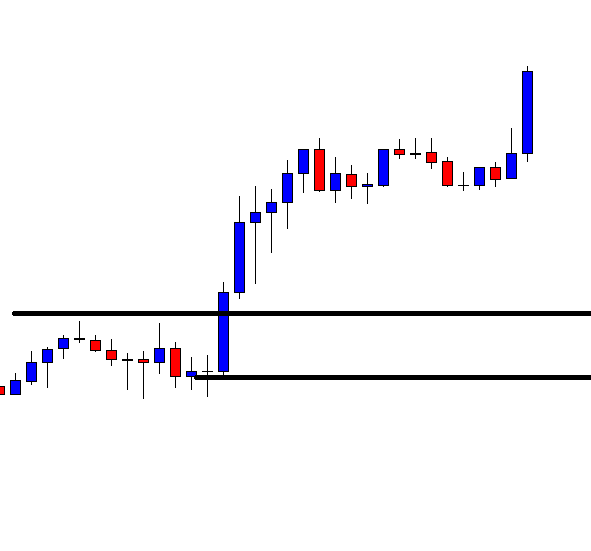
The image below represents the buying entry in the AUDCHF forex pair. The trend line was the indication that the buyers are leading the show. During the pullback phase, when enough sellers approach the trend line and the lower channel line, it gave the strong buying candle. The reason we got the strong candle is because for the support and resistance trader, the zone was a dynamic support area to go long.

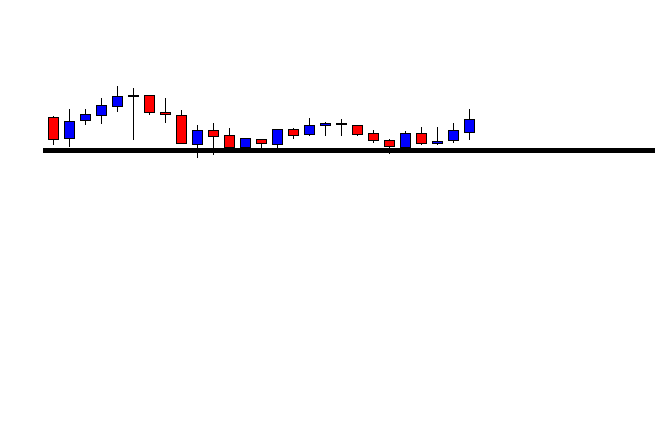
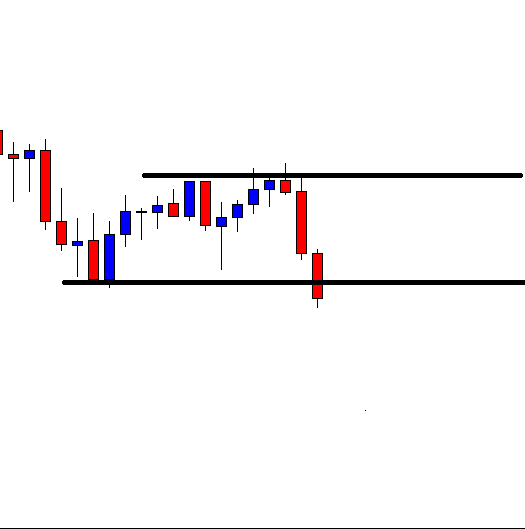
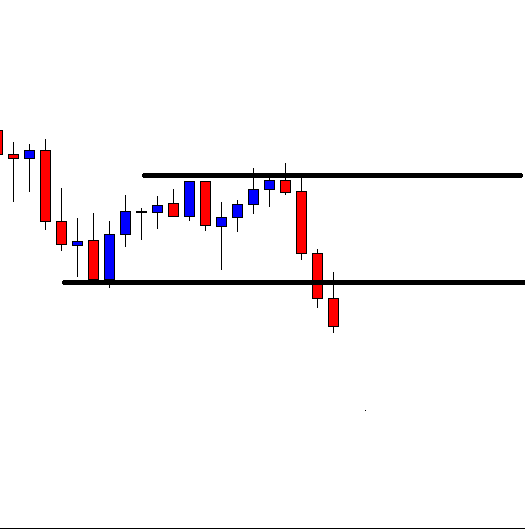
RSI + Stochastic Indicator

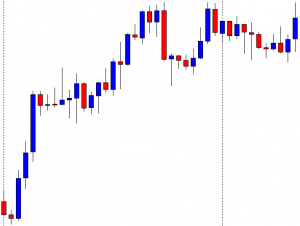
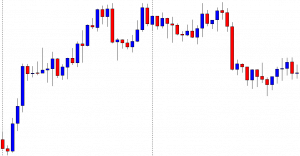
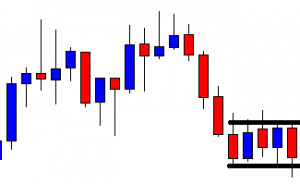
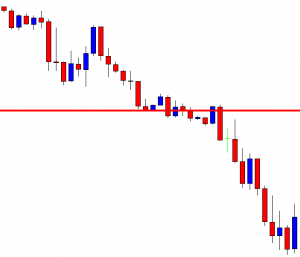
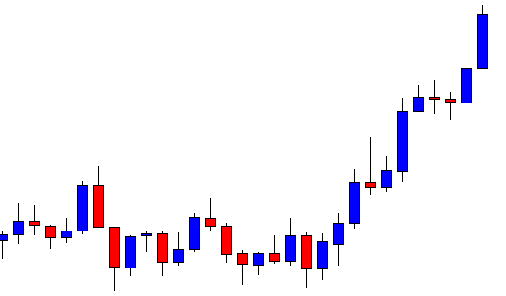
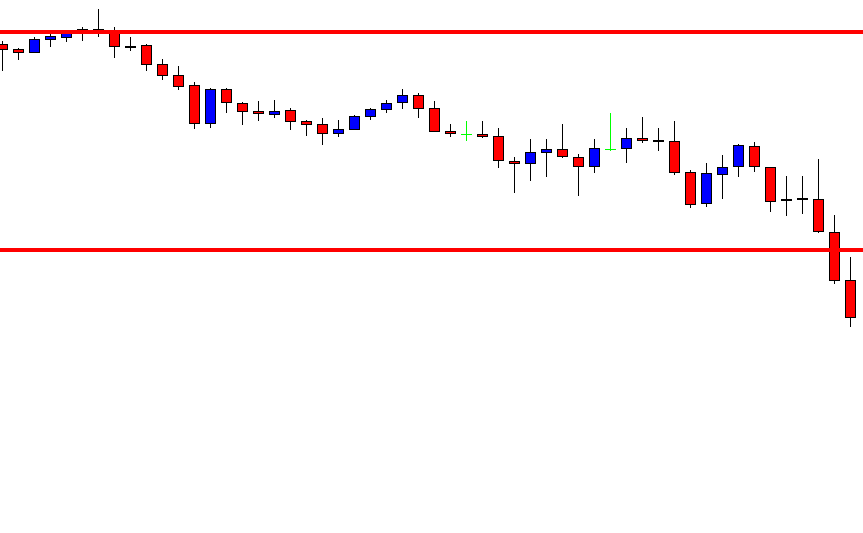
In this approach, we are using the two oscillators to trade the pullbacks. Stochastic and RSI both are oscillators, and they both oscillate between the significant levels. In an uptrend, wait for the price action to pull back. When the stochastic and RSI gave the oversold signal, it is a perfect time to go for a brand new higher high.

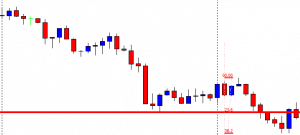
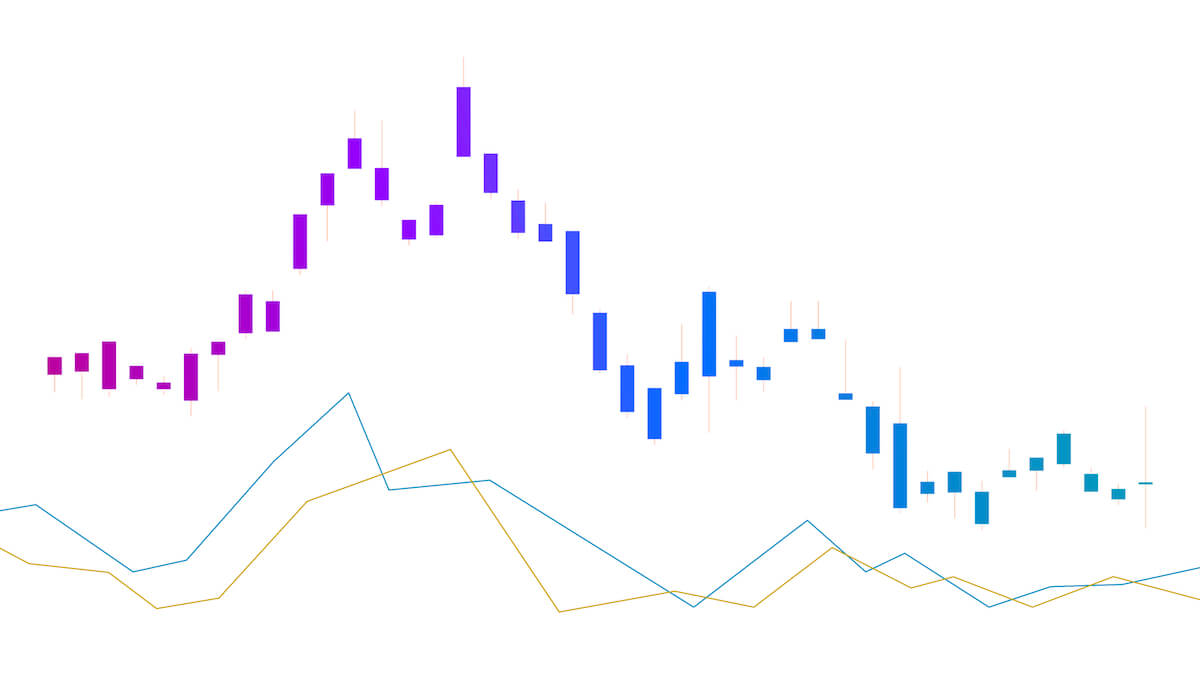
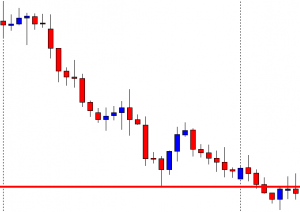
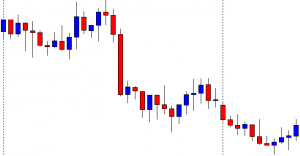
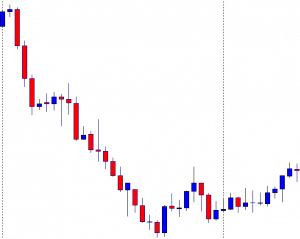
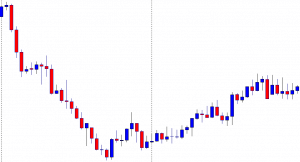
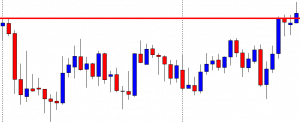
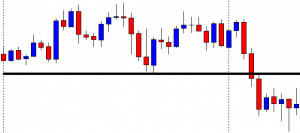
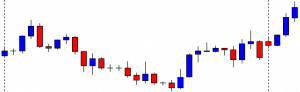
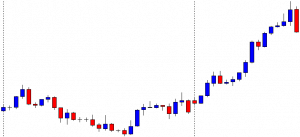
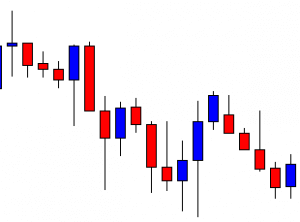
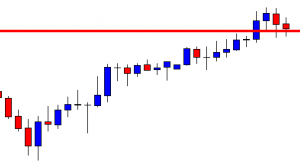
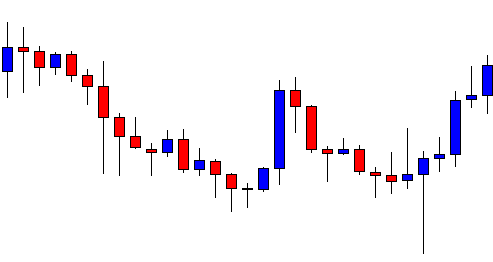
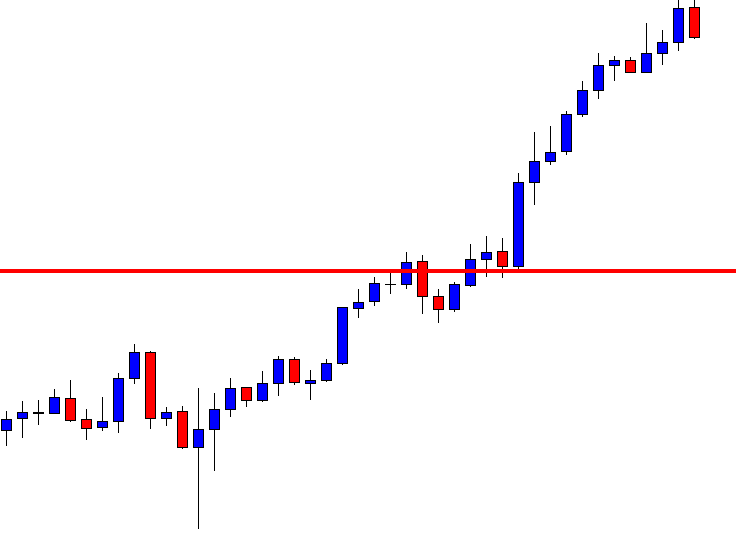
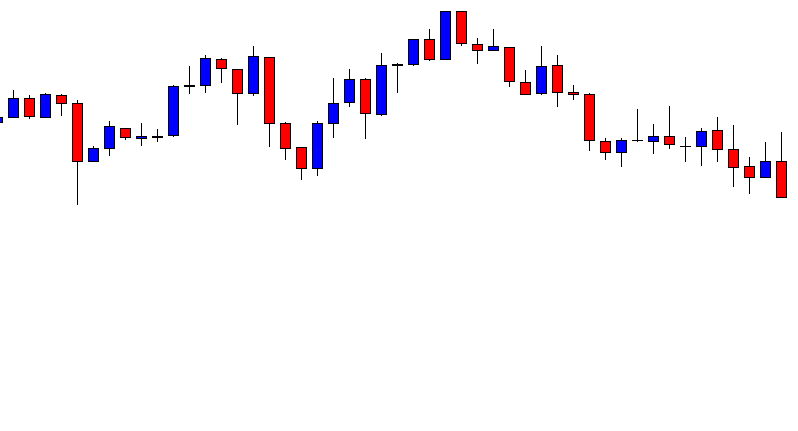
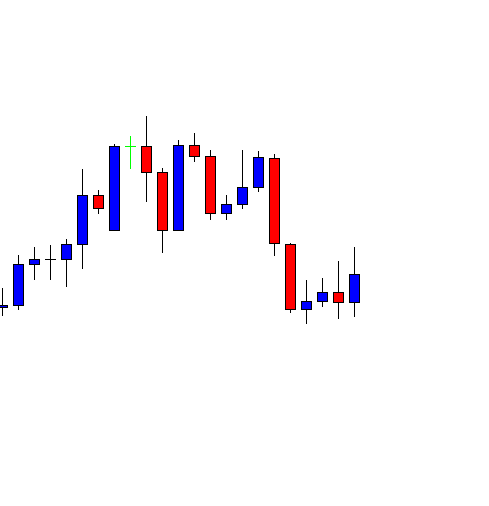
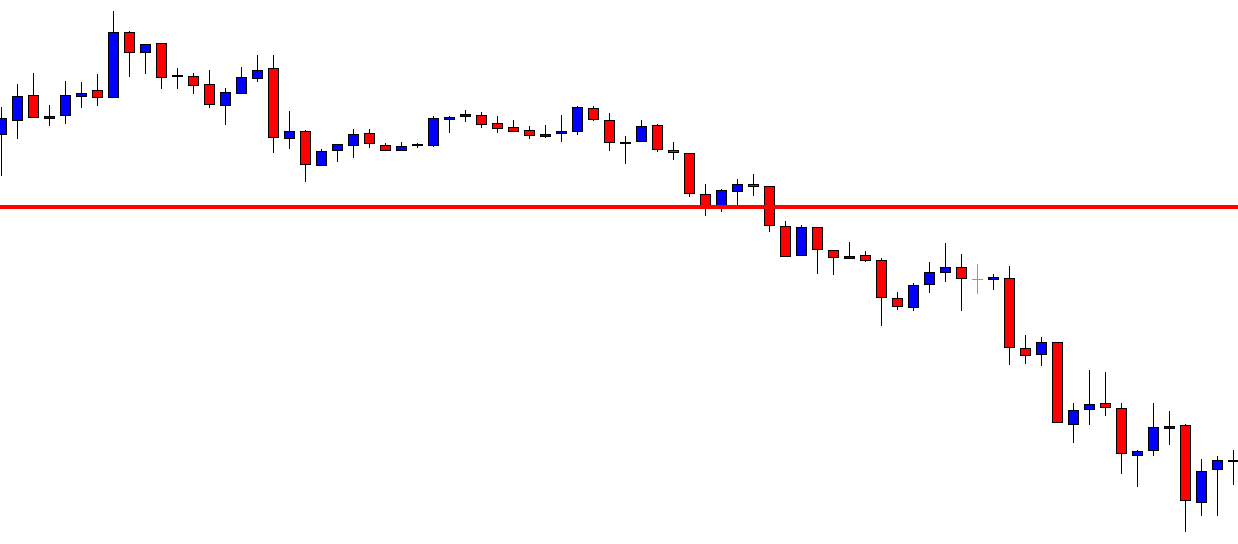
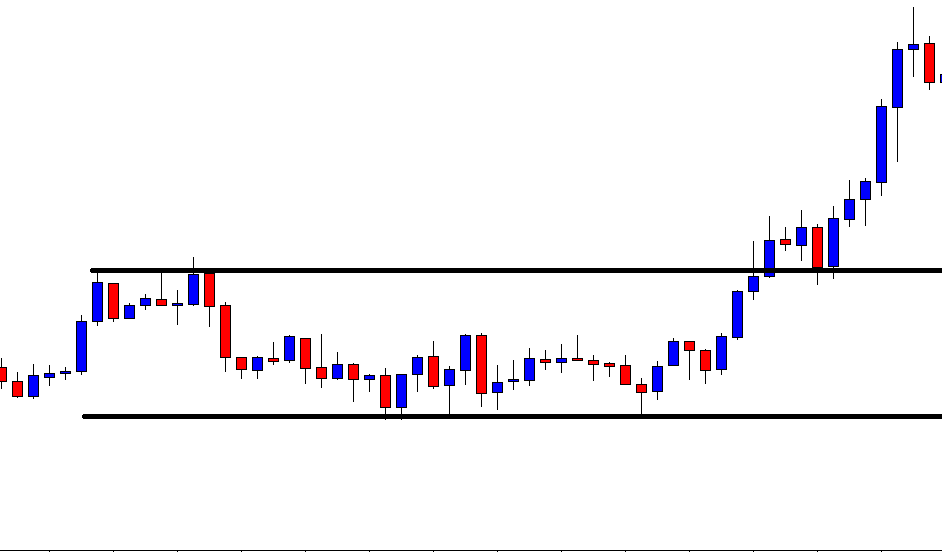
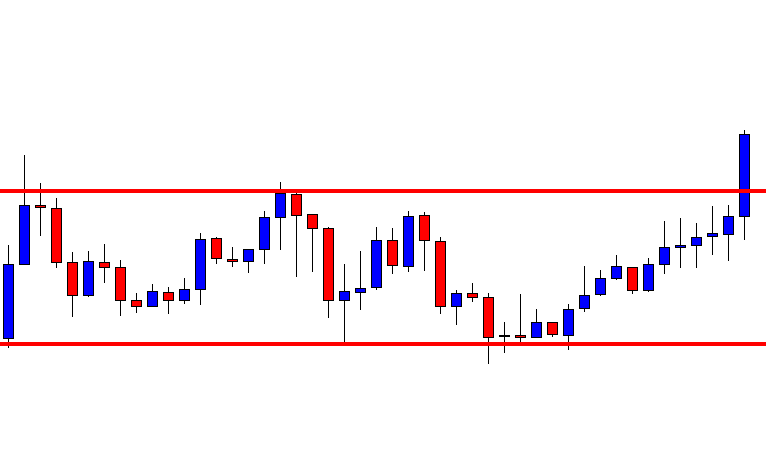
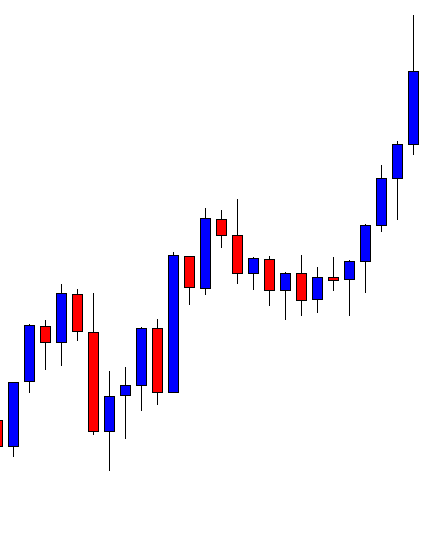
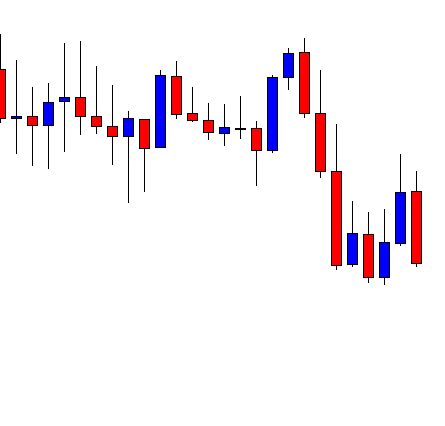
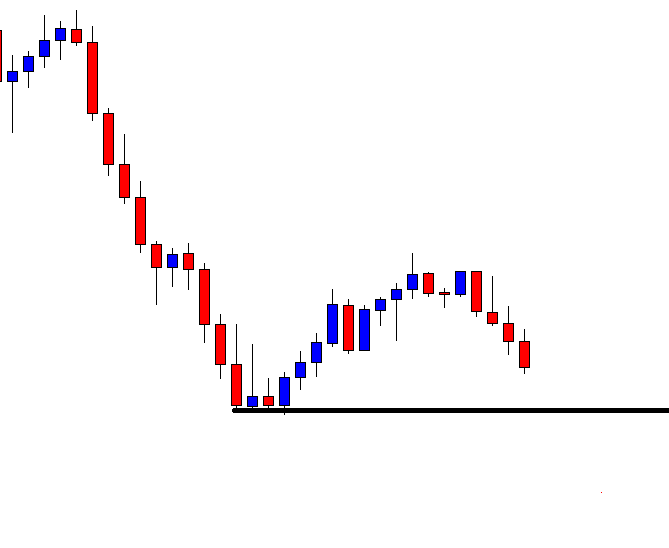
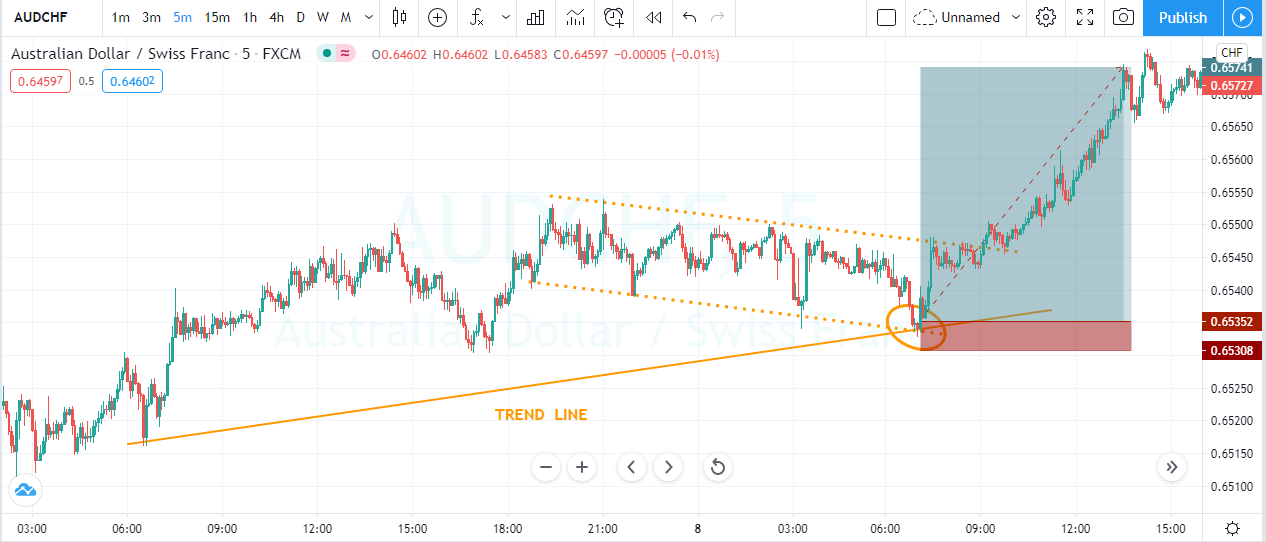
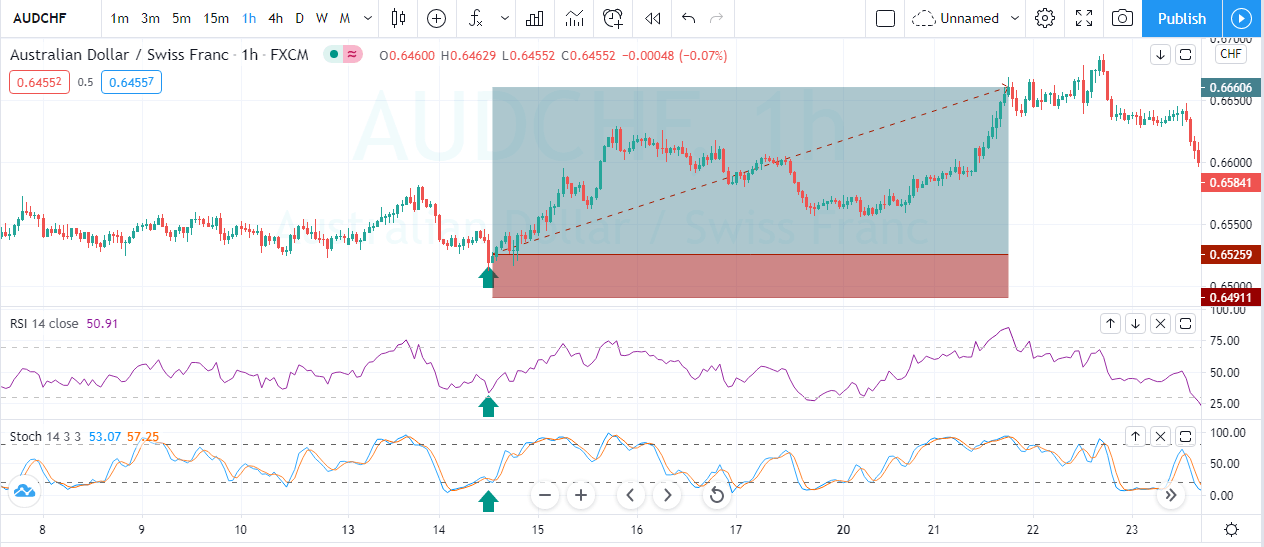
The image below indicates the buying trade in the AUDCHF forex pair. The pair was overall in an uptrend, and during the pullback, both of the indicators were showing the oversold signals, and the reversal at the oversold area was a great sign to go long. When both oscillators indicate the same sign, there is no point in going for more significant stops. When both oscillators gave the reversal signal at the significant resistance level, that’s a perfect time to close your trade.

Conclusion

All the pullback strategies share the same goal, which is to time the market. The better you master the skill of timing before the take-off, the more profits you will make. If you are a newbie trader, then master these strategies first on the demo and then apply to the live market because trying any of these strategies in the live market is dangerous without having any experience.

So never try anything on the live account. Instead, practice them on demo first and then make a profit on a live account. When you master these strategies, then you can very easily design a pullback strategy for yourself. Whichever strategy fits nicely into your trading approach, master it.
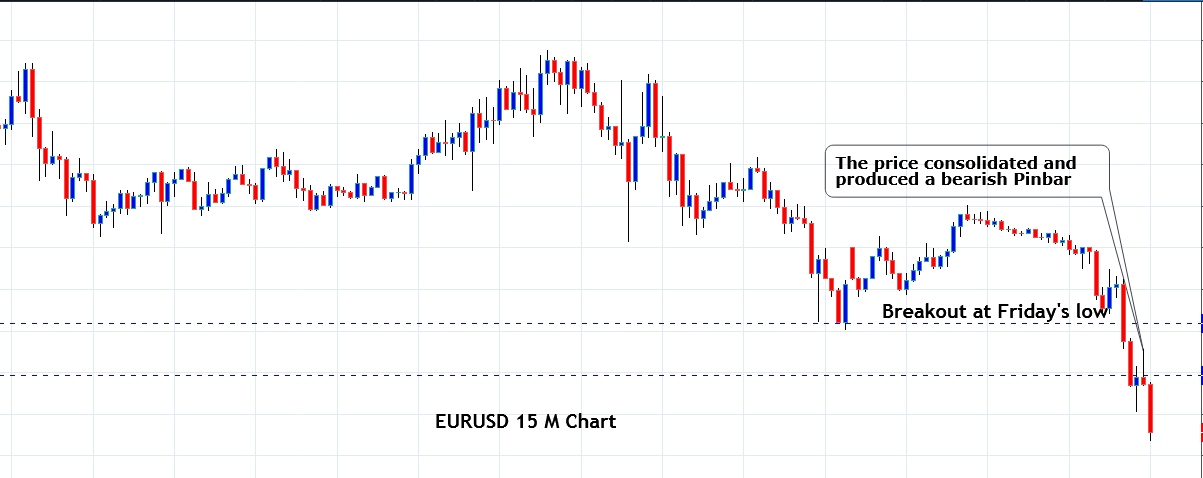
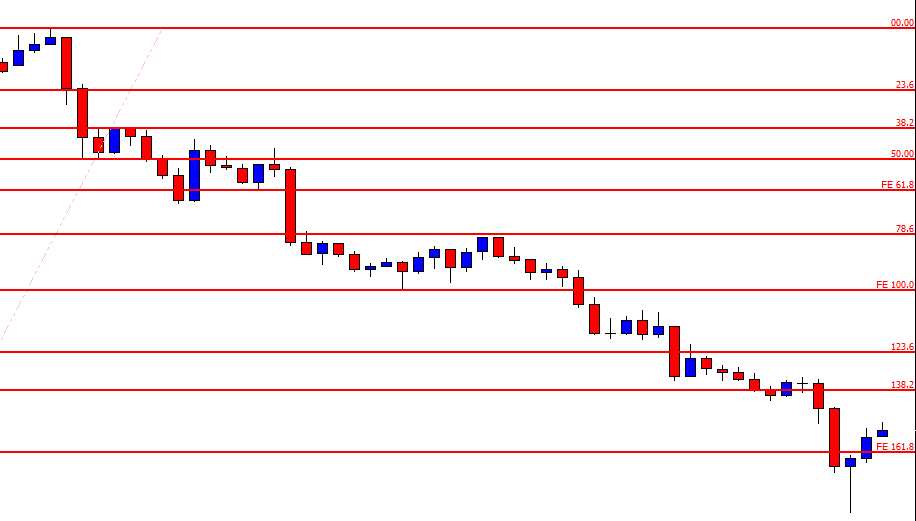
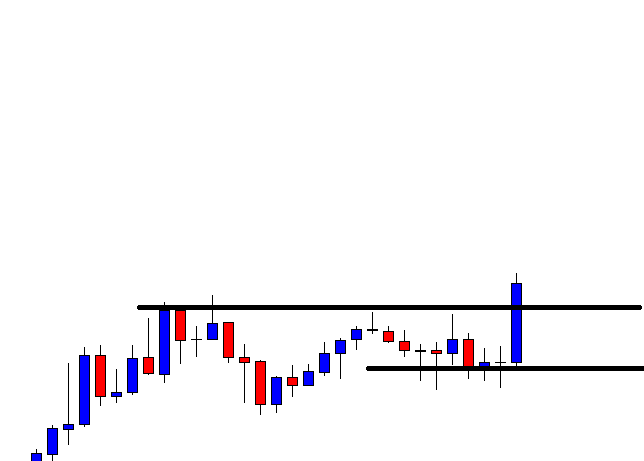
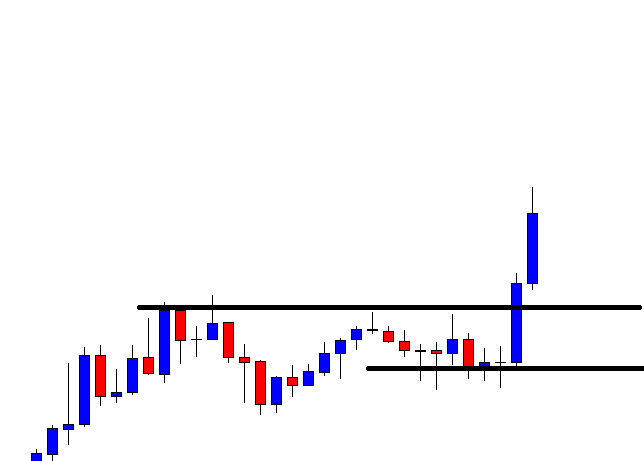
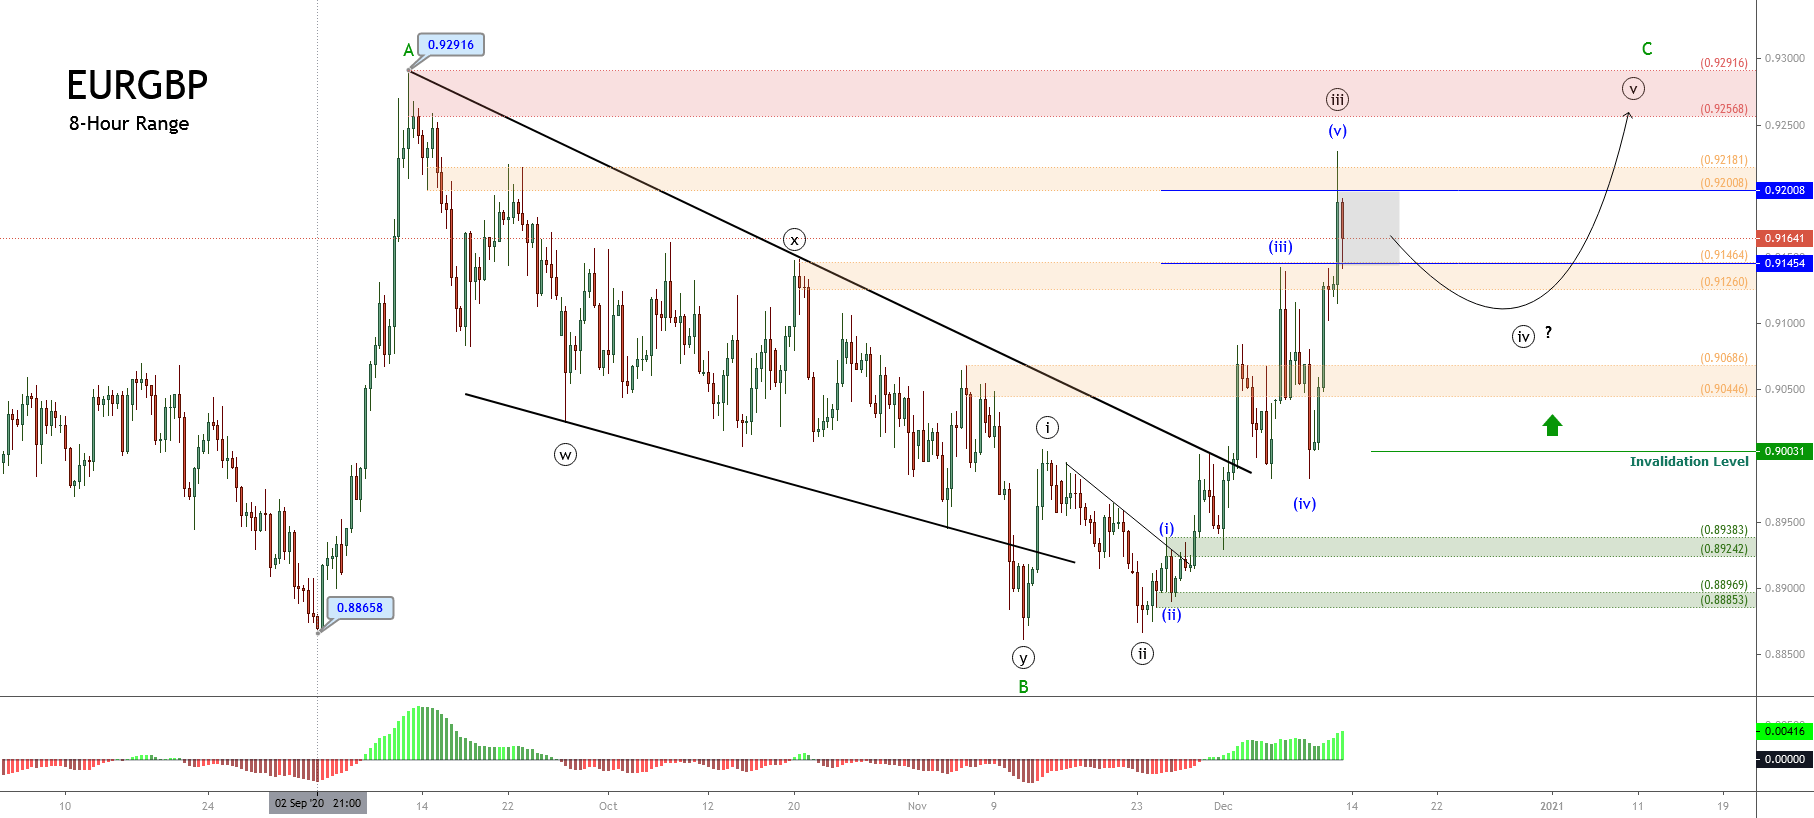
Categories
Forex Daily Topic Forex Price Action

How to Professionally Deal with Fake Breakouts!

In today’s lesson, we are going to demonstrate an example of an H4 breakout at the weekly low. The price consolidates after the breakout and produces a bearish reversal candle right at the breakout level. It is a matter of time for the sellers to go short and drives the price towards the South. Let us find out what actually happens.

The chart shows that the price makes a good bearish move. It finds its support where the pair is traded for a while. The pair closes its week by producing a bearish candle. By looking at the chart, it looks that the sellers are going to keep their eyes on the chart next week.

The pair produces a bullish engulfing candle to start its trading week. The buyers on the minor charts may push the price towards the North. However, the H4 chart is still bearish biased.

The chart shows that the price may have found its resistance. The price has been in consolidation for a while. The last candle comes out as a bearish engulfing candle. The price may make its move towards the South now.

The chart produces consecutive bearish candles and makes a breakout at the last week’s low. The pair is traded below the breakout level for two more candles as well. The sellers are to wait for the price to consolidate and produce a bearish reversal candle followed by a breakout at the consolidation support to go short in the pair.

The chart produces a bullish engulfing candle closing within the breakout level. The next candle comes out as a bearish inside bar. The sellers would love to get a bearish engulfing candle closing below the bullish candle’s low. However, a breakout at the consolidation support would signal the sellers to go short in the pair. By drawing Fibonacci levels on the chart with Fibonacci extension, we see that the price finds its support at the level of 38.2% and finds its resistance at the level of 23.6%. In a word, the stage is getting ready for the Bear to make a move.

The chart produces a bullish candle. It is not a good sign, but the sellers still have hope. If the chart produces a bearish reversal candle again followed by a breakout at the level of 38.2%, the game is on for the sellers.

Now, the chart produces another bullish candle and heads towards the North. The sellers must be very disappointed since it seemed such a nice trade setup for them. The reality is it often happens to all traders. No point in being disappointed, but it must be dealt with professionalism.

Categories
Forex Price Action

Disobeying the Breakout

In today’s lesson, we will demonstrate an example of a chart that makes a breakout, consolidates, and produces a reversal candle. However, it does not make a breakout at consolidation support. Thus, it does not offer an entry. Nevertheless, it makes a move towards the breakout direction later. We try to find out whether breakout traders find an entry from that move or not.

The chart shows that the price makes a long bearish move. It finds its support where it bounces twice. The chart ends its trading week by producing a Doji candle. The next week should be interesting.

The chart produces a bullish engulfing candle. The buyers may wait for the price to make a breakout at the last swing high. On the other hand, the sellers are to wait for the price to make a breakout at the last week’s low.

The chart produces a spinning top, and the price heads towards the South. It makes a breakout at the last week’s low. Thus, the sellers may keep an eye on this chart for the price to consolidate and produces a bearish reversal candle to offer them a short entry.

It produces a bullish engulfing candle. It is a strong bullish candle. However, the breakout level is still intact. If the level produces a bearish reversal candle followed by a breakout at consolidation support, the Bear may keep dominating in the pair.

The chart produces a Doji candle followed by a spinning top right at the breakout level. The sellers may go short below consolidation support. It looks it is a matter of time for the Bear to make a long move towards the South.

The chart produces a bullish candle breaching the breakout level. It spoils the sellers’ party. The weekly low is disobeyed by the H4 chart. Thus, the H4 sellers may skip taking entry on this chart. The chart becomes no hunting zone for both the buyers and the sellers as far as the H4 chart is concerned. Let us proceed and find out what happens next.

The price makes a bearish move. The pair is trading below the last week’s low. Look at the momentum. The price has been rather sluggish to head towards the South. It is because the pair is traded on other minor charts. As mentioned, if the price disobeys breakout on a chart, it is better not to trade based on that chart. The price may go either way, which makes things difficult for the traders to trade.

Categories
Forex Price Action

Do Not Be Biased, Take Decisions According to the Chart

In today’s lesson, we are going to demonstrate an example of a chart that makes a good bullish move but ends up having a rejection at a double top resistance. The price then shows the potential to make a bullish breakout. However, it has another rejection around the last week’s high and makes a bearish breakout. It looks good for the sellers at the time. We find out what happens afterward.

This is the H4 chart. The price makes a long bullish move. It ranges for a while and then continues its bullish journey again. Look at the last candle on the chart. It comes out as a bearish inside bar. Do not miss the point that the candle is produced right at the resistance, where the price has had a rejection.

The chart produces a bullish candle to start the next week. It then ranges for a while and produces two bullish candles. It seems that the price may head towards the North and makes a bullish breakout at the last weekly high.

It does not. It rather finds its resistance around the same level. Moreover, it produces a bearish engulfing candle. To be more precise, the chart produces an evening star. It is a strong bearish reversal candle. Let us wait and see what the price does next.

The chart produces a long bearish candle breaching the last swing low. The breakout is significant since the price trends from the last weekly low. The sellers may keep their eyes in the pair to go short. Before going short on this chart, the sellers shall wait for the price to make a bullish retracement since the price is within the last weekly range. Keep that in mind that the price is to make a bullish correction to offer a short entry.

The price does not make a bullish correction. It rather consolidates and produces a bearish reversal candle. Since the price is within the last weekly range, so it is not a short signal.

Here it goes. The price gets choppy. This chart becomes a risky chart to trade. Thus, traders might as well skip eyeing on the chart to trade at. At first, it looks good for the buyers. Then, it shows potential for the Bear to dominate since the price has several rejections at the same level. However, it ends up being an extremely choppy chart.  Thus, do not be biased with your initial assumption. Wait for the breakout, confirmation, and then trade.

Categories
Forex Price Action

Some Moves do not Belong to the Chart that You Follow

In today’s lesson, we will demonstrate an example of a chart that makes a breakout at the last weekly low. The price then goes back within the last weekly range and makes an interesting move. We will find out what that interesting move is all about in a minute. Let us get started.

It is the H4 chart. The chart shows that the price makes a bearish move. It finds its support and trades around it for a while. The last candle of the week comes out as a Doji candle. The sellers may keep their eyes on the chart to get a bearish breakout and find short opportunities.

The first candle of the week comes out as a bearish candle. The price heads towards the level of support, and it produces a hammer. The price may roam around the level of support before making its next move. Let us proceed to find out what happens next.

The chart produces two bearish candles. One of the candles closes well below the level of support. The sellers may keep the chart on their watch list closely. They may wait for the price to consolidate and produce a bearish reversal candle to go short in the pair.

The chart produces four candles with a bullish body. The last candle comes out as a commanding bullish candle closing above the breakout level. If the chart still produces a bearish engulfing candle closing below the last swing low, the sellers may still go short in the pair. However, it does not look that good for the sellers.

As expected, the price heads towards the North further. One of the candles closes above the weekly opening as well. It means the H4 sellers may skip eyeing on the chart to go short. The chart does not belong to the H4 sellers anymore. The buyers may go long on the pair upon bearish retracement followed by a bullish reversal candle at the key level of support though. That is another ball game. Let us find out what the price does afterward.

What a strong bearish move that is! The price does not produce a bullish reversal candle. It makes a strong bearish move and makes a new swing low instead. However, the H4 sellers upon weekly high/low breakout may not be able to catch the move. The move belongs to other chart traders. Most probably, the sellers on the daily chart can catch such a move.

We often find such a move that may not offer entry on the chart that we follow. Do not get disappointed. Stick to your chart and trading strategies. Something must be round the corner for you.

Categories
Forex Daily Topic Forex Price Action

Trading Within Last Weekly Range

In today’s lesson, we will demonstrate an example of a chart where the price is having a retracement within the last weekly range. The price produces a double bottom and makes a breakout at the neckline. It then consolidates but does not head towards the North as it normally does when it makes a breakout at weekly high/low. Let us proceed and find out the possible reason behind it.

The price makes a long bearish move and finds its support. Upon producing a bullish engulfing candle, it heads towards the North and comes back again. At the support zone, it produces a bullish inside bar. Let us see what happens next.

The price heads towards the North next week. It means it is trading within the last week’s range. The price is at the last swing high. If it makes a bullish breakout, the buyers may want to go long at its weakness.

The chart produces two bearish candles followed by a bullish engulfing candle closing within the last swing high. It seems that the price may consolidate more to find its way.

The price upon producing a spinning top followed by a bullish engulfing candle makes a bullish breakout at the last swing high. It is a neckline breakout of a double bottom. The buyers may keep their eyes on the chart to go long on its weakness.

The price produces a bearish inside bar followed by a spinning top with a bullish body. Then, it produces a bullish candle closing above consolidation resistance. Since it is a breakout at the resistance, it is supposed to be a buy signal. The question is whether the buyers should trigger a long entry or not. Let us see the next chart.

The price gets choppy, struggling to make a breakout towards the North. The buyers would not love to see such price action after triggering the entry. If the price makes a breakout at the last week high/low, traders wait for the price to consolidate and produce a bullish/bearish reversal candle to take entry upon a breakout. On the other hand, if the price trades within last week’s range, the price usually makes retracement (instead of consolidation) to offer entry. The Fibonacci level, such as the 38.2% and 61.8%, play a significant role in producing the reversal candle. In today’s chart, the price is in the weekly range. Thus, traders are to wait for the price to make a retracement to offer them entry. It rather consolidates, which ends up making the price choppy.

Categories
Forex Daily Topic Forex Price Action

Weekly High/Low Breakout Trading: Count the Breakout Candle’s Attributes

In today’s lesson, we are going to demonstrate an example of an H4 breakout at the last week’s high. However, the price does not head towards the North as it usually does. Let’s find out why that happens.

The chart shows that the price after making a strong bearish move gets choppy. The H4 traders may wait for the price to make a breakout at either side. A bullish breakout may attract the buyers to go long in the pair. On the other hand, the sellers may wait for the price to make a bearish breakout.

The price produces a bearish candle to start the next week. The price finds its support, and it heads towards the North. However, the last weekly high is still intact. The buyers must wait for the breakout at the level to go long.

The price finds its intraweek resistance. It comes down. Intraweek support holds the price and produces a bullish inside bar. It is not a strong bullish reversal candle. However, it is produced at double bottom support. Let us wait and see whether it makes a breakout at the neckline or not.

The price heads towards the North and makes a breakout at the neckline. The candle closes within the last week’s high and consolidates. It then produces a bullish candle closing above the last week’s high. However, the candle has a long upper shadow. Considering its upper shadow, traders do not usually get attracted to trade upon such a breakout candle.

As anticipated, the chart produces some bullish candles with long upper shadow after the breakout. The price heads towards the North with a sluggish pace. It then produces a bearish Pin Bar and drives the price towards the breakout level again. A bullish reversal candle closing above consolidation resistance may attract the buyers to go long in the chart again. Let us find out what happens next.

The chart produces a long bearish candle with long lower shadow. The pair is trading within the last week’s range again. The H4 buyers have lost their hope. They may skip eying on the chart to concentrate on somewhere else.

If we look back, a double bottom, along with a breakout at the last week’s high, do not push the price towards the North. Most probably, this is because of the breakout candle’s attributes. We may still keep an eye on such a chart, but it would be wise to concentrate more on those charts, which makes a breakout with a commanding candle.


Categories
Forex Course

147. How To Detect A Fakeout like a professional Forex trader?

Introduction

It is a general perception among Forex traders that the fakeouts are caused by the banks and large institutional players to stop retail traders players from moving the market in their desired directions. Although there is no evidence to prove this theory, we believe it is true. The manipulation is done by the big players. A fakeout is simply a failed breakout, and most of the time, they occur at significant areas like support, resistance, trend lines, Fibonacci retracement levels, and chart patterns, etc.

Typically, fakeouts are the result of a battle between both the parties on the price chart. So if you are witnessing a range and if we see both the parties printing aggressive candles, we can expect more fakeouts. The same applies to the trending markets as well. The aggressive battle between the buyers and sellers for domination leads to frequent fakeouts.

Trading Fakeouts

It is a common perception that it is impossible to trade these fakeouts, but that is not true. We can trade fakeouts, but a lot of market understanding is required to do so.

#1 Strategy 

The image below indicates a fakeout followed by an actual breakout in the EUR/GBP Forex pair.

As we can see below, when the price breaks above the breakout line, it started to hold there. If it didn’t hold, it means that the price goes above and came back into the range. So in our case, hold above the breakout line confirms that the price is not going to fake out, and riding the buy trade from here will be a good idea.

#2 Strategy 
Buy Example

The image below indicates a false breakout in this Forex pair.

As you can see below, we choose to enter a buy trade after the price action fakes below the major support area. We can see that it is eventually coming back and holding at the support area. This holding support clarifies that the sellers failed to move the market.

Now buyers are coming back and holding the market to go for a brand new higher high. We can see that price action respecting the trendline for a while, but then it breaks above the line, printing a brand new higher high.

Sell Example

The image below indicates the appearance of a faker on the EURGBP sixty-minute chart.

The image below represents our entry, exit, and stop-loss in this Forex pair. The pair was in an uptrend, and as it tries to go above the resistance line, it immediately came back and stated holding below the resistance line. This confirms the faker, and after our entry, prices go back to the most recent lower low.

That’s about identifying Fakeouts and how to trade them. Please be sure to trade these fakeouts only when you are absolutely sure about them. All the best.

Categories
Forex Daily Topic Forex Price Action

Count the Breakout Length

In today’s lesson, we are going to demonstrate an example of a chart where the price makes an H4 breakout at the last week’s low. However, the chart does not offer entries. It rather gets choppy. We will try to find out the reason behind that. Let us get started.

It is an H4 chart. The chart shows that the price makes a bearish move and had a bullish correction. Upon producing a bearish engulfing candle, it heads towards the South again. The market is about to close for the weekend, and the sellers are going to wait for the H4 chart to make a bearish breakout and go short in the pair.

The chart produces a Doji candle to start its trading week. The next candle comes out as a bearish engulfing candle. It seems that the pair is going to make an H4 breakout at the week’s low soon.

The chart produces a long bearish candle closing well below the week’s low. It does not consolidate but produces a spinning top with a bearish body. The chart looks bearish, and the sellers may love to wait for the price to consolidate and to offer them a short entry. The question is whether they should wait to go short in the pair or not.

Look at those two drawn lines. One at the above indicates the highest high of the current week. The other one at the bottom indicates the lowest low of the last week. The difference between these two lines is vital. It determines the length of the next move. Usually, the price travels twice the distance of that length with good momentum. Once it travels three times that distance, the price usually makes longer consolidation or correction. The price travels three times that distance here. Thus, it may make a long bullish correction.

The chart produces a bullish engulfing candle followed by another bullish candle closing within the last week’s lowest low. The chart then creates an inverted hammer and drives the price towards the South. Look at the pace of that bearish move. It has been sluggish, and it suggests that the sellers are not interested in going short in this chart. The price has been roaming around the last swing low for quite a while. In a word, the H4 traders must wait for the price to give them the next direction. Meanwhile, it is a chart not to invest money and time in.

Categories
Forex Daily Topic Forex Price Action

Weekly High/Low Offers a Better Reward in the H4 Chart Trading

We are going to demonstrate an example of a trade setup on the H4 chart. The price, after breaches the last week’s low; it consolidates and produces a strong bearish reversal candle. It then heads towards the South with extreme bearish momentum. Let us find out how that happens.

It is an H4 chart. Look at the vertical line on the left. It is the beginning of the week. The chart shows that the price gets trapped within two horizontal levels. The pair is about to finish its trading week. The chart suggests that both the sellers and the buyers are going to keep their eyes on the chart next week to get the breakout and trade.

The pair produces two bullish candles consecutively to start its trading week. However, it produces a bearish engulfing candle and drives the price towards the South. Do you see anything here? Yes, the pair makes a breakout at the last week’s low. It means that the Bear may dominate on the H4 chart. Ideally, traders are to wait for the price to consolidate or make a bullish correction followed by a bearish breakout to go short in the pair.

The price consolidates. It produces some bearish reversal candles such as spinning top, hammer, Doji candle. However, it does not make a breakout at the last swing low. The sellers must wait for an H4 candle to close below consolidation support. Let us wait for more and see what the price does.

The chart produces a bearish engulfing candle closing well below consolidation support. The sellers may trigger a short entry right after the last candle closes. They may set their stop loss above consolidation resistance and set their take profit with 2R. This is the beauty of using weekly high/low and the H4 chart. It offers an excellent reward. Let us now proceed and find out how the entry goes.

The price heads towards the South with good bearish momentum. It produces three bullish inside bars in this move. The last candle comes out as a bullish engulfing candle. The sellers may consider closing their entry and come out with the profit. If we count, we find that the entry offers more than 2R reward. This is what usually happens when the price makes an H4 breakout at the last week’s high/low. Deep consolidation and a strong reversal candle add more fuel to its journey as usual. In our fore coming lessons, we will learn to integrate Fibonacci levels in this strategy to determine our target with better accuracy. Stay tuned.

Categories
Forex Daily Topic Forex Price Action

Using Weekly High or Weekly Low in the H4 Chart Trading

The Weekly high or Weekly low plays a significant part in the H4 chart traders. In today’s lesson, we will demonstrate an example of how last week’s high works as a level of support and pushes the price towards the upside by offering a long entry to the buyers. Let us get started.

It is an H4 chart. Look at the vertical dotted line. The price starts its week with a spinning top having a bullish body. The price then heads towards the North and come down again. In the end, the price closes its week around the level where it starts its trading week.

The pair starts its week with a spinning top having a bearish body this time. The price heads towards the North and makes a breakout at the last week’s high. The price usually comes back at the breakout level to have consolidation and ends up offering entry upon producing a reversal candle. Let us draw the breakout level to have a clearer picture.

The drawn line indicates the last week’s high. Now, the H4 chart suggests that the price made a breakout, and the pair is trading above the level currently. The buyers are to wait for the price to consolidate and produce a bullish reversal candle to go long in the pair.

The chart produces a bearish candle closing within the breakout level first. The next candle comes out as a Doji candle. The buyers are to wait for a breakout at consolidation resistance to go long in the pair. Let us proceed to the next chart to find out what the price does next.

The chart produces three more bullish candles. One of the candles breaches through the level of resistance closing above it. The buyers may trigger a long entry right after the last candle closes. The buyers may set their stop loss below the breakout level. To set the take-profit level, the buyers may set their take profit with 2R. It is the best thing about this trading strategy. It offers at least 2R. Sometimes the price travels even more than 2R. Let us find out how the trade goes.

The price heads towards the North with good bullish momentum. Before hitting 2R, it produces a bearish inside bar. It continues its journey towards the North and travels more than 2R. The last candle comes out as a bearish engulfing candle. It suggests that the price may get bearish now.

The best things about using the strategy are

  1. Traders know where the price is going to consolidate.
  2. Which level is going to produce the signal candle.
  3. It offers an excellent risk-reward.
Categories
Forex Signals

GBPAUD Raises After Intraday Breakout

Description

The GBPAUD cross advances on the first trading session o Monday in its of the week boosted by the risk-off sentiment in the currency market.

From the GBPAUD chart, in its hourly timeframe, we distinguish the intraday breakout after the price failed its intraday decline founding support at 1.76331, from where fresh buyers took the market bias control boosting the price to surpass and break the descending intraday trendline.

In this regard, the consolidation above the downward trendline added to the 135-hour moving average leads us to expect a bullish movement that could advance toward the September 17th high located at 1.78394, where the cross could find resistance.

Our bullish foresees an upward move from the zone of 1.7718 with a potential profit target at 1.7838. The invalidation level of our scenario is located at 1.7648 that coincides with the last daily low.

Chart

Trading Plan Summary

  • Entry Level: 1.7728
  • Protective Stop: 1.7648
  • Profit Target: 1.7838
  • Risk/Reward Ratio: 1.38
  • Position Size: 0.01 lot per $1,000 in trading account.


Check out the latest trading signals on the Forex Academy App for your mobile phone from the Android and iOS App Store.

Categories
Forex Price Action

Fibonacci Trading: Fibonacci Levels Maximize Profit for Intraday Traders

In today’s lesson, we are going to demonstrate an H1 chart offering an entry by using intraday support/resistance. To go with it, Fibonacci levels are used to spot out the stop-loss and take-profit levels. Let us now get started.

The chart shows that the price makes a long bearish move. The H1 chart makes a breakout at the last day’s lowest low (black drawn line). Usually, the chart attracts the sellers to look for short opportunities upon getting a bearish reversal candle. However, look at the combination of the last three candles. It is called Morning Star, which is one of the strongest bullish reversal patterns.

The price heads towards the North and goes back in the last day’s lowest low. Moreover, it makes a breakout at today’s highest high as well (black drawn line). Within four candles, the chart looks good for the buyers. The buyers may look to go long in the pair upon getting a bullish reversal candle at the breakout level.

The chart produces a bearish candle. The breakout level seems to hold the price as a level of support. A bullish reversal candle at the level may attract the buyers to go long and push the price towards the North further.

Here it comes. The chart produces a bullish engulfing candle right at the breakout level. The buyers may trigger a long entry right after the last candle closes by setting stop loss below the lowest low of the signal candle. We are going to talk about the take profit level in a minute. Let us find out how the trade goes.

The chart produces a bullish candle. The price heads towards the upside with the next candle as well. However, the candle comes out as a Doji candle having a long upper shadow. It suggests that the price may make a bearish correction or make a bearish reversal. Since the trade setup is based on the H1 chart, the buyers may lose a good number of pips if they are to wait for the chart to produce a reversal candle to close their entry. It is tough to manage trade in the H1 chart manually. Thus, setting the take profit is the best way. The question is, where should we set our take profit? In this regard, Fibonacci levels come extremely handy. Let us draw the Fibonacci levels in the chart and find out how they work in the chart above.

There you go. The price produces a bullish reversal candle at 61.8% level and heads towards the level of 161.8%. It means the buyers may achieve 1:2 risk-reward easily by using Fibonacci levels in intraday trading. In our fore coming lessons, we are going to demonstrate more examples of integration of Fibonacci levels and intraday trading. Stay tuned.

Categories
Forex Daily Topic Forex Price Action

A Classic Example of Trading on a Double Top

Last week, in one of our lessons, we showed an example of how the price gets bullish based on the double bottom and flipped support. In today’s lesson, we are going to demonstrate an example of a double top and flipped resistance. a Double Top is the opposite of a Double Bottom, so it drives the price towards the South. It is one of the strongest bearish reversal patterns. Traders love to go short when a chart produces a double top in the Forex market. Let us now proceed and find out how it usually works.

The chart shows that the price heads towards the North and finds its resistance. It produces a bearish engulfing candle. Sellers on the minor chart may look to go short in the chart. However, the sellers in this chart may wait for either the price consolidates and makes a bearish breakout or to produce a double top.

The price finds its support and heads towards the level of resistance again. It consolidates around the level of resistance. A bearish reversal candle followed by a breakout at the last support may attract the sellers to go short in the pair since the chart would produce a double top, and the breakout would be a neckline breakout.

Here it goes. The price heads towards the South with good bearish momentum. It makes a breakout at the neckline and produces one more bearish candle. The sellers are going to wait to go short in the pair below the lowest low. However, it is best to wait for the price to consolidate around the breakout level and produce a bearish reversal candle to get a better risk-reward.

The price consolidates around the breakout level and produces a bearish engulfing candle at the breakout level. The sellers may go short below consolidation’s support by setting stop-loss above consolidation’s resistance and by setting a take-profit target with 1R at least. Please note, a double bottom/double top and consolidation around the neckline breakout level usually offers more than 1R. Let us find out how the trade goes.

The price heads towards the downside with extreme bearish momentum. It produces an inverted hammer. The price may make a bullish correction from here. Count the length that the price has traveled so far. It has traveled a long way offering about 6R to the sellers. One trade like this in a week may make a trader fulfilled. Thus, keep your eyes on patterns such as the Double Top/Double Bottom. Remember the procedure; wait for the price to consolidate and produce a reversal candle at the breakout level; trigger an entry below consolidation support/resistance, and manage your trade accordingly.

Categories
Forex Daily Topic Forex Price Action

The Double Bottom and the Flipped Level of Support

In today’s lesson, we are going to demonstrate an example of a double bottom, which pushes the price towards the North. The example also proves an old theory of support becomes resistance or resistance becomes support after a breakout. Let us get started.

The chart shows that the price makes a bearish move and finds its support. The level of support produces a bullish candle, which is followed by two more bullish candles. The buyers may wait for the price to consolidate and produce a bullish reversal candle to go long in the pair.

The price makes a long bearish correction. It comes back to the level of support again. A bearish breakout may attract the sellers to go short and drive the price towards the South. On the other hand, the buyers may wait to get a bullish reversal candle at its second bounce.

The chart produces a bullish engulfing candle. Since it is produced at the second bounce, the buyers in the chart may wait for the price to make a breakout at the neckline and go long.

The price heads towards the North with good bullish momentum. It makes a breakout at the neckline and trades above the level for one more candle. The buyers would love to see the price to consolidate or make a bearish correction at the breakout level and produce a bullish reversal candle to trigger a long entry.

The price makes a bearish correction and produces a bullish engulfing candle closing above the level of resistance. The buyers may trigger a long entry right after the last candle closes by setting Stop Loss below the candle’s lowest low and by setting Take Profit with 1R. Here we must notice that the neckline level becomes the level of support. This is one of the most reliable theories in the financial market.

The price heads towards the North with extreme bullish momentum. It hits 1R in a hurry and travels towards the North further. The last candle comes out as a hanging man, which is a bearish reversal candle. However, it is not a strong one. The price may keep traveling towards the North. Anyway, the buyers achieve their target with the entry, which is taken on two theories.

  1. Double Bottom- A very strong bullish reversal pattern
  2. Resistance works as a level of support after the breakout.

In the case of a double bottom and neckline breakout, we may sometimes find that the price does not come at the breakout level. It consolidates well above and makes a bullish move. In some cases, the price may not hit the target. However, if the price comes and produces a bullish reversal candle at the breakout level, the price may hit the target in most of the cases.

Categories
Forex Course

146. Measuring The Strength of a Breakout

Introduction

When you can see the momentum of the market slowing down, you can soon expect a reversal breakout in any underlying currency pair. Knowing this info will boost your confidence to pull the trigger, and to scale your positions without any hesitation.  Conversely, to trade the trend continuation breakout, knowing the strength of the breakout is also crucial.

In this course lesson, we will learn how to measure the breakout’s strength and take appropriate action according to the information which the market represents.

Using The MACD Indicator To Measure The Momentum

MACD is one of the most common momentum indicators in the Forex market. There are many different ways to use the MACD indicator, and in our case, we suggest you look at the histograms of the indicator to gauge the market strength. As the price moves, if the histograms get bigger, it is indicating that the market momentum is increasing. In this case, we can expect a breakout in the direction of the trend. Conversely, if the histogram gets smaller, it means the momentum is getting weaker, and we can soon expect a reversal in the currency pair.

Buy Example

The image below represents a buy trade in the EUR/GBP Forex pair.

Please observe the first arrow in the MACD histogram. The upsurge lines indicate the strong trend in this Forex pair. When the price action goes above the breakout line with the rising histogram bars, it is a sign of a strong breakout. After the breakout, we took a buy-entry, and the pair printed a brand new higher high.

Sell Example

The image below indicates a sell trade in the CHF/JPY Forex pair.

The image below represents the entry, exit, and stop-loss placements. The price action breaks below the significant level with the rising histogram lines. This shows the sellers are real, and they are ready to make a brand new lower low. After our entry, prices went down, making a brand new lower low. Therefore, when the breakout indicates strong strength, we must go for smaller stops and hunt significant returns.

Using The RSI Indicator To Measure Market’s Strenght

RSI stands for Relative Strength Index, and it is a popular indicator which oscillates between the 0 to 100 levels. When the indicator reaches the 70 levels, it means the market is overbought, and a reversal is expected. When it reaches the 30 levels, it means the market is oversold, and an upside reversal is expected.

In this article, we are not going to use the RSI indicator, like how it is typically used. Instead, we will use the RSI divergence to measure the strength of the trend. A divergence is when the price moves in one direction, and the indicator moves in another. Divergence shows that the indicator is not satisfied with the price action, so in this case, a reversal should be expected.

Buy Entry

  1. Find out the divergence in a downtrend.
  2. Wait for the price action to break above the significant resistance level.
  3. Wait for the hold above the breakout level to confirm the breakout.
  4. Hit Buy.
  5. Place the stop-loss below the breakout.
  6. Go for brand new higher high.

The image below indicates the buying trade in the GBP/CAD Forex pair.

The image below represents our entry, stop loss, and take profit in this Forex pair. As you can see, the trend was down, but on the other hand, the RSI indicator failed to make the higher high. This indicates that the buyers are strong, and after any breakout, we can confidently go long.

Sell Entry

  1. Find out the divergence in an uptrend.
  2. Wait for the price action to break below the significant support level.
  3. Wait for the hold below the breakout level to confirm the breakout.
  4. Hit sell.
  5. Place the stop loss above the breakout.
  6. Go for a brand new lower low.

The image below represents the selling trade in this Forex pair.

As you can see, when the price action and indicator gave the divergence, it means the indicator didn’t like the upward spiral anymore. Also, the buyers are exhausted, and we can expect a strong downward reversal. Soon after the breakout, we took short entry and exited our position when printing the brand new lower low.

[wp_quiz id=”86201″]
Categories
Forex Price Action

Trend Line Trading: An Incident That Often Confuses Traders

In today’s lesson, we are going to demonstrate an occurrence that often happens when the price trends with a trendline. A trendline works as a support/resistance. However, there is a little dissimilarity between horizontal support/resistance and trendline support/resistance. To draw a horizontal support/resistance, one bounce or rejection is enough. However, a trendline can be drawn only when the price makes a new higher low/lower high. This is what traders must remember, and we find this out the reason behind it.

The price makes a strong bullish move, as it produces seven consecutive bullish candles. The last candle comes out as a bearish engulfing candle. Considering the trend’s length, the buyers may keep their eyes on the pair to go long upon having a bullish reversal candle at flipped support.

The price consolidates and bounces at the same level twice. The last candle comes out as a bullish reversal candle. The buyers on the minor chart may look to go long in the pair and push the price towards the North.

The price heads towards the North and makes a breakout at the last swing high. It means we can draw an up-trending trend line and wait for the price to come at trendline’s support and to get a bullish reversal candle to go long in the pair. Let us find out what happens next.

The price does not produce a bullish reversal candle. It makes a breakout at trendline’s support and trades below the level for several candles. If the price makes a breakout at the last swing low, the sellers may look to go short in the pair. Let us see what happens next.

The price upon finding its horizontal support heads towards the North and makes a breakout at the last swing high. What does that mean? It means we can draw an up-trending trend line by using the last swing low from where the price makes a bullish breakout. Let us draw it and see how it looks.

It is a new trendline. It offers price to makes more bearish correction and more space towards the North to travel. As a matter of fact, its support zone has changed, but the new trendline is valid for the same old chart. It’s an incident that happens in the Forex market so often. Thus, keep an eye on a chart closely and do not make an immediate trading decision. Be sure about the breakout. If the breakout is confirmed, change your trading direction. If the breakout is not confirmed, let the price decide its way. We just have to follow the price and trade with its direction.

Categories
Forex Basic Strategies

Catch the Breakout with 34 EMA Trading Strategy!

Introduction

The exponential moving average (EMA) is a specialized chart indicator that tracks the value of an asset over time. It is a sort of weighted moving average (WMA) that provides more weighting or significance to ongoing valuable information. As like the simple moving average, the exponential moving average is utilized to see value patterns over time, and observing a few EMAs at one time is simple to do with moving normal rebinds.

What Is an Exponential Moving Average (EMA)?

An exponential moving normal (EMA) is a kind of moving average (MA) that puts a more noteworthy weight and sharpness on the latest information points. The exponential moving average is likewise alluded to as the exponentially weighted moving average. An exponentially weighted moving average responds more essentially to ongoing value changes than a straightforward moving average (SMA), which applies an equivalent weight to all observations in the period.

In the below image, you can see a naked chart of EURUSD

Now let’s plot the exponential moving average in the chart to see how it looks like

The Formula of Exponential Moving Average (EMA)

EMAToday = 
(ValuetToday ∗ (Smoothing / 1+Days)) + EMAyesterday * (1 - (Smoothing / 1+Days))
Where: EMA = Exponential Moving Average 

While there are numerous potential choices for the smoothing factor, the most widely recognised choice is 2

That gives the latest observation exceeding weight. In the event that the smoothing factor is expanded, later observations have more effect on the EMA.

Calculating the EMA

Calculating the EMA needs one more inspection than the SMA. Assume that you need to utilise 34 days as the number of inspections for the EMA. At that point, you should hold up until the 34th day to gain the SMA. On the 35th day, you would then be able to utilise the SMA from the earlier day as the first EMA for yesterday.

The calculation for the SMA is clear. It is essentially the entirety of the stock’s closing prices during a time span, divided by the number of inspections for that period. For instance, a 34-day SMA is only the entirety of the closing value for the previous 34 trading days, parted by 34.

34 EMA with Trendline Breakout Strategy

By combining the exponential moving average indicator with the price action context, the 34 EMA with trend line breakout forex trading strategy has established. In a decent trending market, this forex trading system is an entirely dependable trading strategy that can pull in plenty of pips effectively into your forex trading account.

To demonstrate it, simply proceed to do a little backtest on previous price history, and you will perceive what I’m discussing after you’ve learnt the trading methods and layouts which are additionally clarified underneath.

Timeframes

The 34 exponential moving average trading technique functions admirably in all timeframes from 5 minutes to weekly charts. The higher time frames can give better trading outcomes. However, it is best to stay on the 1 hour to daily chart as it can give high accuracy trades.

Currency Pair

There are no rules to utilise a currency pair. Still, it is good to utilize a forex pair that often remains in the range, for instance, EURUSD. However, all major and minor forex pairs are free to go with this trading technique.

Buy Entry 

  • First, draw a downward trend line and look for an upward breakout.
  • If the breakout has happened, then the price must be residing above the 34 EMA.
  • After the downward trend breakout has happened, look at the highs of the bullish candlestick that form.
  • The signal candle is the candle with a high that is lower than the last candle’s high. So, if the signal candle’s high is broken, at that point, enter a buy trade immediately. On the other hand, you can put in a buy stop order only a couple of pips over the high of that signal candle so if the price breaks signal candle’s high, your order will be placed.
  • If your buy stop order isn’t executed and the candles keep on making lower highs, move your buy stop order to every lower high candle that structures until the price goes up and executes your trade.
  • It’s always better to place a stop loss below the downward trend line breakout candle.

Sell Entry

  • First, draw an upward trend line and look for a downward breakout.
  • If the breakout has happened, then the price must be residing below the 34 EMA.
  • After the upward trend breakout has happened, look at the lows of the bearish candlestick that form.
  • The signal candle is the candle with a low that is higher than the last candle’s low. So, if the signal candle’s low is broken, at that point, enter a sell trade immediately. On the other hand, you can put in a sell stop order only a couple of pips over the low of that signal candle so if the price breaks signal candle’s low, your order will be placed.
  • If your sell stop order isn’t executed and the candles keep on making higher lows, move your sell stop order to every higher low candle that structures until the price goes down and executes your trade.
  • It’s always better to place a stop loss above the upward trend line breakout candle.

Limitations of the EMA

It is hazy whether or more emphasis ought to be put on the latest days in the timeframe. Numerous traders accept that new information better mirrors the current pattern of the asset. Simultaneously, others feel that overweighting current dates makes a preference that prompts to more bogus alarms.

Correspondingly, the EMA depends completely on authentic information. Numerous economists suspect that business sectors are proficient, which implies that current market value meanwhile mirrors all accessible data. If the markets are actually proficient, utilising authentic information should disclose to us nothing about the upcoming movement of security prices.

Summary

Let’s summarise the 34 exponential moving average with trendline breakout trading strategy:

  • You should look for an impulsive trendline breakout.
  • After the trendline breakout has happened, the price must be above or below the 34 EMA (depending on buy and sell entry).
  • It’s always better to put the stop loss below or above the trendline breakout candle.
  • Better money management can give you a better risk/reward ratio.

Moreover, you need to practice this trading strategy until your win ratio reaches above 60 per cent, and you must have to control your emotion and psychology for better outcomes.

Categories
Forex Daily Topic Forex Fibonacci

Intraday Trading: How Fibonacci Levels Help You Determine Entry and Take-Profit Levels

In today’s lesson, we are going to learn an intraday trading strategy using the previous day’s highest high or lowest low. When the price makes a breakout at yesterday’s highest high or lowest low, the price usually trends towards the breakout direction. In today’s lesson, we are going to demonstrate an example of a bearish breakout. After making a bearish breakout at the previous day’s lowest low, the price consolidates and produces a bearish engulfing candle at a significant Fibonacci level. Then, it heads towards the South with good bearish momentum. We try to find out the Fibonacci level where the price trends from as well as the take profit level where the price may make a reversal. Let us proceed.

This is an H1 chart. The chart shows that the price makes a bearish move by producing an ABC pattern. The last candle closes the trading session at the lowest low of the day. The next chart shows that the price consolidates around the lowest low of the previous trading day and makes a good bearish move.

The chart suggests that it becomes intraday sellers’ territory. The sellers may look to go short in the pair. The question is how and when. Let us find these two answers.

The last candle comes out as a bullish candle. Since the chart has been bearish, the sellers may wait for the chart to produce a bearish reversal candle to go short below consolidation support. Here is another equation that they must consider. We will find that out in a minute.

The chart produces a bearish engulfing candle. The sellers may trigger a short entry right after the last candle closes. A question may be raised here that the chart produces a bearish engulfing candle earlier right at the breakout level. We have not concentrated on that to go short from there. However, we have planned to go short right after the last candle closes. What are the reasons behind this? Let us find out how the price reacts after the last candle is produced.

The price heads towards the South with good bearish momentum. The chart produces a bullish reversal candle. It may change its trend or make a bullish correction, at least. For intraday traders, they cannot afford to wait as many pips by waiting to get a bullish reversal candle. They are to close the trade right after the last bearish candle. The question is, how would they know that they should set their take profit at that level?

The answer is Fibonacci levels. Do you remember I was talking about the level for the price to resume its bearish move, we find that out by Fibonacci levels as well. See, the chart produces a bearish engulfing candle at the level of 61.8%, and it hits 161.8%. These are two levels intraday traders must count when a pair trades below the previous day’s lowest low or vice versa. Stay tuned for more lessons for intraday trading with Fibonacci levels.

Categories
Forex Daily Topic Forex Price Action

Reversal Breakouts Offer a Lot

The trend is traders’ friend. Breakout is traders’ best friend. In today’s lesson, we are going to demonstrate an example of an H1 breakout, which makes a reversal even in the daily chart. Thus, the price heads towards the breakout direction with good momentum ending up offering an excellent reward. Let us get started.

The chart shows that the price makes a strong bearish move and finds its support. Upon producing a bullish engulfing candle, the price heads towards the North at a moderate pace. The price does not make a breakout at the last swing high. Thus, the chart is still bearish biased. Please note, the H1 chart does not show, but the daily trend has been bearish in this chart.

The chart shows that one of the candles breaches through the last swing high, closing well above the level. The last candle comes out as a bullish candle as well. It confirms the breakout. The buyers may wait for the price to consolidate and get a bullish reversal candle to go long in the pair.

The last two candles come out as bearish candles. The spinning top closes within the level of support. If the level produces a bullish engulfing candle, the buyers may go long in the pair.

The last candle comes out as a bullish engulfing candle closing well above consolidation resistance. The buyers may trigger a long entry right after the candle closes by setting stop loss below the level of support and by setting take profit with 1R.

The price heads towards the North with extreme bullish momentum. The way the chart looks, it seems it may continue its journey for a while. The chart shows that the buyers achieve their target within the next two candles after triggering the entry. Let us proceed to the following chart to see what the price does.

The last candle comes out as a bearish engulfing candle. It is produced at the second rejection as well. This means the chart forms a double top here. A double top resistance forming a bearish engulfing candle suggests that the price may make a bearish move here. However, if we calculate the length of the bullish move, it ends up being a very good one. This is what usually happens when the price makes a breakout at the last daily candle’s highest high when the daily chart is bearish and if the breakout takes place at the lowest low when the daily trend is bullish. Make sure the price consolidates and produces a strong reversal candle at the breakout level. If that happens, it often ends up offering an excellent reward in the end.

Categories
Forex Price Action

Mark Significant Levels and Watch out Price Action around Them

In today’s lesson, we are going to demonstrate an example of the H4-H1 chart combination trading where the breakout takes place, but the traders have to be sensible to spot out the breakout. Let us get started.

This is an H4 chart. The chart shows that the price heads towards the North upon having its second bounce at the level of support. Look at the last candle. The candle comes out as a bullish engulfing candle since it closes well above the body of the last candle. Can you spot something out here?

The candle closes well above the level where the price had a rejection earlier. The price reacted around the same level before producing the last candle. If we draw a level by using the significant level, which has been working as the level of resistance, we see that the last candle breaches the level. This means the piercing may be considered a breakout. Let us now flip over to the H1 chart.

This is how the H1 chart looks. The chart shows that the last candle comes out as a Spinning Top. The H4-H1 buyers are to wait for the price to consolidate and to get a bullish reversal candle to go long in the pair. Let us wait and see what the price does.

The chart produces a bearish engulfing candle closing within the breakout level. Look at the last candle. The last candle came out as a long bullish engulfing candle. The buyers may get huge confidence about the earlier H4 breakout and trigger a long entry right after the last candle closes. Let us now find out how the entry goes.

The price heads towards the North with good bullish momentum. The last candle comes out as a bearish Inside Bar. This action suggests that the Bull may continue its run. It is a bearish reversal candle (the weakest one). Thus, the buyers may consider closing their entry. In the end, this comes out as an excellent trade setup.

If we concentrate on the breakout, it is to be found out by the traders. Without drawing the horizontal line, it would be difficult to found that out. Thus, mark the points that are significant and keep looking at our charts. It would help you find out breakout and make the trading decision easily. Some breakouts may not seem like a breakout without drawing lines on the chart. Thus, pick your drawing tool to mark significant levels with horizontal lines/trend lines/channels on your trading chart and watch out how the price reacts around them.

Categories
Forex Price Action

The Trend in a Bigger Frame is Traders’ True Friend

There is a saying in financial trading “Trend is traders’ friend.” Without any doubt, this is true. In a chart combination trading, a bigger timeframe’s trend plays an important role and helps traders a lot to go with an entry in its counterpart. Let us have a look through an example of how it works.

This is a daily chart. The chart shows that the price heads towards the North at a moderate pace. The last candle comes out as a bullish candle closing well above consolidation resistance. It means the daily traders may start eyeing to go long in the pair.  The daily-H4 combination traders may flip over to the H4 chart for the price to consolidate and produce a long signal.

This is the flipped H4 chart. The chart shows that the last candle comes out as a bullish candle with an upper shadow. The buyers are to wait for the price to consolidate now.

The price consolidates and produces a bullish candle breaching consolidation resistance. Here is a thing. The consolidation range is shallow. The consolidation range plays a significant role in determining the next move’s length. The length of consolidation here does not suggest that the next move will be a big one. The daily-H4 combination traders may trigger a long entry by setting stop loss below consolidation support and by setting take profit with 1R. Let us proceed to the next chart.

The price hits the target of 1R by the next candle. Concentrate on the last candle. The candle comes out as a bullish Marubozu candle. It suggests that the price may head towards the North further. Let us find out how far it goes.

The price heads towards the North with three more candles. This means it travels almost three times more length than the combination traders have anticipated. Can you guess what may be the reason for this?

The daily chart is in a strong bullish trend. The last daily candle breaches through consolidation resistance and makes a strong statement about its bullishness. That may have attracted the daily buyers to go long in the pair as well. This brings extra liquidity and helps the price head towards the North with extreme pressure. This happens most of the time in combination trading. If the bigger chart makes a breakout and has a solid trend, the price seems to head towards the trend’s direction at a good pace in the minor chart. The combination traders may keep this in their mind and make full use of this.

Categories
Forex Price Action

H1-15M Combination Strategy: Entry upon Consolidation and Fibo Targets

In today’s lesson, we are going to demonstrate an example of the H1 -15M combination trading strategy offering entry upon consolidation. We are going to integrate Fibonacci levels to see how far the price moves. This would give us an idea of how effective Fibonacci levels are to determine the stop loss and take profit level. Let us get started.

The H1 chart shows that the price makes a strong bearish move and finds its support. The black marked level is the level of H1 support here. The price moves towards the North with two candles and may have found its resistance. One of the candles comes out as a bearish engulfing candle. Traders are to wait for an H1 breakout followed by a 15M bearish reversal candle to go short in the pair. Let us see what happens here.

The chart produces one more bearish candle followed by a doji candle. It means the price consolidates in this chart. The next candle closes just below the level of support. Ideally, this is not a perfect breakout candle. However, the price consolidates and produces an H1 bearish reversal candle (the last candle). This is a signal that the price may get bearish and head towards the South. Let us flip over to the 15M chart.

The 15M chart shows that the last candle comes out as a bullish candle. Do not forget that H1 candle closes with a bearish body. Thus, a 15M bearish reversal candle (preferably engulfing candle) will push the price towards the South.

Look at the last 15M candle. It comes out as a bearish engulfing candle closing well below the last candle. This means the price may head towards the South with good bearish momentum. Let us proceed to the next chart with Fibonacci levels to find out how far the price heads to.

The price trends from the 78.6% level and reaches 161.8%. Usually, the 78.6% Fibo level drives the price towards the level of 138.2% with good momentum. It often reaches up to the level of 161.8% because of momentum. However, we may set our target at 138.2% if it trends from 78.6%. Another point you may have noticed is that we draw Fibonacci levels by using the lowest low, not the H1 support. These are two different things.

If the H1 chart makes a straight breakout, we may wait for a 15M reversal candle to take entry. If it consolidates and produces an H1 reversal candle, we may trigger entry if 15M chart produces a strong reversal candle closing well below the wave’s lowest low. Do some backtesting; you will see many charts where the price makes a move like this. Stay tuned. We will reveal more examples of this.


Categories
Forex Price Action

The H1-15M Combination Trading: Waiting for an H1 Reversal Candle Ensures Better Reward

The H1 reversal candle plays a significant part in the H1-15M chart combination trading. If the traders wait to get an H1 reversal candle, by using candle’s lower low/higher high, they get a better risk-reward. In a bearish market, a trader needs to wait for an H1 bearish reversal candle after the breakout. In a bullish market, he needs to do the opposite. In today’s lesson, we are going to demonstrate an example of a bullish market where the H1-15M chart combination offers an entry upon producing an H1 bullish reversal candle. Let us get started.

This is an H1 chart. The chart shows that the price heads towards the North with good bullish momentum. The price, then upon finding its resistance, has been in a bearish correction. It consolidates around a level and heads towards the North. The buyers are to keep their eyes on the chart with a hope that it may make a bullish breakout.

The chart shows that the last candle makes a bullish breakout closing well above the last highest high. The buyers are to wait for the chart to produce an H1 bullish reversal candle followed by a 15M bullish candle to trigger a long entry. Let us keep watching the chart to get that H1 bullish reversal candle.

The chart shows that it produces two doji candles. It means the price has been in bearish correction at the minor charts. An H1 bullish reversal candle at the breakout level would be the ‘getting ready’ signal to go long in the pair.

Look at the last candle. The last candle comes out as a bullish candle forming at the breakout level. The buyers are waiting for the chart to produce such a candle. They may flip over to the 15M chart now. Let us flip over to the 15M chart.

The last candle comes out as a bearish inside bar. Since the H1 candle closes as a bullish candle, so a 15M bullish candle is the signal to trigger a long entry. Let us proceed to the next chart.

Here it is. The chart produces a bullish Pin Bar. The buyers may trigger a long entry right after the last candle closes. Traders may set their stop loss below the H1 bullish reversal candle’s lowest low, which is below the red-marked level. To set take profit, they may use Fibonacci levels. If the price trends from 61.8%, it usually goes up to the level of 161.8%. Let us find out how this one goes.

Yes, the price heads towards the level of 161.8% with good bullish momentum. If we flip over to the 15M chart right after the breakout, we would take entry by setting stop loss below 00.00%. By waiting for an H1 reversal candle, we may set the stop loss below 38.2%. This ensures a better risk-reward. On the other hand, if we always wait to get an H1 reversal candle after the breakout, we may not get it all the time. Thus, we end up being offered less number of entries in the H1-15M chart combination trading.


Categories
Forex Daily Topic Forex Price Action

The Levels You Need to Pay Extra Attention

Support and Resistance are the two key factors of Forex trading. The good thing is in most cases time these levels can be guessed well earlier. By drawing support/resistance levels where the price reacts earlier,   we can spot those levels. This helps a trader set his stop loss, take profit and make a trading decision. In today’s lesson, we are going to demonstrate an example of how the previous levels where the price reacts earlier play a significant part as far as support/resistance is concerned.

Look at the chart carefully. The price makes a strong bearish move and makes an upside correction. The chart produces a spinning top followed by a bearish engulfing candle. If we consider the existent trend and candlestick pattern, it is a short signal. The question is whether it really is a short signal or not. Look at the next chart.

At the correction, one of the candles breaches through a level. This level was a level of support earlier. After being bearish, the level should work as a level of resistance. It does not. The price breaches through the level. In fact, it may work as a level of support again. If it produces a bullish reversal candle, the buyers are going to take control here.

The level seems to hold the price as a level of support. It produces two a bullish pin bar and a doji candle. If it produces a bullish engulfing candle here, the price may get bullish and head towards the North.

The chart produces a bullish engulfing candle closing well above the wave’s highest high. Let us calculate whether the buyers should go long here or not. The price makes a bullish move breaching a significant level. The price makes a bearish correction and the breakout level works as a level of support. As far as price action trading is concerned, traders may trigger a long entry right after the last candle closes.

As expected, the price heads towards the North with good bullish momentum. It gets the buyers 1R already. The last candle comes out as a bearish inside bar. The price may reverse now. However, there is still a 40% possibility that the price continues its bullish move. Let us assume that the buyers close the trade and cash in some profit.

If we consider the whole scenario, the market seems bearish in naked eyes. When we draw the significant level, it gives us a clearer picture of the breakout and correction. We, then realize that the market is actually bullish. A long entry at the pullback gets the buyers some green pips. This is what Support and Resistance (significant levels) do.

Categories
Forex Price Action

The H4-Daily Combination Strategy: Do not Get Carried Away

In today’s lesson, we are going to demonstrate an example of an H4-daily chart combination trading. The lesson has an important message to remember for the H4-Daily combination traders. Let us get started.

The chart shows that the price produces a double top and heads towards the South with good bearish momentum. The daily candle closes as a bearish Marubozu candle having no lower shadow at all. The next trading day starts with a Spinning Top. It seems that the H4 chart starts having consolidation. The last H4 candle comes out as a bullish engulfing candle. This looks good for the sellers that the price is having consolidation after making a good bearish move. However, the H4-Daily combination traders must not forget one thing that the signal is to be produced within the next two candles. Otherwise, it becomes daily support.

The fifth H4 candle of the day comes out as a bearish engulfing candle. The candle closes well below consolidation support. The sellers may trigger a short entry right after the last candle closes by setting stop-loss above consolidation resistance and by setting take profit with 1R.

The next candle comes out as a bullish inside bar after triggering the entry. The sellers would love to get a long bearish candle here. However, a bullish inside bar suggests that the bear still holds the key. Let us proceed to the next chart.

The next candle comes out as a bearish engulfing candle. This looks extremely good for the sellers now. The price finds another resistance. This attracts sellers to add more short positions. Anyway, the H4-Daily combination traders are to wait for the price to hit their 1R take profit.

The price takes two more candles to hit the target. I would say that the price hits the target at a moderate pace here. Anyway, the H4-Daily combination strategy offers entry, and the trade setup works well for the sellers.

The message this lesson has is that we must not get carried away with bullish or bearish move followed by consolidation. The H4 chart is to produce a trade signal within the next day. If it does not, that chart does not belong to the H4-Daily combination trading strategy.  If it does, then the H4-Daily combination traders may trigger an entry.

Categories
Forex Fibonacci

How to Use Fibonacci Levels in the H1-15M Combination Trading

In today’s lesson, we are going to demonstrate an example of an H1 chart offering an entry. We find out how Fibonacci levels and 15-min chart help us take the entry. Let us get started.

This is an H1 chart. The chart shows that the price after making a strong bearish move has been making an upward correction. The chart produces a Shooting Star and creates a bearish momentum. However, the sellers are to wait for the chart to make a breakout at the lowest low of the wave. Let us proceed to the next chart to find out what the price does next.

The price keeps driving towards the South and makes a breakout at the lowest low. The breakout candle has a long lower shadow, but it closes well below the level of support. The H1-15M combination traders may flip over to the 15M chart now.

This is how the 15M chart looks. The last candle comes out as a bullish candle. The sellers are to wait for a bearish reversal candle to go short in the pair. They must concentrate hard on the chart. It is waiting time for the sellers.

The 15M chart produces a bearish reversal candle. The candle has a long lower shadow but has a thick bearish body. Moreover, the H1 chart makes a breakout, so a 15M bearish reversal candle means a lot to the sellers. The sellers may trigger a short entry right after the last candle closes. There is another equation, which we will reveal in a minute. Let’s now find out how the trade goes.

The price heads towards the South with good bearish momentum. The 15M chart shows that it consolidates now and then. The H1 chart should look much more bearish than this. Ok, here is the equation we have pointed out a bit earlier. Let us draw Fibonacci levels and find out how it may help us set our stop-loss and take-profit levels.

The Fibonacci levels show that the price trends from the level of 61.8%. It makes a breakout at the level of 100.0 and heads towards the level of 161.8. When the price trends from 61.8%, it creates an extra momentum. This is what this example shows, as well. With Fibonacci, we know where to set the take-profit level. Yes, it is to be at 161.8%. With stop-loss, you may set it above 61.8% if you are too defensive a trader. If you want to be too tight with your stop loss, you may set it between 78.6% to 100.0%. The first one offers less risk-reward, but it has a higher winning percentage. On the other hand, the second one offers excellent risk-reward but has less winning percentage. The choice is yours.

Categories
Forex Price Action

The H1-15M Breakout Trading: Concentrate on Breakout and Reversal Candle

In today’s lesson, we are going to demonstrate an example of a trade setup based on the H1-15M chart combination. Usually, the straighter the first move, the better it is.  However, the price sometimes consolidates in the first arm as well. Such consolidation makes a move look weak and may hold us back from eyeing on the chart. We try to find out whether we should skip eyeing on such a chart or not.

This is an H1 chart. The chart shows that the price makes a bullish move. Then, it produces a bearish inside bar followed by a bullish engulfing candle. The H1-15M buyers may flip over to the 15M chart to get a 15M bullish reversal candle to trigger a long entry. However, those two bearish H1 candles suggest that the 15M chart does not produce any bullish reversal candle after the H1 breakout. The price starts having a bearish correction instead.

The chart makes its bullish move, followed by a bearish correction. The bullish move does not look that impressive. It consolidates before making the bearish correction. Many traders may skip eyeing on this chart to go long in the pair. Ideally, the H1-15M combination trading requires an H1 breakout followed by a 15M bullish reversal to offer a long entry. Let us proceed to the next chart to find out what the price does here.

The price finds its support and heads towards the North. The last candle closes above the level of resistance. This is an H1 breakout. The H1-15M combination traders are to flip over to the 15M chart to trigger a long entry. Let us flip over to the 15M chart first.

This is how the 15M chart looks right after the H1 breakout. If the price comes back to the breakout level, and the level produces a 15M bullish reversal candle, the buyers may trigger a long entry.

The 15M chart produces a bearish engulfing candle closing within the breakout level. The next candle comes out as a bullish engulfing candle. The H1-15M buyers may trigger a long entry right after the last candle closes by setting stop loss below consolidation support and by setting take profit with 1R.

The price never looks back before hitting 1R. It heads towards the North at a very good pace. Consolidation and bullish reversal candle come out exactly the buyers would want to get. Do not forget that the first bullish move does not look that impressive. The breakout and 15M chart’s price action attract the buyers to go long here, though. This is what we are to look for in the H1-15M combination trading. It is good if the price makes a strong move in the first arm. However, if it does not, we may still eye on the chart to see whether it makes an H1 breakout and offers us an entry by producing a 15M bullish reversal candle.

Categories
Forex Daily Topic Forex Price Action

The H1-15M Combination Trading in a Bearish Market

In today’s lesson, we are going to demonstrate an example of the H1-15M combination trading strategy offering a short entry. In one of our previous lessons, we demonstrated an example of a long entry. Let us see how it ends up offering us the entry.

This is an H1 chart. The chart shows that the price gets caught within two horizontal levels. The chart shows that the price after getting the last rejection has been heading towards the South. The sellers are to wait for a bearish breakout to go short in the pair.

Here it comes. The last candle breaches the level of support closing well below it. The H1-15M combination traders may flip over to the 15M chart to get a bearish reversal candle for triggering a short entry. Let us flip over to the 15M chart.

This is how the 15M chart looks. As expected, the last candle comes out as a bearish candle. If the next 15M candle comes out as a bearish candle closing below the last candle, the sellers may trigger a short entry. If the chart consolidates, the sellers are to wait for a 15M bearish reversal candle to take the entry. Let us find out what happens here.

The chart produces a bullish corrective candle. The sellers are to wait for a bearish reversal candle to go short in the pair. Usually, if the price makes a correction, it goes towards the breakout level and produces a reversal candle there. Let us find out where it produces a bearish reversal candle for the sellers.

The chart produces a bearish engulfing candle closing below consolidation support. The sellers may trigger a short entry right after the last candle closes. Stop Loss and Take Profit are to be set according to the H1 chart. Stop Loss is to be set above H1 horizontal resistance before the breakout, and Take Profit is to be set with 1R. Let us now find out how the entry goes.

This is the H1 chart. We see that the price heads towards the South with good bearish momentum and hits the target of 1R with ease. After producing the 15M bearish reversal candle, the price never looks back but goes towards the trend’s direction. This is what usually happens in the H1-15M combination trading. The price heads towards the trend’s direction without wasting time.

Do a lot of backtesting in your trading chart to find out some entries based on the H1-15M chart. Then, do some demo trading with the strategy before going live. It will help you be a better trader.


Categories
Forex Daily Topic Forex Price Action

When a Double Top and an Engulfing Candle Comes Together

In today’s lesson, we are going to demonstrate an example of a chart where the price heads towards the downside upon making a double top. At the second rejection, the chart produces a bearish engulfing candle. Usually, a combination of these two does not usually go wrong. The price does not make a deep consolidation afterward. However, it still heads towards the South with good bearish momentum. Let us have a look at how it happens.

This is a daily chart. The chart shows that the last candle comes out as a Shooting Star. The daily –H4 combination traders may consider it as a bearish reversal candle and flip over to the H4 chart.

The H4 chart shows that the price produces a double top. At the second bounce, the reversal candle comes out as a bearish engulfing candle. This combination may attract the sellers to look for short entries upon consolidation and getting bearish reversal candle.

The chart produces a bullish candle. It finds its resistance and produces a bearish engulfing candle closing below consolidation support. The sellers may trigger a short entry right after the last candle closes by setting stop-loss above consolidation resistance and take profit with 1R. Here is an equation that we may think about that. The price does not make a deep consolidation. Since the price is bearish upon a double top and an engulfing candle, most probably, it will make a strong bearish move. However, if you are in doubt, leave it out. Let us proceed to the next chart to find out what happens.

The next candle comes out as a doji candle. The price heads towards the Stop Loss, but it does not hit, though. It looks good for the sellers since the candle closes below the breakout level. Let us proceed to the next chart to find out what the price does.

The chart produces a long bearish candle and hits the target of 1R. Shallow consolidation may hold the price back a little to hit the target in a hurry. However, in the end, the sellers make some green pips with a combination of a Double Top and an Engulfing candle.

This trade setup does not meet all the requirements for combination breakout trading. The trend starts from a Double top resistance along with a bearish engulfing candle; it continues its bearish journey with more candles even after a shallow consolidation. This is what a combination of a Double Top/Bottom along with an engulfing candle can do. Thus, be keen on a chart if a trend starts with a combination of these two.

Categories
Forex Daily Topic Forex Price Action

The H1-15M Combination Trading Has a Lot to Offer

In today’s article, we are going to demonstrate a combination strategy. The combination is made of the H1 and the 15M chart. Since these two are busy intraday charts, thus a trader can find a good number of entries with this strategy. Let us now proceed and find out how it works.

The above image displays the H1 chart. The chart shows that the price gets caught within two horizontal levels. At the last bounce, the chart produces a bullish engulfing candle and heads towards the North. The sellers may wait for the chart to produce a bearish reversal candle at the level of resistance. On the other hand, the buyers are to wait for a breakout at the level.

The bull wins. A good-looking bullish candle breaches through the level of resistance, closing well above the level of resistance. Some traders may trigger a long entry right after the last candle closes. Some may initiate their long entries by setting limit order above the level of resistance. Every strategy has some advantages as well as disadvantages. Anyway, we are going to flip over to the 15 M chart to trigger an entry.

This is how the 15M chart looks. The last candle closes as a bullish candle too. This suggests that the bull has taken control. The H1-15M combination traders are to wait for the price to consolidate and produce a 15 M bullish candle to offer them a long entry.

The chart produces a bearish engulfing candle followed by a bullish engulfing candle. The buyers (H1-15M combination traders) may trigger a long entry now. The stop loss is to be set below the level of new support (breakout level), and take profit may be set with 2R. Let us proceed to the next chart to find out what the price does after triggering the entry.

This is the H1 chart. The chart shows that the price heads towards the North with good bullish momentum. The buyers achieve their 1R with ease. The point we may notice that the price never even comes back to the breakout level again after triggering the entry.

By using the H1-15M strategy, traders can get an excellent risk-reward. It offers a high winning percentage as well. In most cases, the price heads towards the trend’s direction with good momentum. On the contrary, the 15M chart may not always consolidate and produce the signal candle. Thus, traders may not get as many entries as they would like. However, since it is the H1-15M combination, it still offers a good number of entries per week in major pairs.

Categories
Forex Fibonacci

Fibonacci Trading: How Fibonacci Levels Give Clues to the Traders

In today’s Fibonacci lesson, we are going to demonstrate an example of a chart, which makes a bearish move. We dig into the charts and find out how we can take an entry based on Fibonacci levels and how the levels may help us giving clues to execute our plan. Let us get started.

The above figure shows an H1 chart. The chart shows that the price makes a bearish move at a moderate pace. It seems that the price finds its support. It has been having consolidation around the level of support having bounces three times. The last candle in this chart comes out as a bullish Marubozu candle. This may push the price towards the North. However, the sellers may still have the hope that they may get a bearish breakout here. Let us proceed to the next chart to find out what the price does.

The chart produces a bearish engulfing candle breaching the level of support. The pair trades for two more candles after the breakout. An important point is to be noticed here that the price is having an upside correction after the breakout. Sometimes price keeps trending after a breakout, whereas sometimes price makes the correction. Fibonacci levels have an important role to play in this. Thus, if we use Fibonacci levels, we are able to find out whether the price trends or makes correction well ahead. Let us now find out how we take the entry. We are to flip over to the minor chart. Since this is an H1 chart, we may flip over to the 15 M chart to trigger the entry.

Look at the arrowed candle. The candle comes out as a bearish Marubozu candle forming track rail. The candle is formed right at a flipped resistance. A short entry may be triggered right after the arrowed candle closes. The chart also shows how the price heads towards the South after the signal candle. Let us now see the H1 chart with Fibonacci levels.

The chart shows that the price trends from 78.6% level. Thus, it may reverse at 138.2%. It hits 161.8% here. However, we may set our target at 138.2% if the price trends from 78.6% to be safe. The Stop Loss may be set here above 100.0 Fibonacci level.

These are the things we must remember when we trade a chart trending from a 78.6% level.

  1. The price may make a reversal at 138.2.
  2. If the price trends from 78.2%, it most probably makes a correction after the breakout. Otherwise, it does not give a good risk-reward as well.


Categories
Forex Fibonacci

Fibonacci Trading: Be sure whether the Level is Held or Breached

Breakout plays a very vital role in the Forex market. Traders use breakout, breakout levels to make a trading decision. Fibonacci traders are to make sure whether a particular level is breached or it holds the price to make a better trading decision. In today’s lesson, we are going to demonstrate an example where Fibonacci traders may need to concentrate more to be sure about the Fibonacci level from where the price trends. Let us get started.

This is an H1 chart. The chart shows that the price makes a strong bearish move. It makes an upside correction followed by a strong bearish move again. The price has been having an upside correction again. Fibonacci traders are to draw the Fibonacci levels in the chart to find out where the price makes a bearish reversal and how far it may go up to.

Here are the levels. The chart shows that the price produces a bearish engulfing candle and heads towards the South with good bearish momentum. The question is whether the price trends from 78.6% or 61.8%. It is a vital issue since the price heads towards either 138.2% or 161.8% based on these two levels. If we concentrate on the chart, we see one of the bullish candles closes above the 78.6% level. However, the price comes back within the 78.6% level with the next candle. This means the H1 chart does not make a bullish breakout at 78.6%. The sellers may plan their entries to go short up to 138.2% in this chart. Let us proceed to the next chart to find out what price does.

The price breaches the 100.0 level and trades below for several candles. The sellers may wait for a bearish reversal candle and go short in the pair as long as they are satisfied with the risk-reward factor. Usually, it is best if the price goes back to the 100.0 level and produces a bearish reversal candle around the level as far as the risk-reward ratio is concerned. However, it may be produced anywhere between 100.0% to 123.6%. The sellers with different strategies may set their stop loss at different levels, but their last take profit level is to be set at 138.2 %. Let us proceed to the next chart to find out what the price does next.

The chart shows that the price hits 138.2%. As expected, it has been roaming around the level. It seems that the price may have found its support around 138.2% level, and it may make a bullish reversal. The sellers with Fibonacci levels have completed their mission with perfection.

Categories
Forex Fibonacci

Fibonacci Trading: How Fibonacci Levels Can be Used in Trading?

Fibonacci levels and price action around those levels give traders clue what they should do with their potential trade setup. The 61.8% level is the most significant level, which is paid attention by the traders to make a trading decision. The price usually goes towards the level of 161.8% when it trends from 61.8%. Since it creates enough space for the price to travel, different traders trade and make use of the wave-length in differently.  We will learn some other strategies that are integrated with Fibonacci levels. Meanwhile, let us demonstrate an example of a chart where the price reacts at 61.8% and trends towards 161.8% afterwards.

The chart shows that upon producing a double bottom, the price heads towards the North and makes a new higher high. The buyers are to wait for the price to make a bearish correction now.

The price heads towards the South upon producing a bearish inside bar. The last candle comes out as a bearish engulfing candle closing within a flipped support. Let us wait and see whether the level produces a bullish reversal candle.

The price produces three bullish candles at the flipped support. The last candle looks to be the strongest one. The price may head towards the North and makes a breakout at the highest high of the wave.

As expected, the price heads towards the North and makes a breakout at the highest high of the wave. The price continues its journey towards the North further. The last candle on the chart comes out as a bullish candle having a long upper shadow. Do you notice anything interesting here? Look at the next chart.

The price after making a bullish move, it starts having a bearish correction. The price consolidates around the 61.8% level. It produces a hammer and heads towards the North. It makes a breakout at the last highest high and heads towards the North with good bullish momentum. The price hits 161.8% as it usually does when it trends from 61.8% level.

Some traders go long in this chart before the price makes the bullish breakout. As long as 61.8% level produces a strong reversal candle, they trigger their entry. It provides an excellent risk-reward but less winning percentage. On the other hand, some traders trade once the price makes a breakout. This offers not that great a risk-reward but an excellent winning percentage.

Categories
Forex Daily Topic Forex Fibonacci

Fibonacci Trading: The Golden Ratio

Fibonacci trading is one of the most prolific trading methods, which is widely used by Forex traders. Retracement length, Fibo levels as well as reversal candle are three factors that Fibonacci traders need to pay attention to. In today’s article, we are going to demonstrate an example of a chart, which makes an excellent bearish move after having a retracement. The length of retracement, the most significant Fibo level, and the reversal signal all play their part in this example. Thus, fasten your seat belt and read through.

The chart shows that it makes a strong bearish move and makes a breakout at long-held support. The price heads towards the South, searching for its support. The sellers are to wait for the price to have a retracement.

The price starts having retracement. It produces a bullish inside bar followed by another bullish candle. The sellers are to wait for the price to find its resistance and produce a bearish reversal candle. However, the Fibonacci traders are to wait for the price to produce a bearish reversal candle at a very particular level, which is the 61.8 level.

The chart produces a bearish engulfing candle closing well below the last bullish candle. The Fibonacci traders must draw the Fibonacci retracement levels to find out which level produces this reversal candle. If this is the level of 61.8, the Fibo sellers are going to go short in the pair.

The highest high is the level of 0.00, and the lowest low is the level of 100.0. The price has a retracement and produces a bearish engulfing candle right at Fibo level 61.8. Usually, when the level of 61.8 works as support/resistance, it drives the price towards the level of 161.8. This means the price may head towards the South and hit the level of 161.8 next. Let us proceed to the next chart and see what the price does here.

The price hits 161.8 level. It makes an upward correction on its way. However, it reaches the level at last. The last candle shows that it breaches the level of 161.8. The price may head towards the South further.

The level of 61.8 is called the Golden ratio. It is a super significant level as far as Fibonacci Retracement is concerned. The buyers in a buying market and the sellers in a selling market wait for the price to produce a reversal candle/signal candle to go long/short in a pair. Yes, there some equations for the traders to know and obey to be able to trade with Fibonacci retracement. Once they learn them well, Fibonacci trading can make them a handful.

Categories
Forex Price-Action Strategies

Good Things Come to Those Who Wait

Patience is a virtue. Forex traders need to keep patience and must not get carried away. It is not easy, but to be successful in trading, traders must be patient. A trader needs to have a sniper approach. He is to wait for the best trade setup to trigger an entry. The Forex market often produces entry with less chance. If a trader can restrain himself from taking those entries, he would be able to keep a better winning ratio. In the end, it gives him more confidence and makes him a good trader. In today’s lesson, we are going to demonstrate an example of an entry with less chance and a good entry. Let us get started.

The chart shows that the price makes a strong bullish move. Upon finding its resistance, it makes a bearish correction. It finds its support and produces a bullish engulfing candle. Such a nice price action for the buyers this is! However, it takes one more candle to make a breakout at consolidation resistance. As far as the breakout trading strategy is concerned, this is not an A+ trade setup. The price may come back down and consolidates again. Thus, it is better to skip such an entry.

The chart produces two more bullish candles, but the price does not go too further up. It rather starts having consolidation. The buyers may keep an eye on this chart to see whether it produces a bullish engulfing candle.

The chart does not take long to produce such a good-looking bullish engulfing candle closing well above consolidation resistance. This is an A+ trade setup. The buyers may trigger a long entry right after the last candle closes by setting stop loss below consolidation support and by setting take profit with 1R. Let’s proceed to the next chart to find out how the entry goes.

The chart produces another bullish candle. The last two candles suggest that the bull has taken control. It may hit the target soon.

As expected, the price hits the target. The last candle comes out as a bullish candle having an upper shadow. The price may reverse now. Anyway, the buyers have made some green pips. Their plan has worked well.

If we look back to the chart, we find that the first entry would not be that good an entry. It would make them wait too long. Often the price goes the other way and hits the stop loss. The second one comes out as an excellent entry. It does not make them wait but hits the target in a hurry. Traders must remember that if they want to avoid waiting with their entry to hit the target, they must wait and calculate well before triggering an entry.

Categories
Forex Price-Action Strategies

The Longer It Ranges, The Harder It Breaks

Price action traders usually look for entries on the chart that has a clear trend. However, even a choppy chart end up providing good entry to the traders. In today’s lesson, we are going to show how a choppy chart ends up producing a good entry. Let us get started.

The chart shows that the price has been choppy. It bounces at a level of support three times. As far as resistance is concerned, the price has a rejection at a level once and comes back down. Then, it heads towards the upside and finds its resistance getting rejection twice. The level of support seems stronger than the resistance here.

The price finds its resistance, and at the second rejection, it makes a breakout. As mentioned, the price bounces three times at the level of support. Thus, the breakout is strong as well. The sellers are to wait for the price to be held by the breakout level and a bearish reversal candle to go short in the pair.

The next candle comes out as a doji candle closing within the breakout level. The breakout comes out as a valid breakout. The sellers are to wait for the level to create a bearish reversal candle to trigger a short entry.

Here it comes. The last candle on the chart comes out as a bearish engulfing candle closing well below the last swing low. The sellers may trigger a short entry right after the candle closes by setting stop loss above the resistance and by setting take profit with 1R. Let us proceed to the next chart to find out how the entry goes.

The price heads towards the South with good bearish momentum. The price hits the take profit (1R). The last candle suggests that the price may head towards the South further. Some traders may take partial profits and let the rest of the trade run to make more pips.

The chart produces a bullish inside bar. The chart still favors the Bear. However, it may be time for the sellers to give it a second thought to close the whole trade. If we look at the chart, the price heads towards the downside and hits the target without producing any bullish candle in between. This is how it usually goes if the price makes a breakout within a long choppy market. Thus, traders may keep their eyes on the choppy charts to see whether the price makes a breakout to offer them an entry. A breakout in a choppy market is often very rewarding.

Categories
Forex Price-Action Strategies

Breakout With and Without Momentum

A Breakout without momentum often does not push the price towards the trend. The price seems to come back at the breakout level again. On the other hand, a breakout with momentum pushes the price towards the trend in most of the cases. In today’s lesson, we are going to demonstrate a chart, which has two types of breakouts. Let us get started.

The chart shows that it heads towards the North. Upon finding its resistance, it makes a bearish correction. It finds its support and produces a bullish engulfing candle. The price heads towards the North again. It makes a breakout with a candle having a long upper shadow. It is a breakout. However, the breakout takes place with two bullish candles. Let us proceed to the next chart to find out what the price does.

Despite making a breakout, the price does not head towards the North. It rather consolidates around the breakout level. The breakout level still holds the price. Nevertheless, it does not look that good for the buyers. The price may come back within those two levels and hit the lower support. Let us find out what happens next.

The price does not come back within the breakout level. It makes another breakout at consolidation resistance. It takes only one candle to make the breakout. Breakout traders want to get this kind of breakout to trigger a long entry. The buyers may trigger a long entry right after the last candle closes by setting stop loss below consolidation support and by setting take profit with 1R.

The price heads towards the North with good bullish momentum. The next candle comes out as a strong bullish candle. It suggests that the bull has taken control. It seems the price may hit 1R in a hurry as well. This is what the breakout traders want.

As anticipated, the chart produces another bullish candle and hits the target. It takes two candles to achieve 1R. It gives traders more confidence about the strategy and saves their time. They can concentrate on other charts to look for entries. It does not mean it goes like this every single time though.

The above charts show that a breakout by two candles does not generate the momentum towards the trend. However, when the breakout takes place with a single candle, the price heads towards the trend’s direction in no time. Thus, if we do not want to hang around with our entries and keep an amazing winning rate, we may take entries on a breakout that takes place with good momentum.

Categories
Forex Price-Action Strategies

Price Action Trading: The Morning Star at a Breakout Level

Breakout is the first thing that attracts the price action traders to keep eying on a chart. Then, correction/consolidation followed by reversal candle breaching consolidation support/resistance is the signal to trigger an entry.

The breakout level plays an important role, which often becomes consolidation support/resistance and produces the reversal candle. Sometimes a breakout level produces even stronger reversal patterns such as Morning Star and Evening Star. When that happens, it attracts more traders and brings more liquidity. In today’s lesson, we are going to demonstrate an example where the breakout level holds the price as support; produces the Morning Star to offer a long entry. Let us get started.

The chart shows that the price heads towards the North with good bullish momentum. On its way, it makes a breakout at the highest high. The pair then produces a bearish reversal candle to consolidate around the breakout level. The buyers are to keep an eye on this chart. If the breakout level produces a bullish engulfing candle closing well above consolidation resistance, they may trigger a long entry.

The chart produces a Doji candle (tiny bullish body with long shadows both sides). The breakout level holds the price, for which the buyers are going to be very keen to keep an eye on this pair. If the next candle comes out as a bullish engulfing candle, it would also form a candlestick pattern called Morning Star.

The chart produces a bullish engulfing candle closing well above consolidation resistance. A bullish engulfing candle is enough to attract the buyers to go long in this chart. The combination of the last three candle forms Morning Star, which is a strong bullish reversal candlestick pattern. The buyers may trigger a long entry right after the last candle closes. Stop Loss is to be set below the breakout level and Take Profit is to be set with 1R. Let us proceed to the next chart to see how the trade goes.

The next candle comes out as a bullish candle. The buyers seem to have taken control. The price may hit the target soon.

It takes only two candles to hit the target. Traders make some green pips in a hurry. If we analyze this trade, we find

  1. The price makes a bullish breakout and comes back at the breakout level.
  2. The breakout level works as support and holds the price
  3. It produces a bullish engulfing candle closing above consolidation resistance.
  4. It produces a candlestick pattern called Morning Star as well.
Categories
Forex Daily Topic Forex Price-Action Strategies

Example of a Breakout Unfit for an Entry


In today’s lesson, we are going to demonstrate an example of a breakout on the H4 chart. The chart shows that the price heads towards the North with good momentum. It makes a bullish breakout upon consolidation. However, the breakout is not the kind that the breakout traders look for. Thus, this is going to be an example which we should skip taking entry. Let us now have a look at what happens.

The chart shows that it produces a bullish candle followed by a bearish inside bar. The next candle comes out as a bullish engulfing candle. Do you notice something here? Yes, this is an entry for the buyers. However, this is not where we concentrate today. Let us proceed to the next chart to dig out the main story.

The price keeps going towards the North. The buyers are to wait for the price to consolidate and produce another bullish engulfing candle to offer them entry. The way it has been going, it seems that the buyers hold the key and dominate over the sellers.

The price makes a bearish correction and finds its support. The first bullish reversal candle comes out as a bullish inside bar. This is not a strong bullish reversal candle. It produces three more bullish candles but the price does not make a breakout at the level of resistance. The last candle closes within the level of resistance, which is a point to be noticed. It means even the next candle makes a breakout, it would be a breakout right from the level of resistance.

The next candle closes well above the level of resistance. This is a breakout but not the kind of breakout that the breakout buyers wait for. The price is trending towards the upside; it consolidates and makes a bullish breakout. These three equations suggest that the buyers may take a long entry. They must not forget that the breakout candle does not make an explicit breakout. If a breakout takes place by one bullish engulfing candle that brings momentum. Over here, it needs four candles to make the breakout. Moreover, the breakout candle forms right at the level of resistance (now support). The buyers may restrain themselves from taking such entry. Let us find out what the price does next.

The price comes back to the breakout level. This is what usually happens when the price does not make a breakout with an A+ breakout candle. The price may still head towards the North, but 1 out of 3 times, it may come back in and hits the stop loss. Thus, to have winning consistency, we might as well skip taking entry in such price action.

Categories
Forex Price-Action Strategies

A Classic Example of the H4 Breakout Trading

In our trading lesson, we have been demonstrating H1 breakout strategies in our last five lessons. Today, we are going to demonstrate an H4 breakout trade setup, which is a classic example of price action breakout trading. The price makes a bullish breakout at the last highest high; comes back at the breakout level and produces a beautiful bullish engulfing candle closing well above consolidation resistance to offer a long entry. Let us proceed and see how it occurs.

The chart shows that the price heads towards the North with good bullish momentum. On its way towards the North, it does not produce even a single bearish reversal. It suggests that the buyers have been very confident. It makes a breakout at the last swing high. The breakout is not explicit though. However, the price continues to go towards the North after the breakout. Then, it finds its resistance and produces two bearish reversal candles. Look at the last candle. It closes within the last highest high (breakout level), which is a flipped support now. This is one of the most important factors in price action trading. The price reacts to such levels and produces reversal candles.

As mentioned, the level produces a bullish engulfing candle closing well above consolidation resistance. The buyers may trigger a long entry right after the candle closes by setting stop loss below the level of support and by take profit with 1R. Let us proceed to the next chart how the trade goes.

The last candle comes out as a spinning top. Not a good start for the buyers, but the buyers must keep patience here. Trading on the H4 chart allows traders to manage their trade and take early exit. However, they must not think taking an early exit here. The last candle is not a strong bullish candle, but it is not a strong bearish reversal either. Let us proceed to the next chart. It may take one good candle to hit the target.

The price does not take too long to hit the target. It hits the target with the last candle. This is a classic example of trading on the H4 breakout trading. After the breakout, the price comes back at the breakout level. It produces a bullish reversal candle right at the breakout level. The bullish reversal candle comes out as an engulfing candle closing well above consolidation resistance. Price actions traders wait for the price to behave like this to take an entry.


Categories
Forex Course

99. Pivot Points: What have we learned so far?

Introduction

In the previous six lessons, we discussed pivot points right from understanding what they are, to the strategies one can apply to trade the markets. Now, let’s summarize what we’ve learned so far and move on with another exciting tool for analyzing the markets.

Pivot Point Basics

A pivot point is a technical indicator in technical analysis trading, which determines potential support and resistance levels in the market. This indicator is stationary, unlike the other indicators that move with the change in price.

The pivot points are levels that are essentially determined using the previous day’s high, low, and close price. So, every trading day, we can obtain one set of the pivot point.

What is the pivot point made up of?

There are up to six levels that make up the pivot point levels. One of the levels is the pivot point level, and the rest are support and resistance levels. The six pivot levels are symbolized as follows:

Pivot Point (PP/P)

First Support (S1), First Resistance (R1)

Second Support (S2), Second Resistance (R2)

Third Support (S3), Third Resistance (R3)

Fourth Support (S4), Fourth Resistance (R4)

Fifth Support (S5), Fifth Resistance (R5)

Note that, most of the time, we stick to the levels until S3/R3 because the price does not usually touch the levels beyond it.

How are the pivot levels calculated?

As mentioned, the pivot points are calculated using the close, high, and low of the prior trading day.

For example, the Pivot Point, First Support, and First Resistance are calculated as follows:

PP = (High + Low + Close) / 3

S1 = (2 x PP) – High

R1 = (2 x PP) – Low

Similarly, one can calculate levels until R5/S5. However, these values need not be calculated practically. There are trading platforms that automatically calculate these values.

Types of Pivot Points

There are four types of pivot points based on how the levels are calculated.

  1. Standard
  2. Woodie
  3. Camarilla
  4. Fibonacci

Most of the time, the standard pivot point levels are used.

Strategies using Pivot Points

There are several ways through which one applies pivot points. In our course, we have listed out three strategies.

Range trading strategy

According to this strategy, one can consider buying when the support level of the pivot points coincides with the support level of the range. A similar strategy can be applied for shorting as well.

Breakout Trading Strategy

As the name pretty much suggests, traders can consider going long or short when the price breaks above the resistance or below the support level.

Measuring Sentiment

Traders can use the pivot point level (PP) to determine the trend of the market. If the market breaks above the PP, it indicates a buyer’s market and vice versa.

Summing it up

The pivot point is that indicators that can be used every level of traders from beginners, intermediate to the advance trades. However, this indicator is not a standalone indicator. It must always be used in conjunction with other indicators and tools to have higher odds of favoring you. We hope you enjoyed this series on pivot points. Happy trading!

Categories
Forex Daily Topic Forex Price-Action Strategies

H1 Breakout Trading: Keep Holding Your Positions

Price action traders are to maintain discipline with their entry and trade management. As far as trade management is concerned, it varies on time frames. Trade management on the H4 chart and the H1 chart is different. A reversal candle on an H4 chart has more potential to change the existent trend. Thus, traders may need to think about an early exit. On the other hand, H1 breakout traders may keep holding their positions until it reaches the target. In today’s lesson, we are going to demonstrate an example of this.

The chart shows that the price after being bullish has rejections at a level of resistance. The price heads towards the North but does not make any breakout. It has been in the bearish correction again. Let us see whether it finds its support and makes a bullish breakout or not.

Here it comes. The price finds its support and produces a bullish engulfing candle breaching the level of resistance. This is an A+ breakout candle. The buyers are to wait for the next candle to close above the breakout candle to trigger a long entry.

The next candle comes out as a bullish candle as well. It has an upper shadow, but the last 15 candle comes out as a bullish candle. The buyers may trigger a long entry right after the last candle closes by setting stop loss below the support level and take profit with 1R.

The price heads towards the North. However, it seems that the price does not head towards the target with good bullish momentum. Moreover, the last candle comes out as a bearish engulfing candle. This is ominous for the buyers. Do not forget this is an H1 chart, and the buyers are not supposed to take an early exit. They should keep holding their position and wait for the price to do the rest.

The price gets rather choppy. It has been testing traders’ patience. It is hard to keep holding positions. However, traders must not keep looking at the chart. Meanwhile, they might as well concentrate on other charts to find out potential entries.

Patience pays back to the buyers at last. The last candle comes out as a bullish candle, which helps the buyers to reach their take profit target. In the end, the trade goes well for the buyers. It may have gone the other way, but H1 breakout traders should stick with their plan and keep discipline.

Categories
Forex Daily Topic Forex Price-Action Strategies

Breakout Length: Key to Trend’s Strength

In today’s lesson, we are going to demonstrate the relation between the trend’s strength and breakout length. The breakout length usually represents one-fourth of a potential trend. If the breakout length is 25 pips, the trend may sustain up to 100 pips before making a big correction or long consolidation. It is important for breakout traders since the market often makes a breakout; confirms the breakout. However, the price does not head towards the trend direction. Let us clarify this by the examples below.

The price has been bearish upon making a bearish engulfing candle. The last swing low is quite far. This means the breakout length looks good for the sellers. The more the breakout length, the better it is for the traders.

The chart produces a bullish engulfing candle in between. This is bad for the sellers. The price may find its new resistance to produce a bearish reversal candle to make a breakout at the lowest low. This means the breakout length most probably needs to be adjusted.

The price seems to have found its new resistance here. It produces a do candle followed by a bearish engulfing candle. This means it produces an evening star. If the price heads towards the South and makes a breakout, the sellers may go short upon breakout confirmation. However, they must calculate new breakout length from the new resistance to the lowest low.

Here comes the breakout candle. This is an explicit breakout. The sellers are to wait for the price to make a breakout confirmation. If the next candle closes below the breakout candle, the sellers may trigger a short entry.

The confirmation candle looks to be an A+ breakout confirmation candle as well. However, do not forget the distance the price has already crossed. The price has crossed about 70% length considering the breakout length. Thus, the price may make a bullish correction. It usually happens when the price finds a new level of support/resistance. Let us proceed to the next chart.

The chart produces a big bullish engulfing candle, which changes the entire scenario. It happens when the price is about to make a correction. Sometimes corrective wave changes the trend. The sellers if the blindly trigger a short entry after the breakout confirmation without calculating breakout length and trend’s strength, they are to take a loss here.

Breakout strategy traders must calculate breakout length to determine how far the price could go. If it crosses more than 50% to confirm the breakout, it is better to skip such entries.


Categories
Forex Course

96. Trading Breakouts using Pivot Points

-Introduction

We know that pivot points are no different from the typical support and resistance levels. We also saw how these levels were respected when trading a ranging market. But, could it used to trade breakouts? Let’s find out in this lesson.

Just like your normal Support and Resistance, the pivot levels don’t hold forever. At one point or the other, the price breaks out from these levels. In our range strategy, we always hit buy at the support and sell at the resistance. But there are times the market breaks from these levels and stops us out. When such things happen, we can develop another plan ready for the same and take advantage of it.

In the trading community, there are two types of traders: aggressive traders and conservative traders. And the approach to trade breakouts is different for both. So, we made two strategies to benefit the aggressive as well as the conservative traders.

The Pivot Points Breakout Strategy

Doing it the Aggressive way

The aggressive approach to trade breakouts is very simple. The strategy for such traders is to trigger the trade when the price breaks above resistance or below the support. The logic to this is that the resistance/support which was supposed to hold is now not being respected. It means that the opposite party is showing more strength. Hence, we will also be following the stronger side.

Aggressive traders are the ones to catch the initial move of the breakout. But there is high risk involved in these types of entries.

Trade Example

Below is the chart of GBP/CHF on the 15min timeframe. The pivot points are marked as shown. Initially, we can see that the price broke below S1 support. Here, aggressive traders can get in for a sell after the close of the candle. Later, the price continued to fall down and ended up breaking the S2 support as well. This could be another entry for the aggressive breakout traders.

Placements

As aggressive traders, it is important to have good risk management on the trades. The most basic necessity is the placement of stop-loss and take-profit orders. For the above trades, traders can keep the stop-loss just above the level they entered the trade. However, it would be better to place the stop-loss much higher than that level because we can stay safe from spikes. And a typical TP would be the next Support level. Refer to the above chart to get better clarity on it.

Doing it the Conservative way

The conservative approach is more of a safe approach to trade breakouts. According to this strategy, look to enter the trade when the price retests the level after breaking through that level. In trading terms, this is called the ‘role reversal’ concept. This concept simply means the turning of ‘support into resistance’ and ‘resistance into support.’ For example, when the price breaks below the support level, it is not a ‘support’ anymore; but is now ‘resistance.’ Now, let’s put this into action.

Consider the same chart shown above. We shall be looking if there are opportunities for conservative traders in the same market. In the below chart, we can see that the market broke below the S1. So, now we treat S1 as the resistance and prepare to sell when the price retraces to the S1 level. Similarly, we can enter for a sell when the price breaks below S2 and retests back to S2.

When it comes to the placement of stop-loss and take-profit, one can follow the same approach, as explained in the aggressive traders’ placement.

This brings us to the end of this lesson. Note that the above strategy is only to get an understanding of how to trade breakouts using pivot points. It is highly recommended to apply other technical tools to have more odds in your favor. Cheers.

[wp_quiz id=”69720″]
Categories
Forex Price-Action Strategies

Breakout Confirmation Candle and the Difference It Makes

Breakout trading strategy traders first wait for the breakout with good momentum. Then, they are to wait for the breakout confirmation candle. A breakout can be confirmed in two ways. It can take the price towards the trend, or it could come out as in inside bar reversal candle. As long as the candle closes below the breakout level, it confirms the breakout. However, these two types of breakout confirmation push the price towards the trend a bit differently. In today’s article, we are going to demonstrate an example of this.

The price after being bearish makes a bullish correction. The last candle comes out as a bearish pin bar. This is a strong bearish reversal signal. The sellers are to wait for the price to head towards the level of support, where the price has a bounce earlier.

The price heads down with good bearish momentum. It seems that it is going to make a breakout at the drawn level. The breakout sellers are to keep their eyes on the pair closely to take a short entry upon a bearish breakout and breakout confirmation.

Here it comes. The last candle breaches the level of support closing well below it. This is an explicit breakout, which the sellers wait for. If the next candle confirms the breakout, the sellers may drive the price towards the South further.

The next candle comes out as a bullish inside bar. However, it closes within the breakout level. It means the breakout is valid. It is not an A+ breakout confirmation. It offers less reward and does not drive the price towards the trend with good momentum. If the candle came out as a bearish candle closing below the breakout candle, it would be a different ball game. The price may make a move towards the downside by offering 1R at least. Let us see what happens here.

The next candle comes out as a bearish candle. Some sellers may trigger a short entry. In most cases, it does not travel as far as it has traveled to offer the entry.

It produces a strong bearish candle. It seems that the sellers are in control. The question is whether it travels the same distance of Stop Loss-Entry or not. Let us find out from the next chart.

The price starts making an upward correction. It goes back within the breakout level. This chart does not look good for the sellers any more unless it makes a bearish breakout at the last lowest low.

We have seen that the breakout candle and breakout momentum are good. However, the price does not head towards the trend and travel the distance as it usually does. This is what happens if the breakout confirmation candle comes out as an inside bar reversal candle. Thus, it is best if we skip taking such entry.

Categories
Forex Daily Topic Forex Price-Action Strategies

Do Not Give Up Until It Is Void

Forex traders have to have no given up attitude. With patience, discipline, and diligence they have to stick with a chart unless it is completely messed up. In today’s lesson, we are going to demonstrate an example of this.

The chart shows that the price makes a strong bearish move. It finds its support and heads towards the North for an upward correction. Look at the last candle on the chart. This comes out as a bearish engulfing candle, which the sellers wait for in such price action. If the price heads towards the downside and makes a breakout followed by a breakout confirmation, the sellers are going to trigger a short entry. Let us proceed to the next chart.

The sellers do not expect this. The price does not head towards the downside. It rather goes towards the North and roams around the level of resistance. It is painful for the sellers. However, observe on the chart that the level of resistance is still intact. The price may head towards the North but the sellers still have a chance. Let us see what happens next.

The sellers are on their toes again. The chart produces an inverted hammer followed by another long bearish candle. If the price makes a breakout and confirms that, the sellers are going to trigger a short entry.

Here comes the breakout candle. A good-looking bearish candle breaches the level of support closing well below it. This is an explicit breakout. The sellers are to wait for the next candle to close below the lowest low of the breakout candle to trigger the entry.

The next candle comes out as a bearish candle closing well below the breakout candle. The sellers must not waste a second here but trigger the entry right after the last candle closes. A dead-looking chart for the sellers ends up producing entry. Let us proceed to the next chart to find out how the trade goes.

The price heads towards the South in a hurry. It is quite a big bearish move, which offers more than 1R. A trade setup works wonderfully well for the sellers.

Let us recap the entry again. It looks good at the beginning. The price then goes towards the upside and it seems that it may not offer a short entry. The price finds its resistance at the same level; makes a breakout followed by a breakout confirmation. As far as breakout strategy is concerned, the sellers trigger a short entry and make a profit out of it. This is why traders must not give up but stick with the chart as long as it’s valid to produce a signal.

Categories
Forex Signals

Bear Continues its Domination

Chart EUR/JPY H1 Chart

EUR/JPY made a strong bearish move on the H1 chart yesterday. The chart shows that it made a breakout at yesterday’s lowest low today. As of writing, the last candle closed well above the breakout candle. A short entry is triggered at 116.370. The price may head towards the South and find its next support at around the level of 115.255 area.

Let us have a look at the trade summary

Entry: Sell at 116.370

Stop Loss: Above 117.640

Take Profit: 115.255