Categories
Forex Daily Topic Forex Price Action

Double Top-Engulfing Combination and Trade Management

In today’s lesson, we are going to demonstrate an example of daily-H4-combination trading. The trade setup starts with a double top, and the trend-initiating candle comes out as a bearish engulfing candle. The price consolidates and produces another bearish engulfing candle closing below consolidation support. We find out what happens next and how we may manage the trade to get the best result out of it.

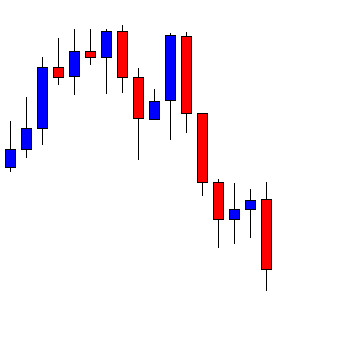
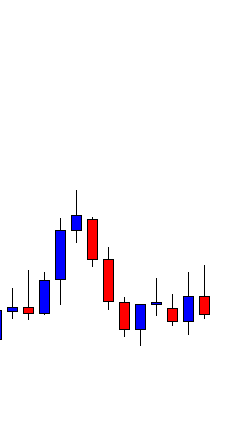
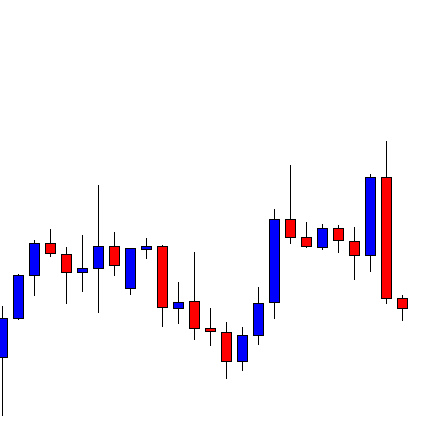
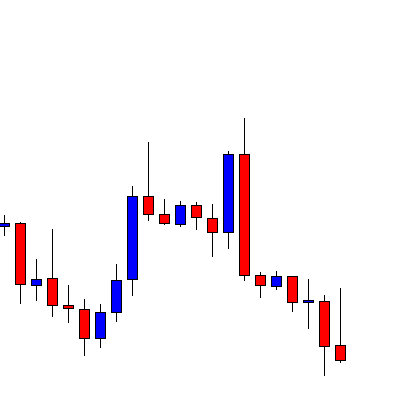
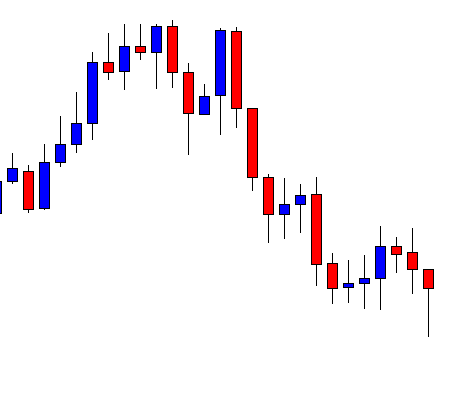
This is an H4 chart. The chart shows that the price produces a double top. At the second rejection, the reversal candle comes out as a bearish engulfing candle and drives the price towards the South with good bearish momentum. Upon finding its support, it consolidates for a while and produces another bearish engulfing candle. We know what the daily-H4 combination traders are to do here.

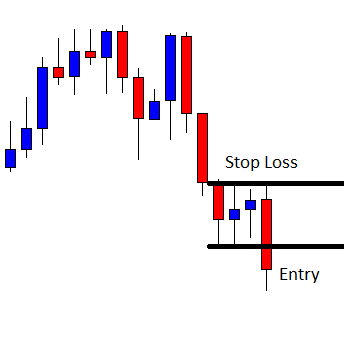
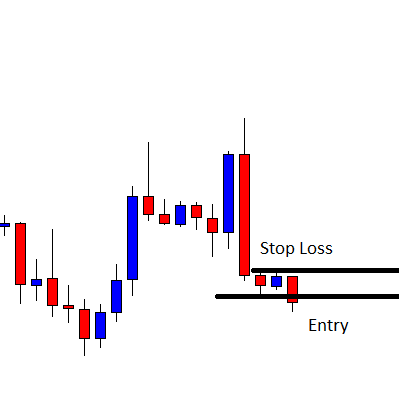
The daily-H4 combination traders may trigger a short entry right after the last candle closes by setting stop-loss above consolidation resistance and by setting take profit with 1R. Let us proceed to the next chart to find out what the price does after triggering the entry.

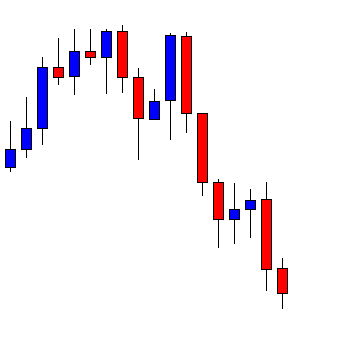
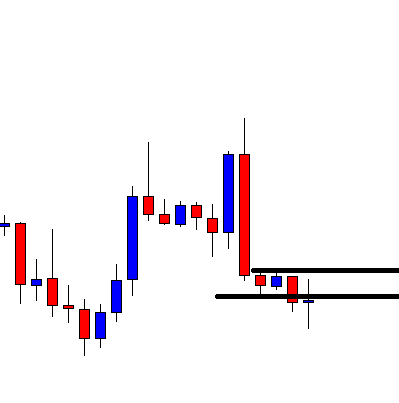
The next candle comes out as a bearish candle as well. It looks good for the sellers. It seems the price may not take too long to hit the target of 1R. Let us proceed to the next chart.

It does not look good for the sellers now. The last candle comes out as a bullish engulfing candle. It suggests that the price may get bullish and hit the stop loss. Since this is an H4 chart, traders are to manage their trades according to the candlestick. The entry is carrying a loss now. Traders have three options here.

  1. They may close the whole entry
  2. They may let the whole trade run
  3. They may close 50% of the entry

It depends on an individual trader how he likes to manage his trades. Some traders may want to keep the whole trade, and some may want to close the whole trade. There is a saying that cut your losses short and let your profit run. Thus, we may manage the trade by closing half of it and let the rest of it run. This is how we earn or lose 50% of the initial target. Let us see how it goes now.

The chart produces a spinning top and heads towards the downside. The last candle comes out a hammer, but it hits the target of 1R. This means the trade setup brings profit for the sellers. It may have gone another way round. Thus, in such a situation, taking out half of the trade offers us less profit but less loss as well in the end. It does not always happen. However, when it does, we may consider managing the trade by doing it so.

Categories
Forex Daily Topic Forex Price Action

When a Double Top and an Engulfing Candle Comes Together

In today’s lesson, we are going to demonstrate an example of a chart where the price heads towards the downside upon making a double top. At the second rejection, the chart produces a bearish engulfing candle. Usually, a combination of these two does not usually go wrong. The price does not make a deep consolidation afterward. However, it still heads towards the South with good bearish momentum. Let us have a look at how it happens.

This is a daily chart. The chart shows that the last candle comes out as a Shooting Star. The daily –H4 combination traders may consider it as a bearish reversal candle and flip over to the H4 chart.

The H4 chart shows that the price produces a double top. At the second bounce, the reversal candle comes out as a bearish engulfing candle. This combination may attract the sellers to look for short entries upon consolidation and getting bearish reversal candle.

The chart produces a bullish candle. It finds its resistance and produces a bearish engulfing candle closing below consolidation support. The sellers may trigger a short entry right after the last candle closes by setting stop-loss above consolidation resistance and take profit with 1R. Here is an equation that we may think about that. The price does not make a deep consolidation. Since the price is bearish upon a double top and an engulfing candle, most probably, it will make a strong bearish move. However, if you are in doubt, leave it out. Let us proceed to the next chart to find out what happens.

The next candle comes out as a doji candle. The price heads towards the Stop Loss, but it does not hit, though. It looks good for the sellers since the candle closes below the breakout level. Let us proceed to the next chart to find out what the price does.

The chart produces a long bearish candle and hits the target of 1R. Shallow consolidation may hold the price back a little to hit the target in a hurry. However, in the end, the sellers make some green pips with a combination of a Double Top and an Engulfing candle.

This trade setup does not meet all the requirements for combination breakout trading. The trend starts from a Double top resistance along with a bearish engulfing candle; it continues its bearish journey with more candles even after a shallow consolidation. This is what a combination of a Double Top/Bottom along with an engulfing candle can do. Thus, be keen on a chart if a trend starts with a combination of these two.