Categories
Forex Daily Topic Forex Price Action

Trendline Trading: A Trendline forming with a Tiny Slope

In today’s lesson, we are going to demonstrate the formation of a down-trending Trendline. A trendline can be formed with a double top or double bottom as well. However, double top’s resistance or double bottom’s support may not be horizontal. Let us find out how they may look in the chart.

The chart shows that the price heads towards the South with moderate bearish pressure. The last candle comes out as a bearish engulfing candle closing well below the last swing low. The sellers may wait for the price to consolidate or make a bullish correction to go short.

The chart produces two bullish candles. The price has a rejection from the zone where it had a rejection earlier. The last rejection does not come from horizontal support, but it looks adjacent to that. Thus, it can be considered as a double top’s resistance zone.

The price heads towards the South by making a breakout at the last swing low. It produces a bullish inside bar. If the chart produces a bearish reversal candle, the sellers may go short below the last swing low. Let us proceed to find out what happens next.

The price gets bearish by making a breakout at the last swing low. Look at the last three candles. The combination of these three candles is called Morning Star. It seems that the price may make a long bullish correction. Can you guess where the price may find its next resistance?

We can draw a down-trending trendline here by using those points of the double top. Look at the price action around the trendline’s resistance. The last candle comes out as a bullish candle with an upper shadow. A bearish reversal candle at the trendline’s resistance may drive the price towards the South again.

The trendline’s resistance produces a bearish engulfing candle. It has a long lower shadow, though. The sellers may go short below the last candle’s lowest low. Let us find out what the price does.

As expected, the price makes a strong bearish move and makes a new lower low. Thus, the sellers may wait again for the price to go towards the trendline’s resistance and get a bearish reversal candle to go short in the pair. In a word, a very valid trendline is in play in this chart. Do you remember how it has started? It has started from a point that does not seem to form a trendline. The slope has been tiny, making it difficult to spot out. However, the market often produces such a trendline with a tiny slope, which shall be taken into account by the trendline traders.

Categories
Forex Price Action

Chart Combination Trading: Even an Inside Bar Has a Lot to Offer

An Inside Bar is considered the weakest reversal candle as far as candlestick trading is concerned. However, in today’s article, we find out the significance of a daily Inside Bar in the daily-H4 chart combination trading. Let us get started.

This is the daily chart. The chart shows that the last candle comes out as a bearish Inside Bar. The daily chart traders may still think that the chart is bullish biased. However, the daily-H4 chart combination traders are to flip over to the H4 chart and look for short entries since it is a bearish reversal candle after all.

The H4 chart looks to be tailor-made for the sellers. The chart produces a double top, and the price breaches the neckline. The last candle comes out as a doji candle. The price may consolidate now.

The chart produces another bearish candle closing within the same resistance. Then, it creates a bullish engulfing candle. Let us draw two lines here. The level of support looks very evident. However, the level of resistance still has a lot to prove.

The level of resistance produces a bearish reversal candle. To be precise, it creates a bearish engulfing candle, closing below the level of resistance. The sellers may trigger entry right after the last candle closes by setting stop-loss above the level of resistance and by setting take profit with 1R.

The price heads towards the South in the next candle as well. It seems that the sellers may not have to wait too long to achieve their target. Let us proceed to the following chart to find out how it goes.

As expected, the next candle comes out as another bearish candle. This time it has even a longer body. Look at the last candle. The candle comes out as a bullish inside bar. Technically, the chart is still bearish biased. Do not forget that for the H4-H1 chart combination trading, they may have to flip over to the H1 chart to go long in the pair. This is what we have just demonstrated in the daily-H4 chart combination trading.

To sum up the lesson, an Inside Bar may not be a strong reversal signal in the chart. For the chart combination traders, it is a bit different. As long as it is a reversal candle does not matter how weak it is. The combination traders may flip over to the counterpart and wait for consolidation and a signal candle to trigger entry.

Categories
Forex Price Action

H1-15M Combination Strategy: Entry upon Consolidation and Fibo Targets

In today’s lesson, we are going to demonstrate an example of the H1 -15M combination trading strategy offering entry upon consolidation. We are going to integrate Fibonacci levels to see how far the price moves. This would give us an idea of how effective Fibonacci levels are to determine the stop loss and take profit level. Let us get started.

The H1 chart shows that the price makes a strong bearish move and finds its support. The black marked level is the level of H1 support here. The price moves towards the North with two candles and may have found its resistance. One of the candles comes out as a bearish engulfing candle. Traders are to wait for an H1 breakout followed by a 15M bearish reversal candle to go short in the pair. Let us see what happens here.

The chart produces one more bearish candle followed by a doji candle. It means the price consolidates in this chart. The next candle closes just below the level of support. Ideally, this is not a perfect breakout candle. However, the price consolidates and produces an H1 bearish reversal candle (the last candle). This is a signal that the price may get bearish and head towards the South. Let us flip over to the 15M chart.

The 15M chart shows that the last candle comes out as a bullish candle. Do not forget that H1 candle closes with a bearish body. Thus, a 15M bearish reversal candle (preferably engulfing candle) will push the price towards the South.

Look at the last 15M candle. It comes out as a bearish engulfing candle closing well below the last candle. This means the price may head towards the South with good bearish momentum. Let us proceed to the next chart with Fibonacci levels to find out how far the price heads to.

The price trends from the 78.6% level and reaches 161.8%. Usually, the 78.6% Fibo level drives the price towards the level of 138.2% with good momentum. It often reaches up to the level of 161.8% because of momentum. However, we may set our target at 138.2% if it trends from 78.6%. Another point you may have noticed is that we draw Fibonacci levels by using the lowest low, not the H1 support. These are two different things.

If the H1 chart makes a straight breakout, we may wait for a 15M reversal candle to take entry. If it consolidates and produces an H1 reversal candle, we may trigger entry if 15M chart produces a strong reversal candle closing well below the wave’s lowest low. Do some backtesting; you will see many charts where the price makes a move like this. Stay tuned. We will reveal more examples of this.


Categories
Forex Daily Topic Forex Price Action

The Levels You Need to Pay Extra Attention

Support and Resistance are the two key factors of Forex trading. The good thing is in most cases time these levels can be guessed well earlier. By drawing support/resistance levels where the price reacts earlier,   we can spot those levels. This helps a trader set his stop loss, take profit and make a trading decision. In today’s lesson, we are going to demonstrate an example of how the previous levels where the price reacts earlier play a significant part as far as support/resistance is concerned.

Look at the chart carefully. The price makes a strong bearish move and makes an upside correction. The chart produces a spinning top followed by a bearish engulfing candle. If we consider the existent trend and candlestick pattern, it is a short signal. The question is whether it really is a short signal or not. Look at the next chart.

At the correction, one of the candles breaches through a level. This level was a level of support earlier. After being bearish, the level should work as a level of resistance. It does not. The price breaches through the level. In fact, it may work as a level of support again. If it produces a bullish reversal candle, the buyers are going to take control here.

The level seems to hold the price as a level of support. It produces two a bullish pin bar and a doji candle. If it produces a bullish engulfing candle here, the price may get bullish and head towards the North.

The chart produces a bullish engulfing candle closing well above the wave’s highest high. Let us calculate whether the buyers should go long here or not. The price makes a bullish move breaching a significant level. The price makes a bearish correction and the breakout level works as a level of support. As far as price action trading is concerned, traders may trigger a long entry right after the last candle closes.

As expected, the price heads towards the North with good bullish momentum. It gets the buyers 1R already. The last candle comes out as a bearish inside bar. The price may reverse now. However, there is still a 40% possibility that the price continues its bullish move. Let us assume that the buyers close the trade and cash in some profit.

If we consider the whole scenario, the market seems bearish in naked eyes. When we draw the significant level, it gives us a clearer picture of the breakout and correction. We, then realize that the market is actually bullish. A long entry at the pullback gets the buyers some green pips. This is what Support and Resistance (significant levels) do.

Categories
Forex Daily Topic Forex Price Action

When a Double Top and an Engulfing Candle Comes Together

In today’s lesson, we are going to demonstrate an example of a chart where the price heads towards the downside upon making a double top. At the second rejection, the chart produces a bearish engulfing candle. Usually, a combination of these two does not usually go wrong. The price does not make a deep consolidation afterward. However, it still heads towards the South with good bearish momentum. Let us have a look at how it happens.

This is a daily chart. The chart shows that the last candle comes out as a Shooting Star. The daily –H4 combination traders may consider it as a bearish reversal candle and flip over to the H4 chart.

The H4 chart shows that the price produces a double top. At the second bounce, the reversal candle comes out as a bearish engulfing candle. This combination may attract the sellers to look for short entries upon consolidation and getting bearish reversal candle.

The chart produces a bullish candle. It finds its resistance and produces a bearish engulfing candle closing below consolidation support. The sellers may trigger a short entry right after the last candle closes by setting stop-loss above consolidation resistance and take profit with 1R. Here is an equation that we may think about that. The price does not make a deep consolidation. Since the price is bearish upon a double top and an engulfing candle, most probably, it will make a strong bearish move. However, if you are in doubt, leave it out. Let us proceed to the next chart to find out what happens.

The next candle comes out as a doji candle. The price heads towards the Stop Loss, but it does not hit, though. It looks good for the sellers since the candle closes below the breakout level. Let us proceed to the next chart to find out what the price does.

The chart produces a long bearish candle and hits the target of 1R. Shallow consolidation may hold the price back a little to hit the target in a hurry. However, in the end, the sellers make some green pips with a combination of a Double Top and an Engulfing candle.

This trade setup does not meet all the requirements for combination breakout trading. The trend starts from a Double top resistance along with a bearish engulfing candle; it continues its bearish journey with more candles even after a shallow consolidation. This is what a combination of a Double Top/Bottom along with an engulfing candle can do. Thus, be keen on a chart if a trend starts with a combination of these two.

Categories
Forex Chart Basics Forex Daily Topic

Chart Combination Traders: Do Not Forget to Calculate This

In today’s lesson, we are going to demonstrate an example of the Daily-H4 chart combination, which may end up producing a trading signal. We find out soon whether it produces a trading signal or not in the end. Let us get started.

This is the daily chart. The chart shows that the price makes a strong bullish move. It seems that the price has found its resistance. The last candle comes out as a bearish engulfing candle. This suggests that the sellers in the intraday charts may get themselves engaged to look for short opportunities in the pair. Let us flip over to one of the major intraday major charts, the H4 chart.

The chart shows that the price makes a strong bearish move and produces a bullish engulfing candle followed by a bearish inside bar. However, the daily candle ends up being a bearish engulfing candle, thus the H4 sellers have an upper hand than the buyers.  Let us proceed to the next chart with some drawings in it.

The price bounces off at the red marked level. The sellers are to wait for the price to make a breakout at the level of support to go short in the pair. The last candle in this chart comes out as a bearish inside bar. The price may head towards the level of support and make the breakout. However, the sellers may have to wait since an inside bar is not a strong reversal candle. Let us find out what happens next.

The price heads towards the South and bounces off several times at the level of support. It does not make the breakout though. The last candle comes out as a bullish engulfing candle too. A bullish engulfing candle at the level of support indicates that the buyers may get themselves engaged in buying soon. Moreover, there are six H4 candles after that bearish engulfing daily candle (A trading day contains six H4 candles). The level of support has become daily support now. Thus, the H4 sellers must wait for the daily chart to produce another bearish candle before going short in the pair.

It is often seen that if an H4 candle breaks a daily support/resistance, the price does not head towards the breakout direction in a hurry. It often consolidates around the level, which sometimes makes traders lose money. The same thing shall be maintained in the H4-H1 chart combination as well. If an H1 candle does not make a breakout (after an H4 reversal candle) within next four H1 candles, the support resistance becomes H4 support/resistance. Traders shall wait for upcoming H4 candles to give them the price direction and trade.

Categories
Forex Price-Action Strategies

A Different Kind of Breakout Does Its Job Well

In today’s lesson, we are going to demonstrate an H1 breakout trade setup. Usually, the breakout candle makes a breakout by breaching through a level of support/resistance. Today, we are going to study about a breakout that takes place right at the level of resistance, which becomes support after the breakout. We need to be familiar with such a breakout since it happens quite a lot.

The price produces a bullish engulfing candle. The buyers wait for such a good-looking bullish reversal candle. They shall wait for the price to go towards the level of resistance and makes a breakout later. Let us proceed to the next chart.

The price heads towards the North but not right after the reversal candle. However, the bullish momentum looks good. Look at the last candle. It closes right at the level of resistance. It seems the price may make a breakout here soon.

The next candle closes well above the level of resistance. However, the candle is formed right at the level of resistance. Typically, a bullish breakout candle’s 25% of its lower body shall remain below the level of resistance. In this case, candle’s 100% (almost, ignore that very tiny lower body) body is above the level of flipped support. Such a breakout takes place in the Forex market very frequently.

The next candle closes well above the breakout candle. This means the breakout is confirmed. The buyers may trigger a long entry right after the last candle closes.

After triggering the entry, the price heads towards the upside with good bullish momentum. The chart produces two consecutive bullish candles after breakout confirmation. The buyers shall wait for the price to hit the target. For that, the price still has some space to travel towards the North.

The price hits the target and comes back down a little. It goes towards the level again. In this trade setup, the breakout candle’s breakout is not a good one that price action traders look for. In many cases, we may see that the chart does not confirm a breakout but goes another way around. It happens because such a breakout consumes some extra space. Thus, the majority of such breakouts are not confirmed and may not end up offering entry. However, once the breakout is confirmed, and there is enough space for the price to travel, most likely trade setup would work in traders’ favor. In the beginning, we may get puzzled with such a breakout. The fact is if the next candle after a breakout closes above (bullish market) the breakout candle, it is a valid breakout and works as well as the typical breakout candle does.

Categories
Forex Price-Action Strategies

Trading on the Daily Chart: The Inside Bar May Disappoint You More Often

In today’s article, we are going to demonstrate an example of price action trading on the daily chart. In price action trading, a reversal candle or reversal pattern means a lot. Usually, the engulfing candle, track rail, morning start, or evening star are considered strong reversal candles or patterns in price action trading. On the other hand, the inside bar is not considered a strong bearish reversal candle. In the daily-H4 chart combination trading, an inside bar still may offer a good entry since traders take their final decision depending on the H4 chart. To trade on the daily chart, it may be a different case in most cases. Let us have a demonstration of this.

After being bullish for several daily candles, the chart produces an inside bar at a resistance zone. To trade on the daily chart, traders wait for the price to produce a corrective candle followed by another candle towards the trend’s direction. Over here, traders are to wait for a bullish corrective candle followed by a bearish reversal candle closing below the level of support to offer a short entry.

The chart produces a bullish inside bar. Things are going according to the sellers’ expectations. If the chart produces a bearish engulfing candle closing below the last candle’s lowest low, the sellers may trigger a short entry. Let us proceed to the next chart.

The last candle comes out as a bearish engulfing candle closing well below the level of support. The nearest swing low is far enough, which offers an excellent risk-reward. The sellers may trigger a short entry right after the last candle closes.

Things are not going according to the sellers’ expectations. Anyway, the sellers must be patient with the position. Let us proceed to the next chart and find out what the price does next.

The price consolidates for several candles. The last two candles look good for the sellers. However, the level of consolidation support is still held. Do not forget the point that the sellers have been holding the position for the last five trading days.

It makes the sellers wait longer and heads towards the North to hit the stop loss. Taking a loss or getting the stop loss hit is a usual incident in the Forex trading. However, if we dig into this case study, we find that apart from the trend-initiating candle, everything gets A+. In trading on the daily chart, an inside bar may get us a profit on many occasions. However, if we compare it with other strong reversal pattern or candle, the winning percentage may not impress us.


Categories
Forex Price-Action Strategies

The Right Strategy with the Wrong Chart Creates a Losing Trade

In today’s lesson, we are going to demonstrate an example of the daily-H4 chart combination trading, which has everything to offer a good entry. However, the outcome is not what we would love to get. Let us dig into it and find out what may go wrong with the setup sometimes and where we have to be careful.

This is a daily chart. Look at the last candle. This is an A+ bearish engulfing candle, which the price action traders crave for. The sellers are to flip over to the H4 chart for the price to consolidate and make a bearish breakout to offer them a short entry. Let us flip over to the H4 chart.

The price consolidates for six H4 candles (remember the number six). However, it has not made any breakout. Let us assume that we keep an eye on the pair. Let us proceed to the next chart.

The chart produces a breakout candle. If we are to give it a grade, it would get A+ as well. It means everything looks good. We may trigger a short entry right after the breakout candle closes.

The price does not head towards the South according to the sellers’ expectations. It goes another way and hits the stop loss. The daily reversal candle and the H4 breakout candle both have all the attributes to attract the sellers to go short on the pair. Is there anything wrong with the entry?

First, it may happen. It does not matter how good a trade setup looks. It may get us loss. It is a game of probability after all.

Now concentrate here. This entry looks good in naked eyes but it is not. Do you remember how many candles it consolidated with? It consolidated with six H4 candles and makes the breakout by the 7th candle. It means the H4 support becomes daily support. Thus, an H4 breakout is not enough to attract the sellers to go short on the pair. To have a clearer view, have a look at the daily chart again.

The last candle comes out as a bullish inside bar. It means the pair is still bearish biased but it is for the daily traders. If the daily chart produces a bearish engulfing candle closing below the level of support, the daily sellers may go short. Meanwhile, it produces a false signal on the H4 chart and makes some sellers lose money.

Trading at the right chart with the right strategy is an important aspect to be successful in trading. It does not matter how good an angler you are. If you do not choose the right place and the right hook, you are going to come back home empty-handed.

Categories
Forex Daily Topic Forex Price-Action Strategies

High Impact News Events and Risk Management

In today’s lesson, we are going to demonstrate an example of price action trading on the daily chart. The lesson has a message if a high impact news event comes in between, what daily traders should do?. Let us get started.

This is EURJPY daily chart. The chart produces a bullish engulfing candle, which suggests that the buyers may dominate in the pair. Traders on different time frames may get themselves ready to go long on the pair. Traders who trade on the daily chart, they are to wait for the price to consolidate and produce a bullish reversal candle to go long on the pair. Let us proceed to the next chart.

The pair produces another bullish candle before creating the corrective candle. It means the buyers on the H4, H1, or 15M may have found some entries and drove the price towards the North last day. Anyway, the daily traders may keep an eye on the pair to go long upon a bullish engulfing candle closing above the last candle’s highest high.

Here it comes. A bullish engulfing candle closes above the daily resistance. The buyers may trigger a long entry right after the candle closes by setting stop loss below the candle’s lowest low. The nearest significant swing high is quite far away. It offers a tremendous reward considering the risk.

The price heads towards the North for one more candle. However, it does not get as bullish as expected. The good thing is it is a bullish candle. The buyers must hold the trade at least up to the level, which offers 1:1 risk-reward.

The pair produces a doji candle. The price hits the level, which offers 1:1 risk-reward. Then, it ends up producing a candle, which neither a bullish nor a bearish candle. Technically, the buyers shall take out at least 50% profit and let the rest of it run. As far as the price action is concerned, the price still may go towards the North further. I may give you information that this is the Wednesday market dated 11/09/2019. Here I have something interesting to show you before we start Thursday trading.

Source: Forex Factory

The pair we are dealing with here is EURJPY. Look at those news events with the EURO. The EURO pairs are to ride on a roller coaster on such news days. Let us not guess, but have a look at the daily chart to find out how it looks.

The price goes towards the trend’s direction. Do not miss the lower spike. You can see that it hits the stop loss. It is painful, but this is how the Forex market is. Thus, traders must take extra care of their positions before such high-impact news event. Otherwise, they may lose their hard-earned profit by getting hit such high impact news events.


Categories
Forex Price-Action Strategies

It is Better to be Safe than Sorry.

Using Stop Loss is an essential component of trade management. The Forex market gets volatile from time to time. Taking an entry without using Stop Loss may make an account empty. Thus, under no circumstances, we shall take any entry without using Stop Loss. We need to make sure that we set our Stop Loss accordingly, which is neither too tight nor too saggy. In today’s lesson, we are going to demonstrate an example of that.

The above chart is a daily chart. We see that the price finds its support and produces a bullish engulfing candle. The candle closes within the last swing high. The daily-H4 combination traders are to flip over to the H4 chart to take a long entry upon consolidation and bullish breakout. Let us have a look at the H4 chart.

The H4 chart looks extremely bullish. The chart produces a morning star right at the support zone and heads towards the North for one more candle. Traders are to keep an eye on the chart for the price consolidation.

The chart produces one more bullish candle. It then consolidates and creates a bullish engulfing candle breaching the last highest high on the chart. This is an ideal price action opportunity to trigger a long entry right after the last candle closes. Traders shall set the stop loss below the level of support, where the engulfing candle bounces.

The next candle comes out as a bearish candle approaching the Stop Loss level. However, if we set the Stop Loss below the support level, we would be safe here. Things do not look as good as we expected. Let us proceed to the next chart.

The next candle comes out as a bullish engulfing candle. Things look much better now. However, we must not miss the fact that the bullish engulfing candle has a bounce right at the Stop Loss level. If we set too tight Stop Loss, we would have to encounter a losing trade here. Instead of making the profit, we would lose money.

It is a debatable issue how far we shall set our Stop Loss. It is not recommended that we should set our Stop Loss too far. However, we shall set our Stop Loss below the level of support/resistance and add some extra pips. For intraday trading on the 5M, 15M, 30M, H1, and H4 chart, to measure the number of extra pips, we may use the spread of that particular pair. Let us assume we are taking a long entry on EURUSD. If the spread is three pips, we may add three extra pips to set our Stop Loss. We must do a lot of back-testing with our favorite pairs to find out the perfect measure for this to be safe with our entries. As they say, “it is better to be safe than sorry.”


Categories
Forex Price-Action Strategies

Breakout Confirmation Means a Lot

Breakout Confirmation Means a Lot


Price action traders count the breakout as one of their most essential trading components. There is another factor, which is directly related to a breakout: It is called Breakout Confirmation. A breakout is not considered as a perfect breakout on a particular chart if the breakout level does not hold the next candle. In today’s lesson, we are going to demonstrate an example of that.

Thie chart above is a daily chart. The chart shows that the price breaches the level of resistance. The candle closes above the level as well. Many traders consider it as a breakout. It is not a breakout yet on the daily chart. The price may have made a breakout on other minor charts such as the H4, H1, 15M, etc. However, to consider it as a daily breakout, traders must wait for the next daily candle to close above or within the breakout level. Let us have a look at the following daily chart.

The next daily candle comes out as a bullish pin bar and closes within the breakout level. It means that the breakout level holds the price and confirms the breakout. The price may head towards the North because of the breakout and breakout confirmation. The daily-H4 chart traders may flip over to the H4 chart for the price to consolidate and upside breakout.

The H4 chart shows that the price produces a bullish engulfing candle having a long upper shadow. However, the candle closes within the last swing high. The buyers shall wait for the price to consolidate and upside breakout.

The price keeps heading towards the North with an average bullish momentum. The last candle comes out like a spinning top, which is a sign of price consolidation. Let us proceed to the next chart to find out whether it consolidates more or makes an upside breakout.

It produces a bullish engulfing candle closing above the last swing high. The buyers may trigger a long entry right after the candle closes by setting stop loss below the consolidation support. Let us find out how the entry goes.

It goes well. It goes towards the North further even after producing a little bearish candle. Ideally, some buyers may come out with their whole trade there, and some traders may take partial profit. This is another issue. We shall concentrate on the breakout and the breakout confirmation. Since the daily pin bar candle’s body closes within the breakout level, it suggests that the trend is still with the bull. If it closes below the breakout level, things would have been different. Such things matter a lot in the Forex market and traders must consider those.

Categories
Forex Basic Strategies Forex Trading Strategies

How To Trade The Engulfing Candlestick Pattern Using Support/Resistance

Introduction

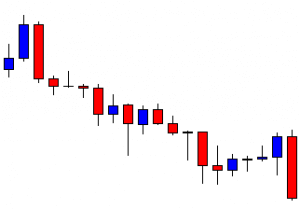
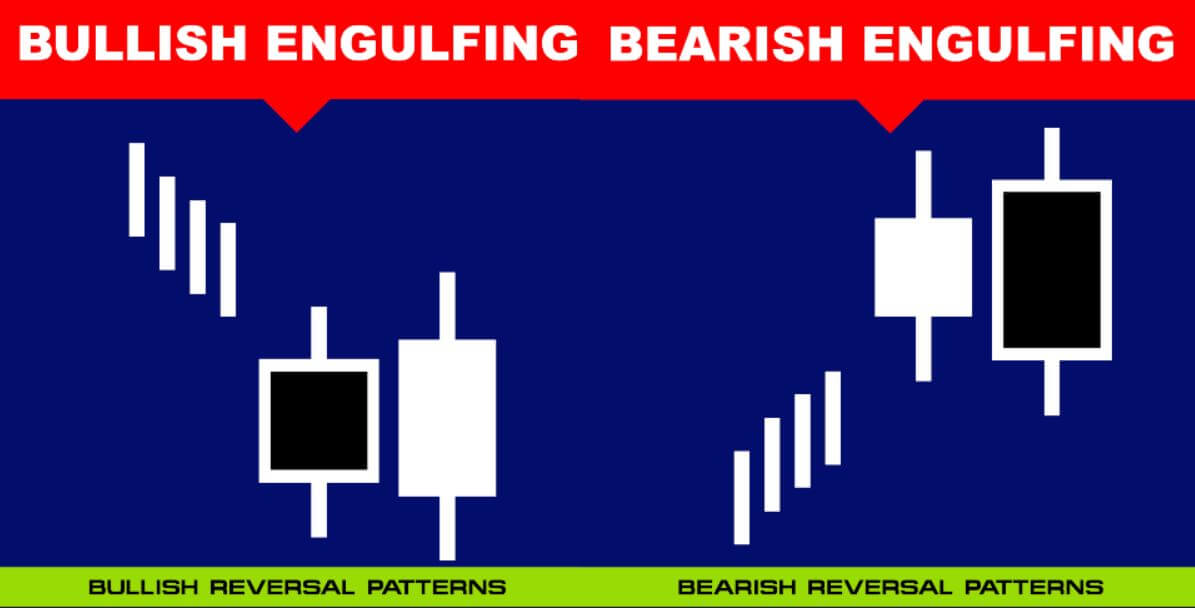
Engulfing is one of those candlestick patterns in the forex market that provides a useful way for traders to anticipate a possible reversal in the trend. There are two types of engulfing patterns – Bullish Engulfing and Bearish Engulfing. The engulfing candle’s bearish or bullishness is wholly based on its position in relation to the existing trend of an underlying asset.

Understanding The Types

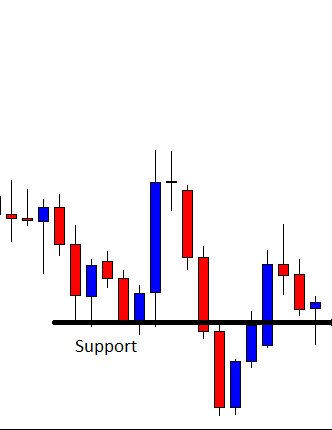
A bullish engulfing pattern can appear anywhere in the trend. But it holds more significance if it appears in a downtrend. This pattern indicates the surge in buying pressure as it shows that more buyers are entering the market, driving the price action further up. This pattern consists of a bearish red candle and the second bullish candle completely engulfs the body of the previous red candle.

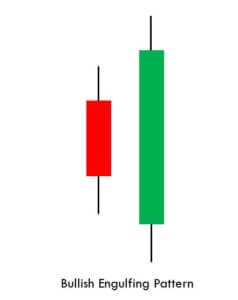
Interpretation – Always look for the bullish engulfing pattern in a clear downtrend. For entering a trade, traders must combine this pattern with support resistance levels or with any reliable technical indicator for additional confirmation of the trend reversal.

Bearish engulfing pattern is just the opposite of the bullish engulfing pattern. Instead of appearing at the bottom of the trend, this pattern appears at the top of the trend. We can say that more accurate and reliable signals can be generated when this pattern appears at the top of an uptrend. The bearish engulfing pattern consists of two candles. The first one being the green candle. This one is, next, engulfed by the subsequent red candle. The pattern triggers a reversal in an existing trend. It indicates the buyers are no longer able to push the price higher, and the bears took control of the market.

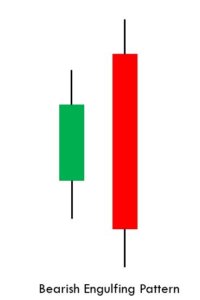
Interpretation – Always look for the bearish engulfing pattern in a clear uptrend. The second red candle must engulf the green candle ultimately, showing that bears are piling into the market aggressively. For entering a trade, traders must look for additional confirmation, such as support resistance levels or by using any reliable technical indicator.

Pairing the Engulfing pattern with Support/Resistance

Every trader has a unique way of trading the market. Some traders like to go with the trend while some traders only trade counter-trend moves. In this strategy, we have paired the engulfing pattern with support & resistance to show you how to trade the reversals correctly.

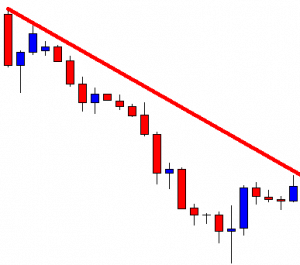
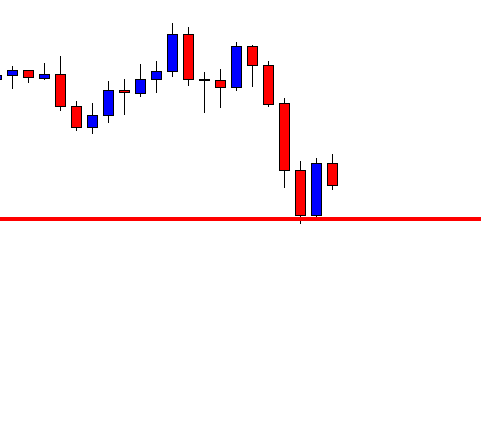
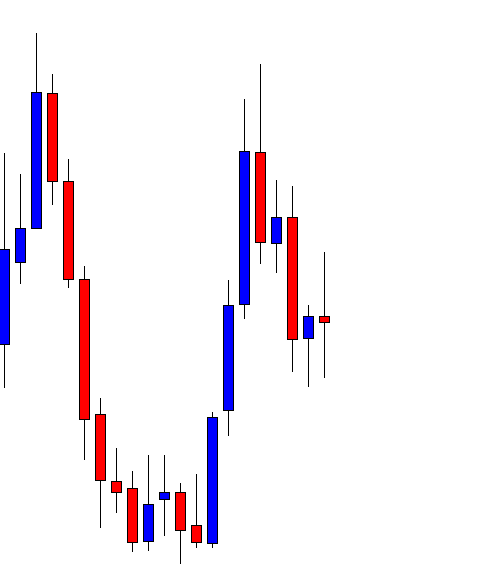
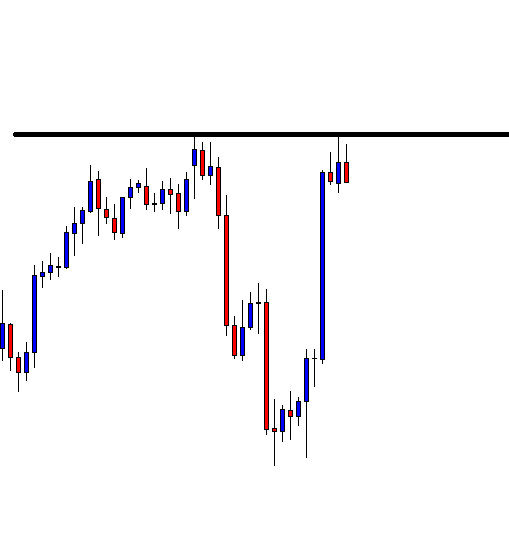
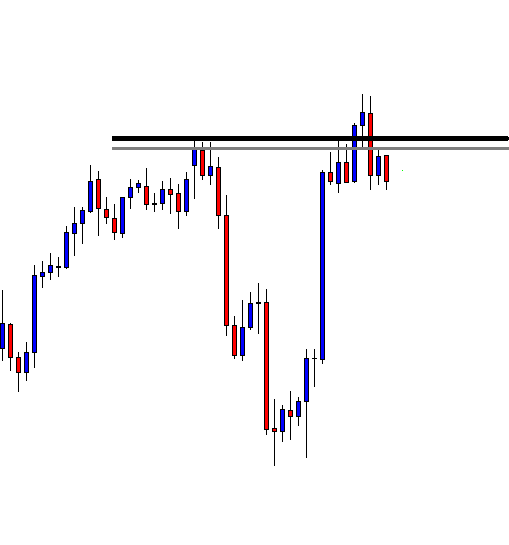
Confirm the downtrend first on your trading timeframe 

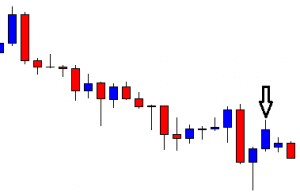
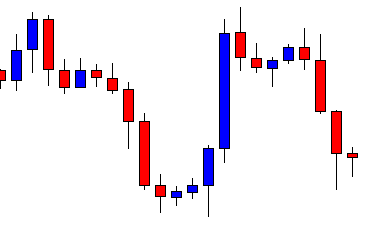
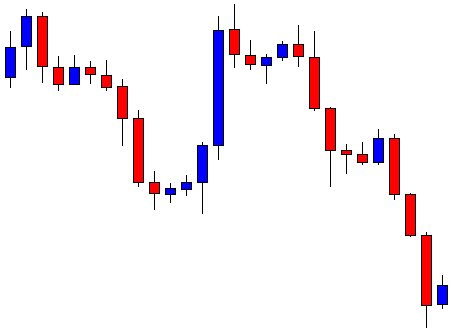
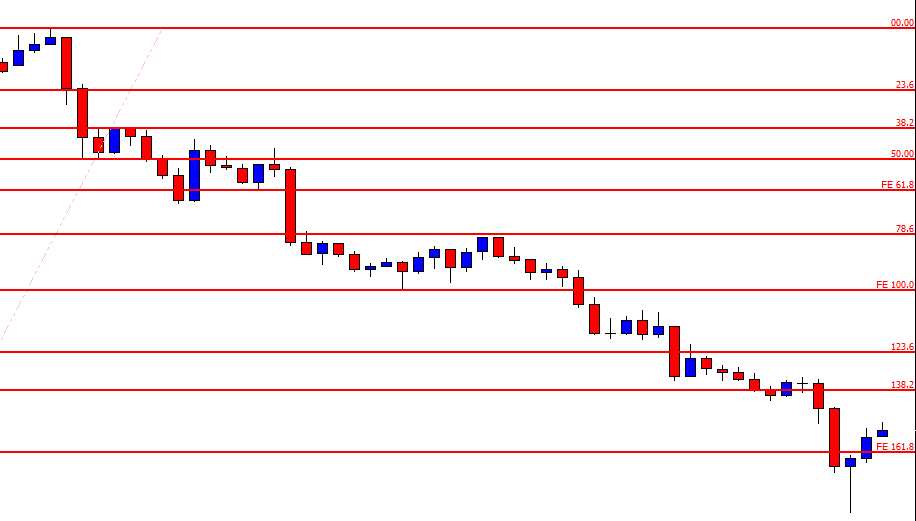
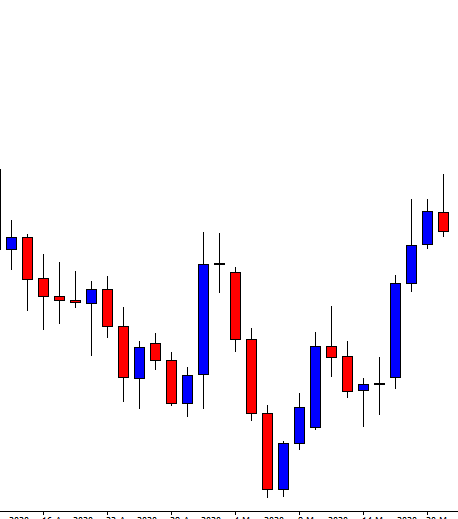
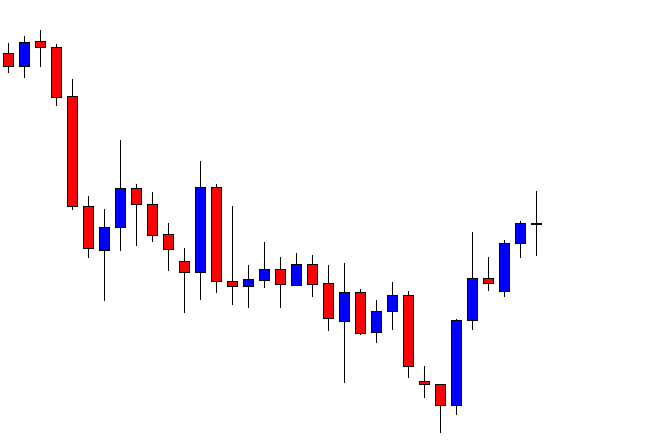
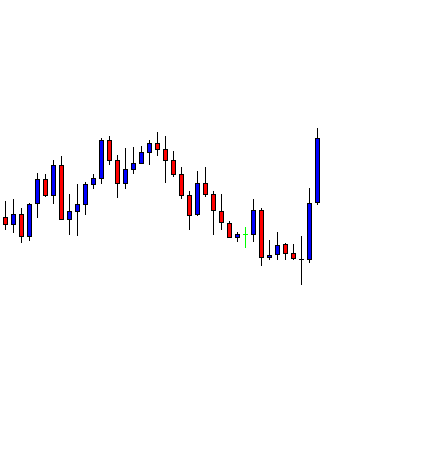
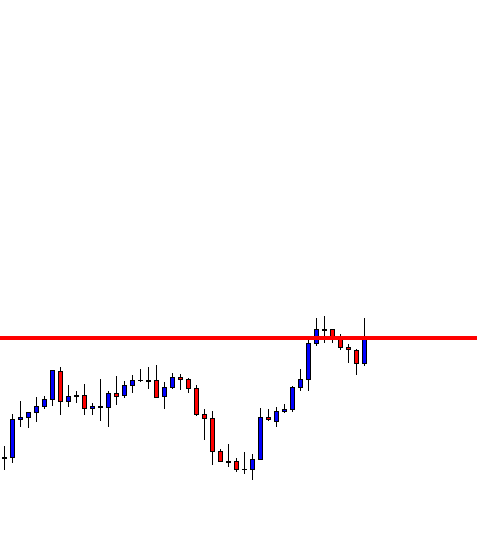
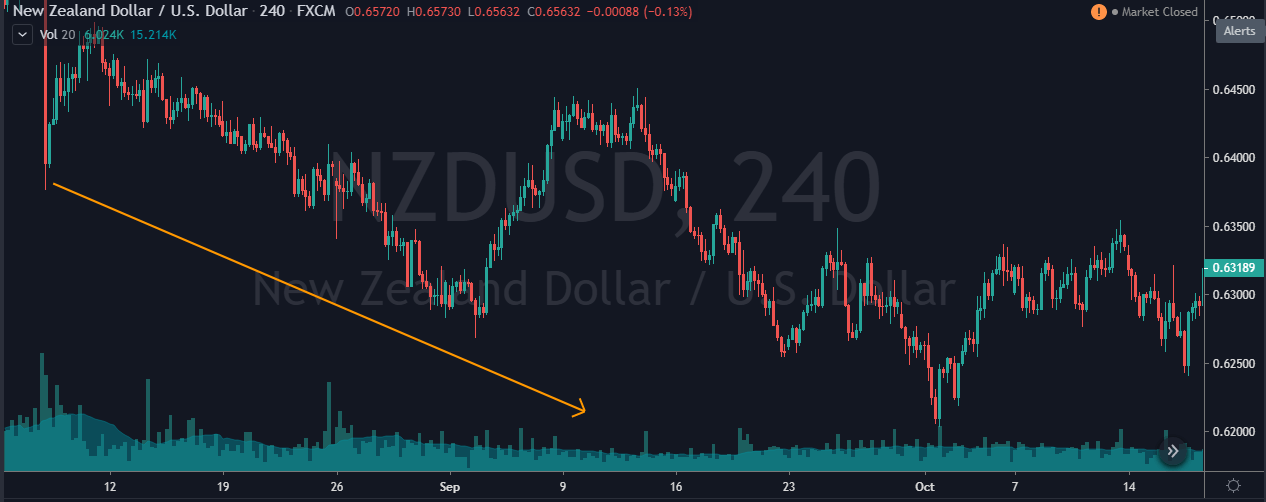
The first step of this trading strategy is to confirm the trend of any underlying asset. Let’s trade the bullish engulfing pattern. So as discussed, we should be finding the downtrend on the price chart. As you can see in the below NZD/USD currency pair was in an overall downtrend.

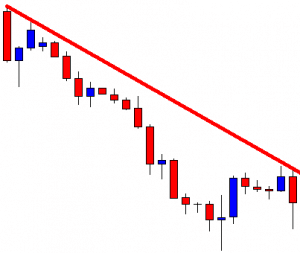
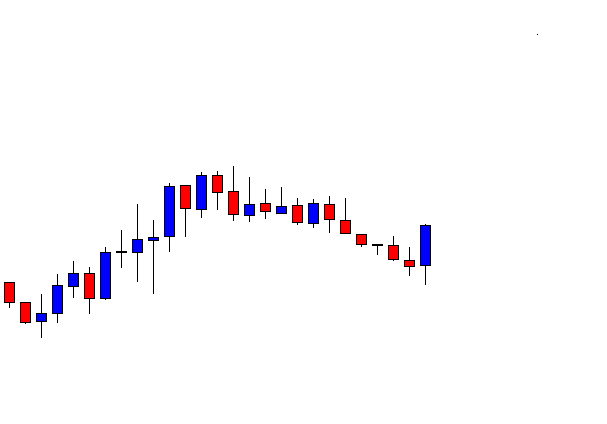
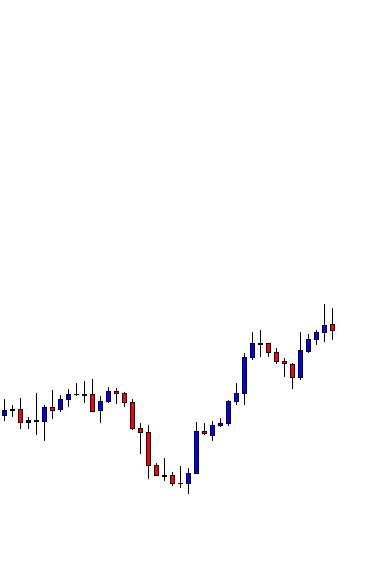
Find out the Bullish Engulfing pattern on your trading timeframe

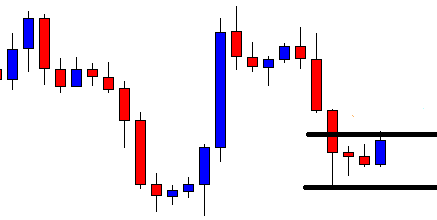
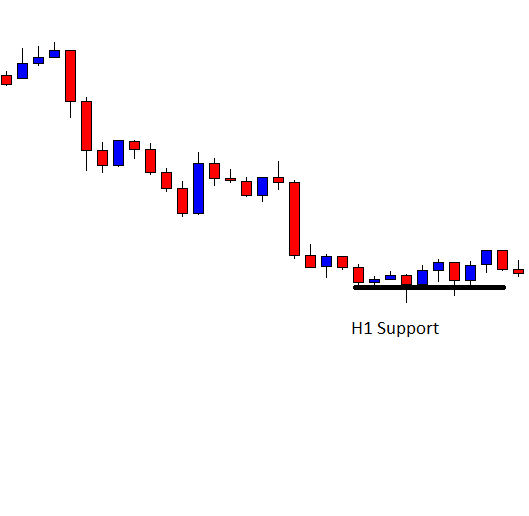
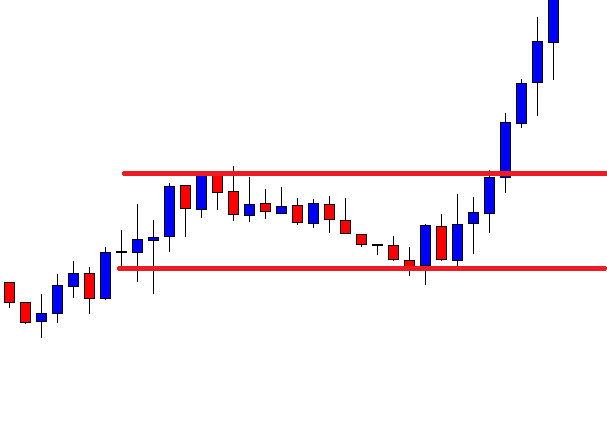
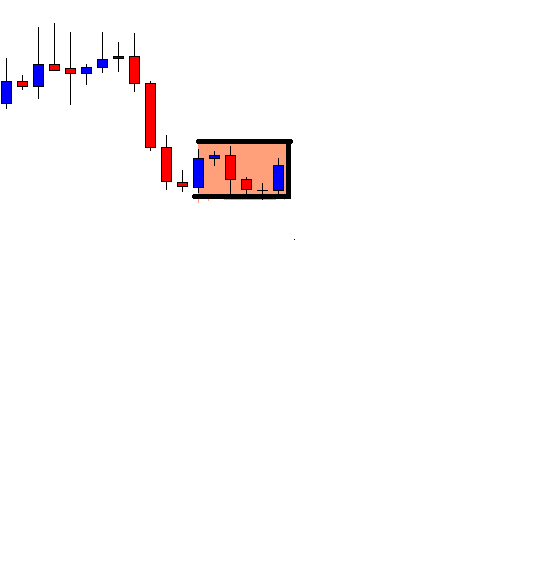
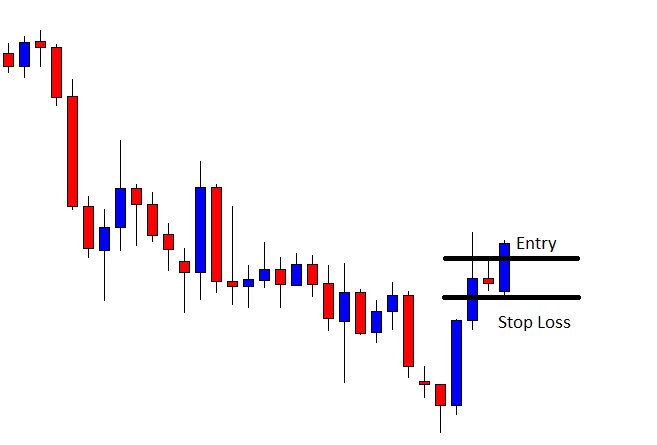
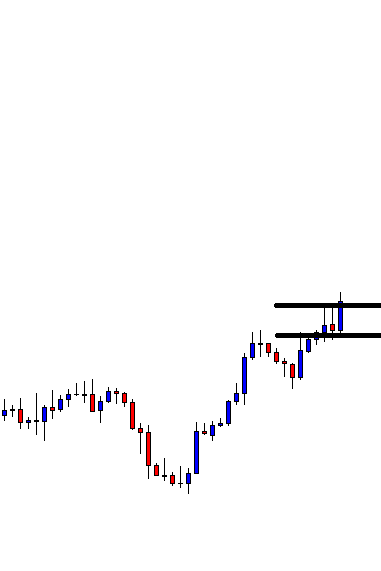
The key to successful trading is to follow all the rules of the trading strategy. The engulfing pattern can be seen all over the price chart, but obviously, we can’t trade all of these patterns. We should be trading only those engulfing patterns that appear in the major support area.

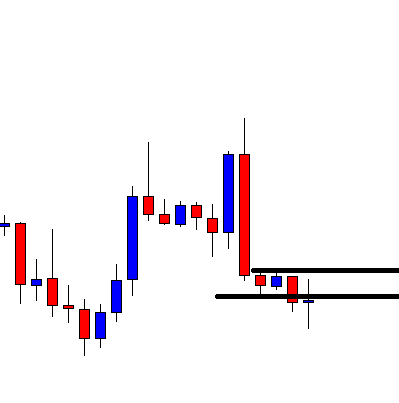
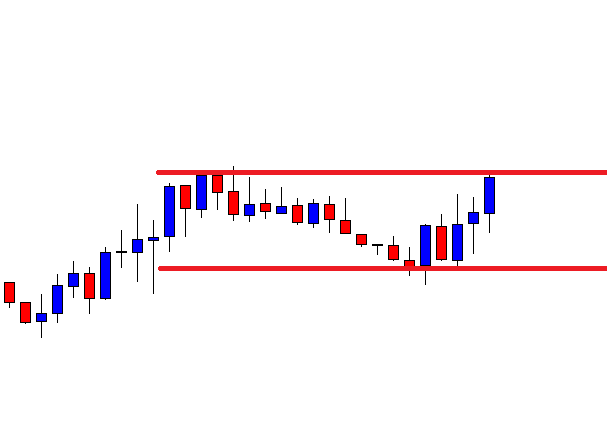
In the below image, the NZD/USD was in an overall downtrend, and price action respects the major support area. Market prints the engulfing pattern at the support zone, which indicates that the buyers are more likely to lead the price.

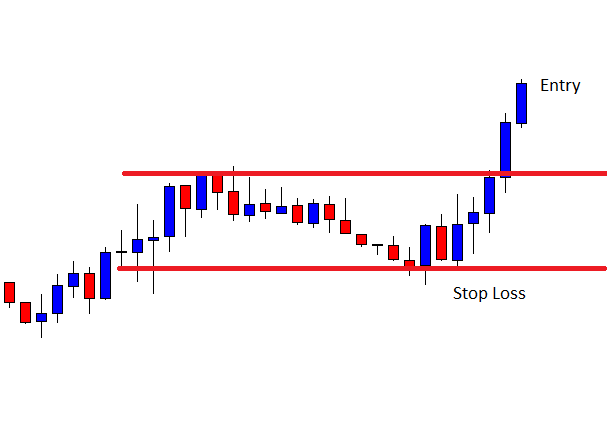
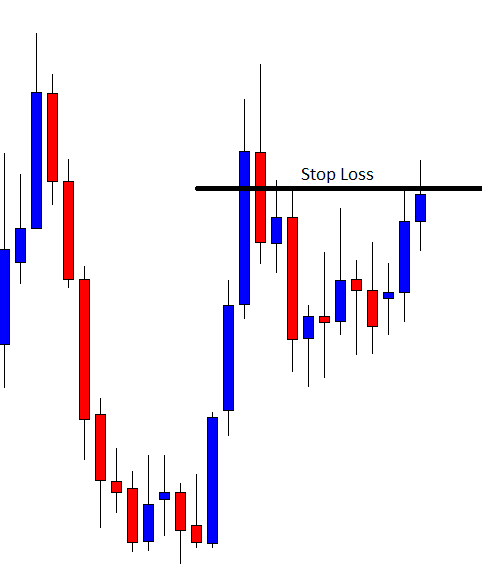
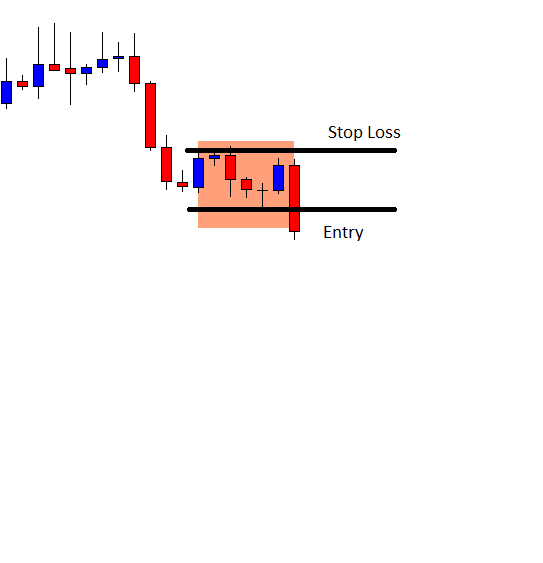
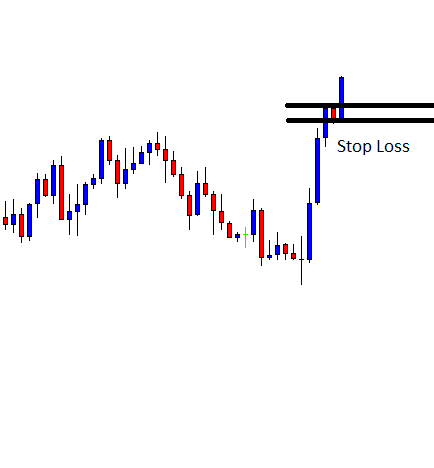
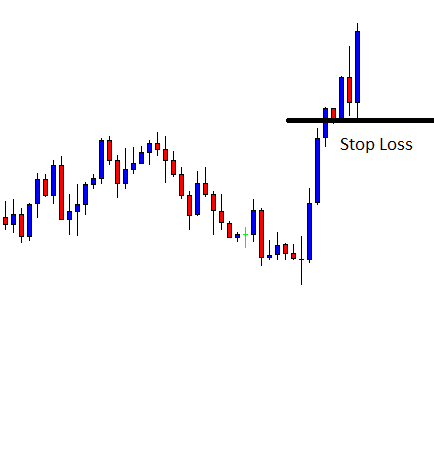
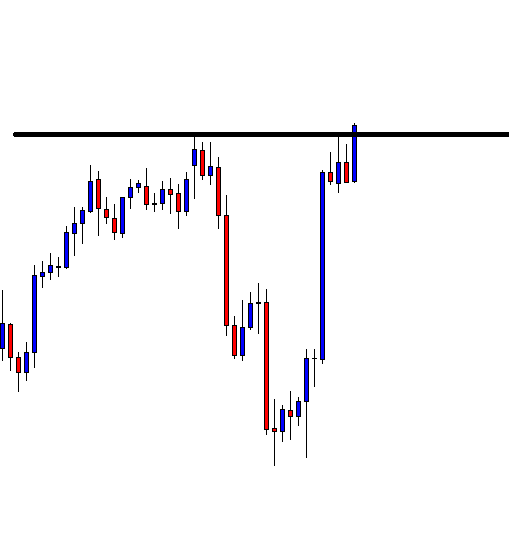
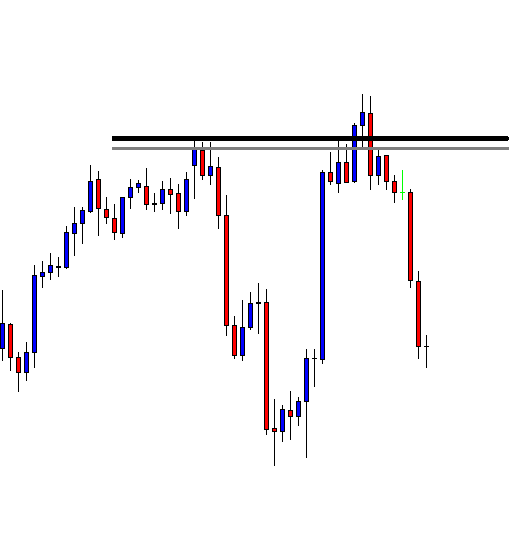
Entry, Take Profit & Stop loss

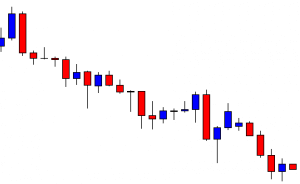
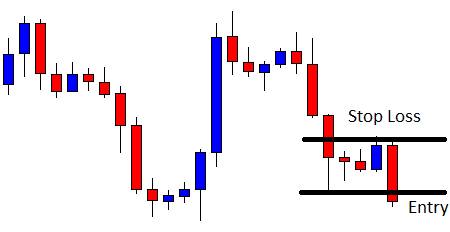
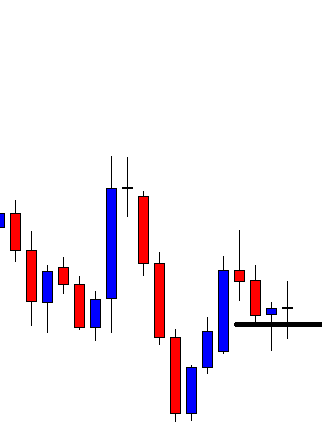
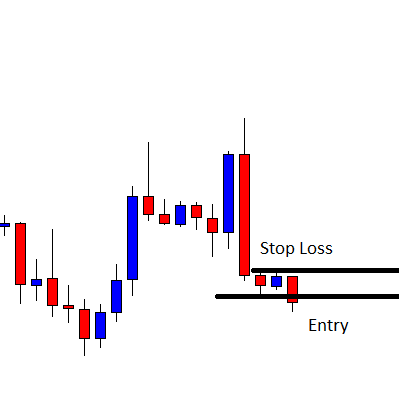
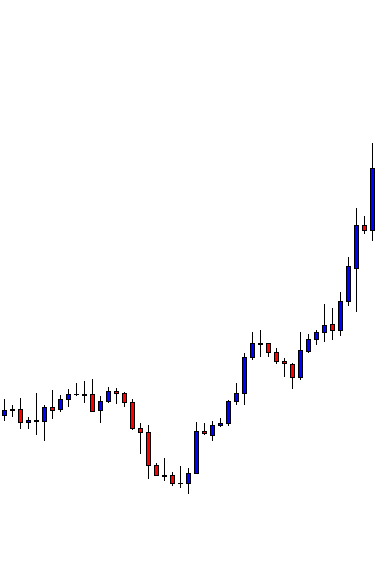
Enter the trade right after you see the bullish engulfing pattern at the S&R area. Take-profit targets depend on your trading style. If you are a swing trader or full-time trader, hold your positions for more extended targets. If you are an intraday trader, close your position at the nearest resistance area.

You can also book partial profits at a significant resistance area and close your full position when the market prints the bearish engulfing pattern. In this strategy, we took the buy at a significant support zone, so it’s a healthy practice to put stop loss just below the support area.

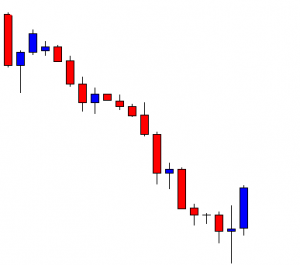
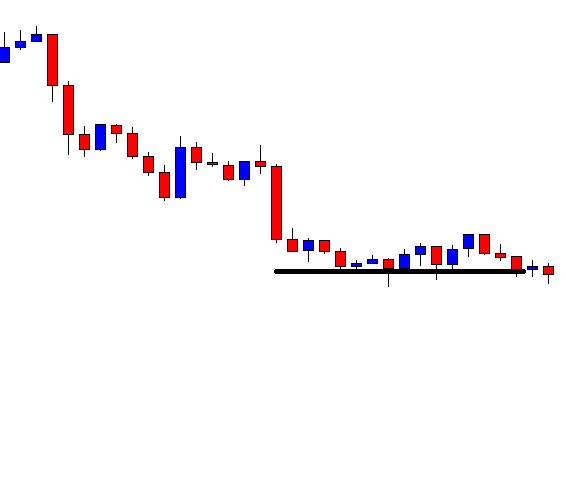
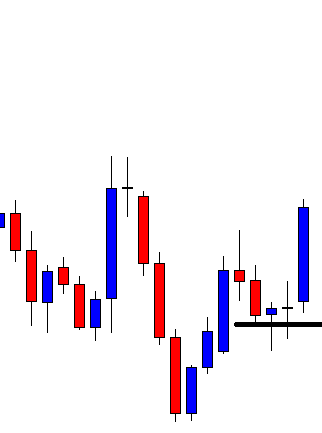
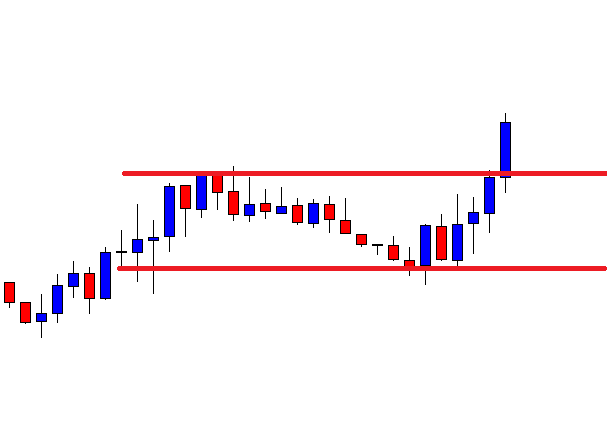
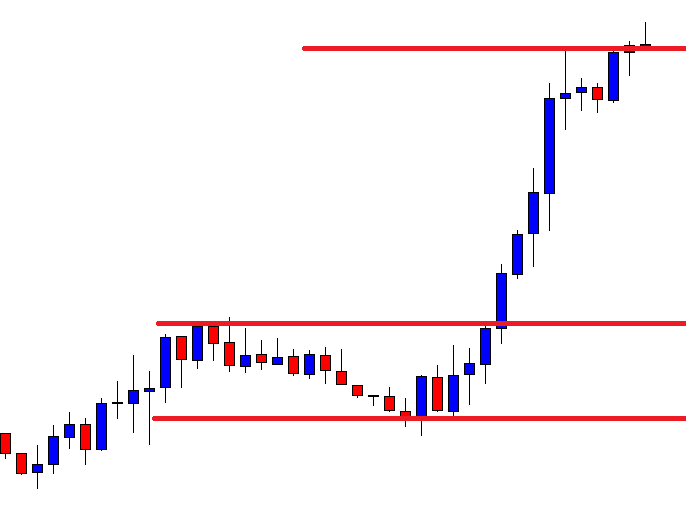
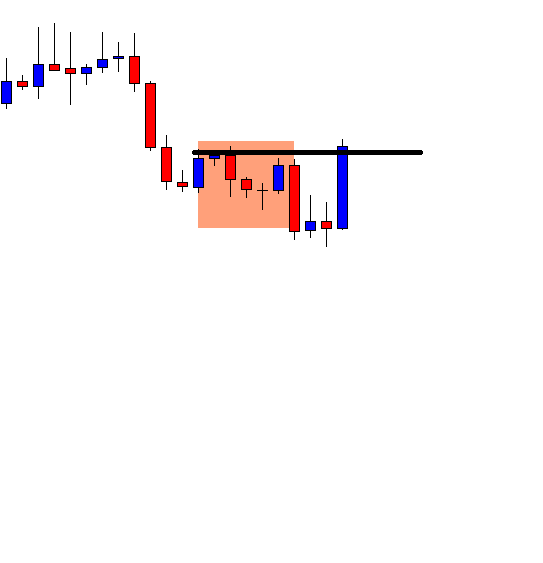
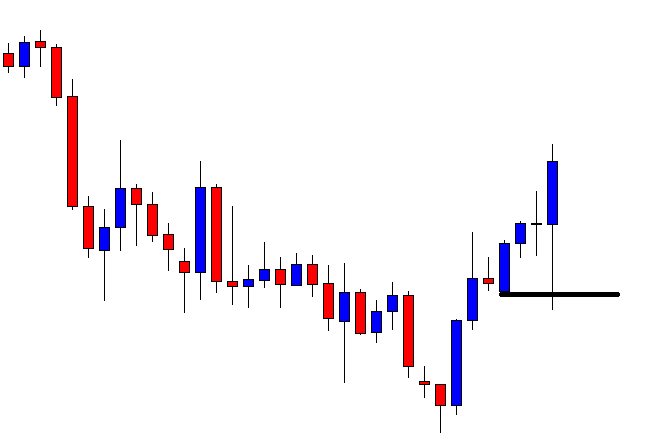
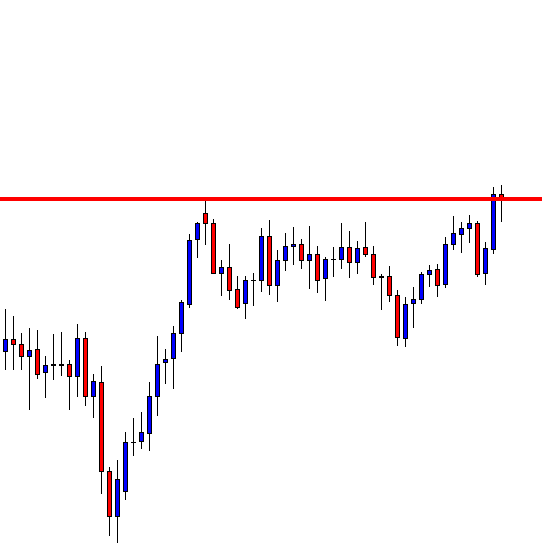
Look at the below image; you can see that price action goes above the significant resistance area. But we made sure to close our positions at the resistance area as we don’t want our money to be blocked in a single trade for a long time. Overall it was good 4R trade.

Bottom Line

There are so many different ways to take trades to use the engulfing pattern. Statistically, the engulfing pattern works better when traded at the bottom or top of the trend. So make sure to check their location before placing the trades. One other possible way to trade am Engulfing Pattern is when it is combined with Moving Averages. But even that way, make sure to trade the engulfing pattern at the significant support and resistance areas. Some traders use reliable indicators like MACD to confirm the trend reversals by using the overbought and oversold levels. That’s about the Engulfing pattern strategy. Make sure to find these patterns and trade them in your upcoming trading activities. Let us know if you have any questions in the comments below. Cheers!

Categories
Forex Daily Topic Forex Price-Action Strategies

An Old Theory about Support/Resistance

Support and Resistance are the two extremely important components in financial trading. Price action traders rely on them as a critical component of their trading strategies.

Ideally, 90% of the indicators are able to reveal support and resistance levels. An ancient theory of support and resistance says that support becomes resistance and vice versa and interesting point is the theory still works nowadays as well as it did in the past. In today’s lesson, we are going to demonstrate an example of this long-used theory.

In the above figure, the price heads towards the North with good bullish momentum. It pauses at a level of resistance, where the price had a rejection earlier. The equation is simple here. If the price produces a bearish momentum and makes a breakout at the last swing low, the sellers are going to look for short opportunities. In case of an upside breakout, it remains buyers’ territory.

A bullish engulfing candle breaches the resistance. If the price confirms the breakout, the buyers keep dominating here. It seems that the sellers do not have any reasons to be optimistic soon.

The breakout level holds the next candle, as well. This move is a confirmed breakout. However, the buyers are to wait for price consolidation, which gives them a level of support to set stop loss and an upside breakout to trigger an entry.

Oh! No, a bearish Marubozu candle comes back in. All of a sudden, things look a bit different here. The buyers and the sellers both have chances. Let us find out what the price does next.

The price confirms the bearish breakout with an Inside Bar. Look at the last candle on the chart – a bearish engulfing candle forms at the resistance zone. The sellers may flip over to the H1 chart to take a short entry since it is an H4 chart.

The price takes some time to get bearish. It may have been consolidating on the H1 chart for several hours. However, it does get bearish in the end — the price heads towards the South with extreme bearish momentum. The last candle comes out as a Doji candle, which may make some sellers think about taking an exit. However, the way it has been heading towards the downside, most likely it may go towards the last swing low.

The Bottom Line

There are so many strategies, indicators, EAs in the market. It would be tough to suggest if you ask me which one works best. Then again, if I am asked to choose just one strategy, my choice would be “Sell at flipped over resistance; buy at flipped support.”