
Breakout Confirmation Means a Lot

Price action traders count the breakout as one of their most essential trading components. There is another factor, which is directly related to a breakout: It is called Breakout Confirmation. A breakout is not considered as a perfect breakout on a particular chart if the breakout level does not hold the next candle. In today’s lesson, we are going to demonstrate an example of that.

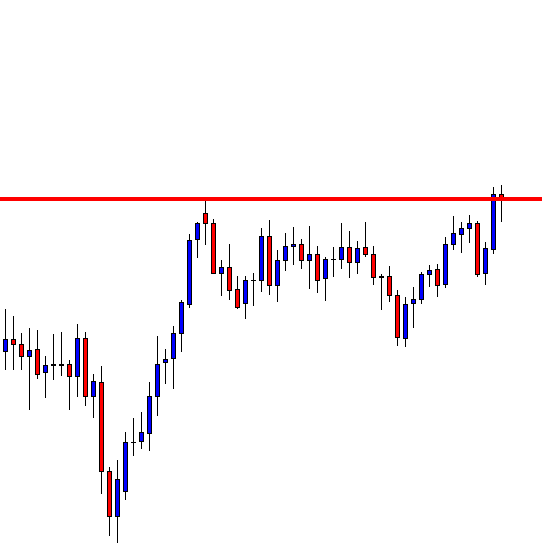
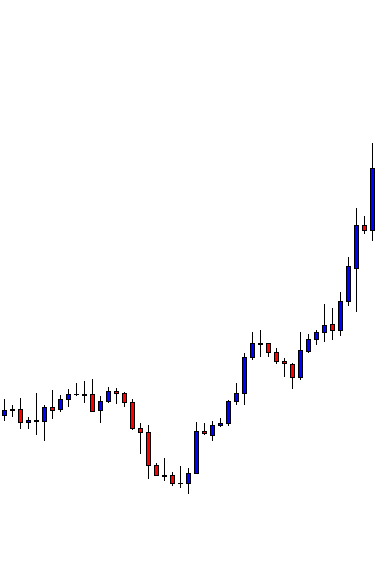
Thie chart above is a daily chart. The chart shows that the price breaches the level of resistance. The candle closes above the level as well. Many traders consider it as a breakout. It is not a breakout yet on the daily chart. The price may have made a breakout on other minor charts such as the H4, H1, 15M, etc. However, to consider it as a daily breakout, traders must wait for the next daily candle to close above or within the breakout level. Let us have a look at the following daily chart.
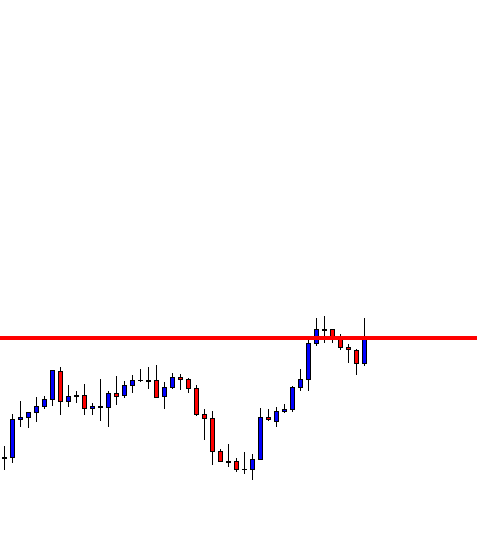
The next daily candle comes out as a bullish pin bar and closes within the breakout level. It means that the breakout level holds the price and confirms the breakout. The price may head towards the North because of the breakout and breakout confirmation. The daily-H4 chart traders may flip over to the H4 chart for the price to consolidate and upside breakout.
The H4 chart shows that the price produces a bullish engulfing candle having a long upper shadow. However, the candle closes within the last swing high. The buyers shall wait for the price to consolidate and upside breakout.
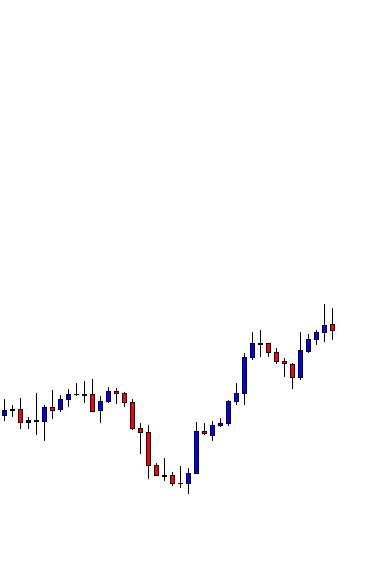
The price keeps heading towards the North with an average bullish momentum. The last candle comes out like a spinning top, which is a sign of price consolidation. Let us proceed to the next chart to find out whether it consolidates more or makes an upside breakout.
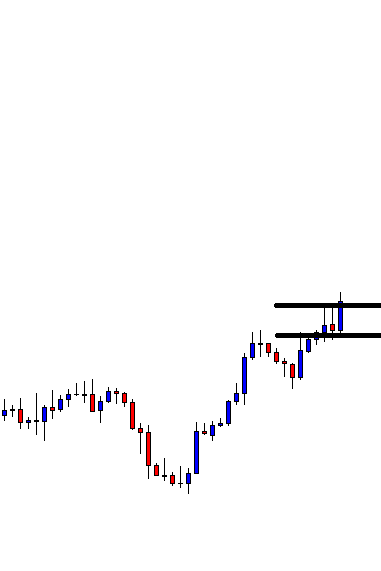
It produces a bullish engulfing candle closing above the last swing high. The buyers may trigger a long entry right after the candle closes by setting stop loss below the consolidation support. Let us find out how the entry goes.
It goes well. It goes towards the North further even after producing a little bearish candle. Ideally, some buyers may come out with their whole trade there, and some traders may take partial profit. This is another issue. We shall concentrate on the breakout and the breakout confirmation. Since the daily pin bar candle’s body closes within the breakout level, it suggests that the trend is still with the bull. If it closes below the breakout level, things would have been different. Such things matter a lot in the Forex market and traders must consider those.