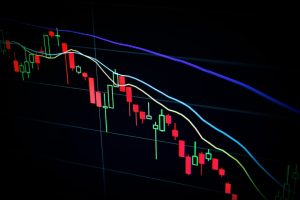
A shadow in forex refers to the wick or tail on a candlestick chart that shows the highest or lowest price reached during a trading period. The shadow is also known as the upper or lower shadow, depending on its position on the candlestick. Understanding the significance of shadows in forex trading is crucial for making informed trading decisions.
A candlestick chart is a popular tool used by forex traders to track price movements in the market. The chart consists of a series of candles that represent a specific time period, such as one hour, one day, or one week. Each candle has a body and one or two shadows, depending on the price movement during the trading period.
The body of a candlestick represents the opening and closing prices of a currency pair. If the closing price is higher than the opening price, the candle is bullish, and its body is usually colored green. If the closing price is lower than the opening price, the candle is bearish, and its body is usually colored red.
The shadows, on the other hand, indicate the price range of a currency pair during the trading period. The upper shadow shows the highest price reached during the period, while the lower shadow shows the lowest price reached. The length of the shadows relative to the body of the candlestick provides valuable information about the strength of the trend and potential price changes.
For example, a long upper shadow on a bullish candlestick indicates that the bulls were able to push the price higher but lost momentum, and the bears took control, pushing the price back down. This could be a sign of a potential reversal in the trend. On the other hand, a long lower shadow on a bearish candlestick indicates that the bears were able to push the price lower but lost momentum, and the bulls took control, pushing the price back up. This could also be a sign of a potential reversal in the trend.
In addition to providing information about potential trend reversals, shadows can also help traders determine entry and exit points for trades. For example, if a trader sees a long upper shadow on a bullish candlestick, they may decide to sell the currency pair, anticipating a potential price reversal. Similarly, if a trader sees a long lower shadow on a bearish candlestick, they may decide to buy the currency pair, anticipating a potential price reversal.
In conclusion, shadows in forex trading are an essential tool for understanding price movements and making informed trading decisions. By analyzing the length and position of shadows on candlestick charts, traders can gain insight into potential trend reversals, as well as entry and exit points for trades. It is important to note that shadows should not be used in isolation but should be considered alongside other technical indicators and fundamental analysis to make well-informed trading decisions.


