
In price action trading, breakout, as well as confirmation candle’s attributes, plays a significant role. In today’s lesson, we are going to demonstrate an example of how the upper/lower shadow of a breakout confirmation candle plays a role in offering us an entry. Let us get started.

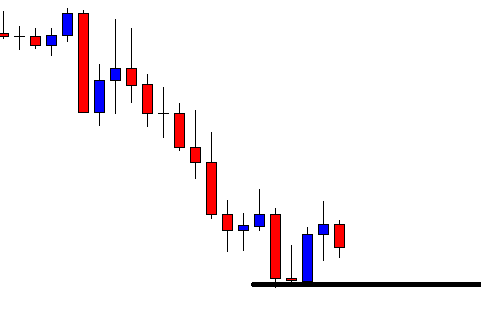
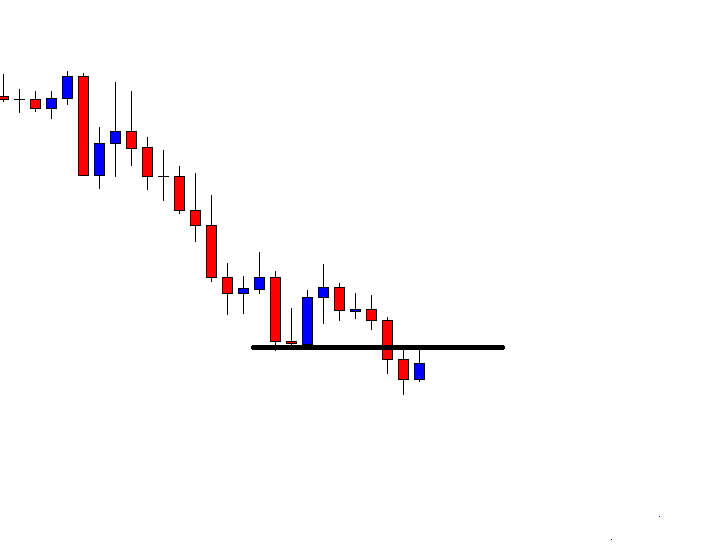
This is an H1 chart. The chart shows that the price makes a strong bearish move. It finds its support. Having a bounce, it goes towards the North. The last candle suggests that the price may have found its resistance too. If it makes a breakout at the level of support, upon getting breakout confirmation, the sellers may go short in the pair.
The price heads towards the South but not with good momentum. It takes only one candle to make a breakout. The sellers must wait. Let us find out what happens next.

Here it comes. The last candle breaches through the level of support. It has a lower shadow, but it closes well below the level. The sellers are to wait for the second important factor, which is breakout confirmation.
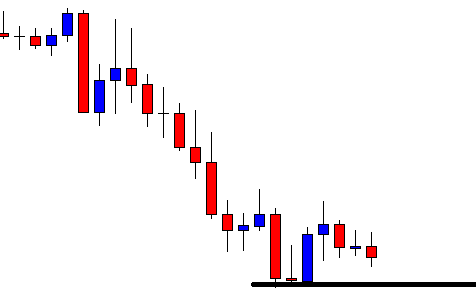
The next candle comes out as a bearish candle closing well below the breakout candle’s lowest low. In naked eyes, the sellers may trigger a short entry right after the last candle closes. However, the confirmation candle has a long lower shadow. To be sure about it, we may flip over to the 15 M chart. Let us have a look at the 15 M chart.
Look at the last 15M candle. This is a bullish pin bar, which is a strong bullish reversal candle. The 15 M traders may push the price towards the North. It means the H1 sellers may have to wait to reach the target. That may even end up being a losing trade. Let us flip over to the H1 again.

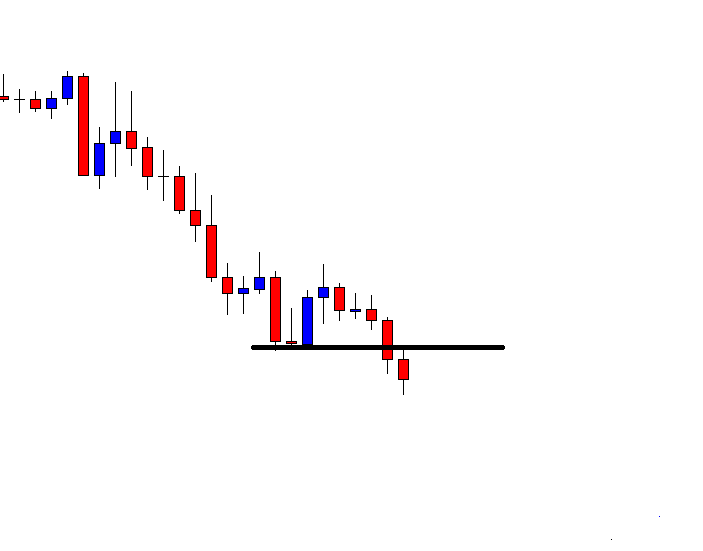
The last candle comes out as a bullish corrective candle. Usually, the price goes down after a breakout confirmation in such a setup. It this case, it does not. It may keep pushing towards the North even further. Let us find out what happens next.
The last candle comes out as a bullish corrective candle. Usually, the price goes down after a breakout confirmation in such a setup. It this case, it does not. It may keep pushing towards the North even further. Let us find out what happens next.
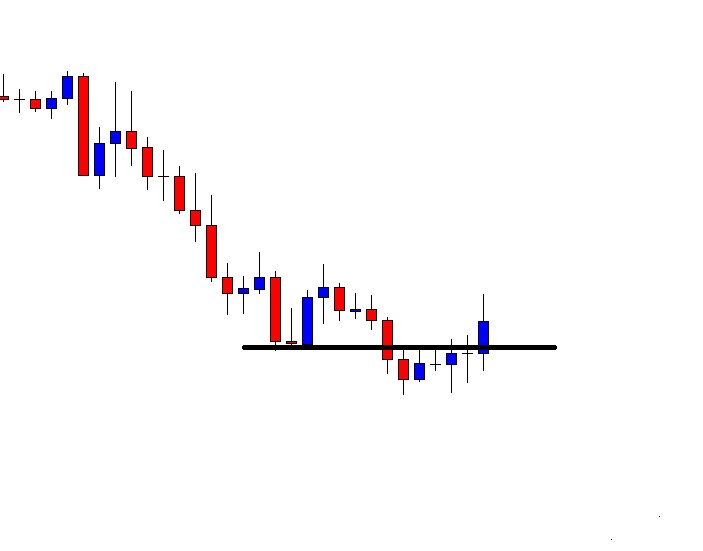
Yes, the price heads towards the North further. The last candle breaches through the breakout level as well. This does not look good for the H1 sellers. It all starts with a long lower shadow (in a selling market).
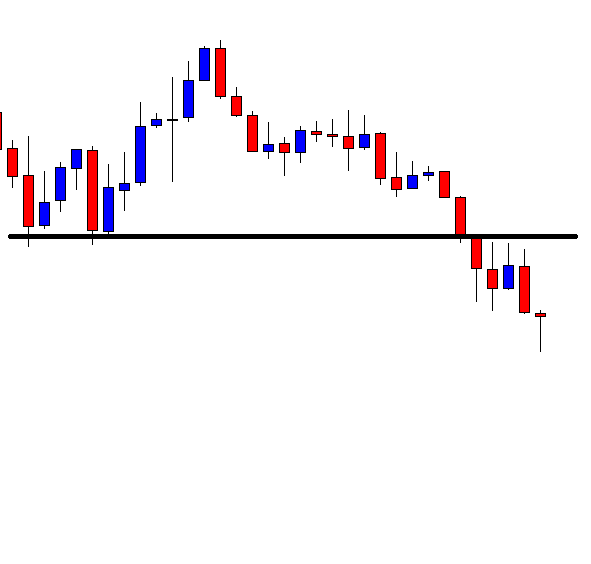
Whenever we see a long lower/upper shadow in an H1 chart, we may check it with the 15 M chart. If the last 15 M candle is a strong reversal candle (for opposite trend), we may skip taking the entry.