
In today’s lesson, we are going to demonstrate an H1 breakout trade setup. Usually, the breakout candle makes a breakout by breaching through a level of support/resistance. Today, we are going to study about a breakout that takes place right at the level of resistance, which becomes support after the breakout. We need to be familiar with such a breakout since it happens quite a lot.

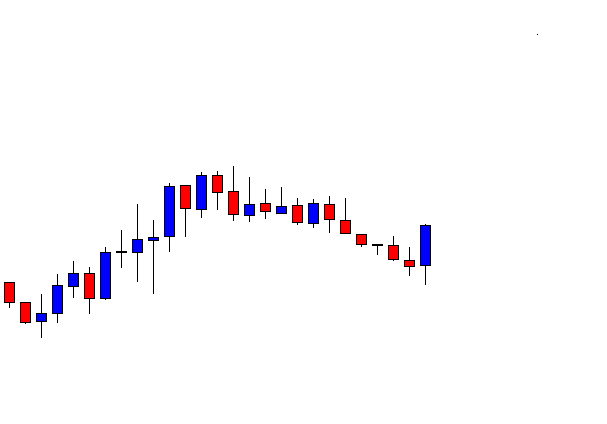
The price produces a bullish engulfing candle. The buyers wait for such a good-looking bullish reversal candle. They shall wait for the price to go towards the level of resistance and makes a breakout later. Let us proceed to the next chart.
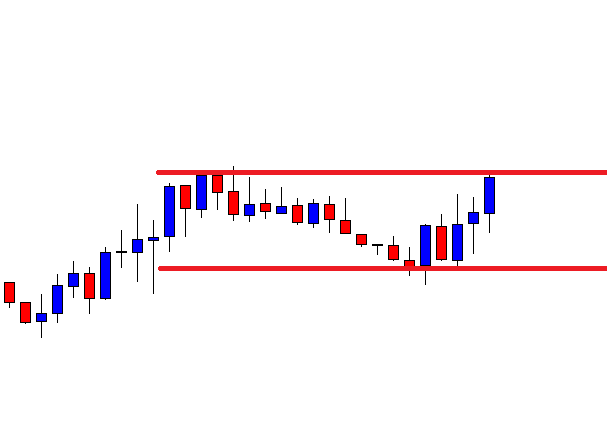
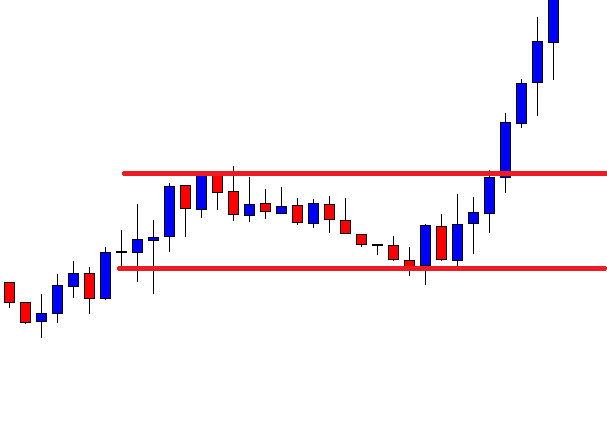
The price heads towards the North but not right after the reversal candle. However, the bullish momentum looks good. Look at the last candle. It closes right at the level of resistance. It seems the price may make a breakout here soon.
The next candle closes well above the level of resistance. However, the candle is formed right at the level of resistance. Typically, a bullish breakout candle’s 25% of its lower body shall remain below the level of resistance. In this case, candle’s 100% (almost, ignore that very tiny lower body) body is above the level of flipped support. Such a breakout takes place in the Forex market very frequently.
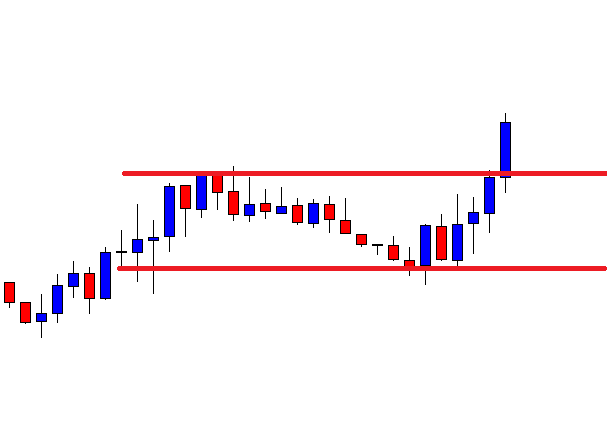
The next candle closes well above the breakout candle. This means the breakout is confirmed. The buyers may trigger a long entry right after the last candle closes.
After triggering the entry, the price heads towards the upside with good bullish momentum. The chart produces two consecutive bullish candles after breakout confirmation. The buyers shall wait for the price to hit the target. For that, the price still has some space to travel towards the North.
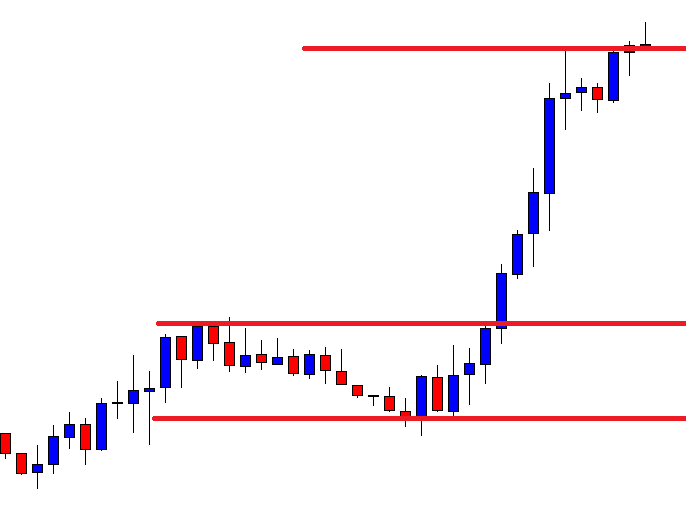
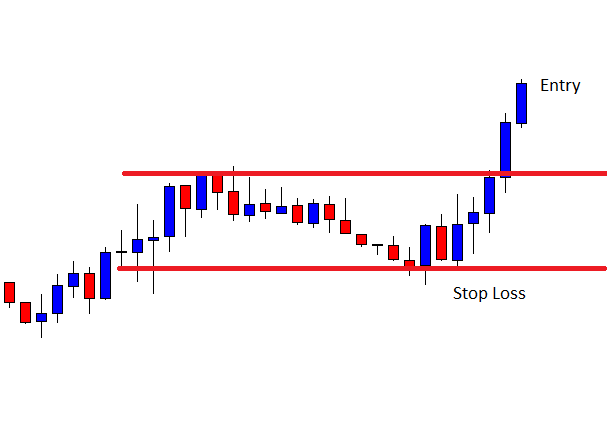
The price hits the target and comes back down a little. It goes towards the level again. In this trade setup, the breakout candle’s breakout is not a good one that price action traders look for. In many cases, we may see that the chart does not confirm a breakout but goes another way around. It happens because such a breakout consumes some extra space. Thus, the majority of such breakouts are not confirmed and may not end up offering entry. However, once the breakout is confirmed, and there is enough space for the price to travel, most likely trade setup would work in traders’ favor. In the beginning, we may get puzzled with such a breakout. The fact is if the next candle after a breakout closes above (bullish market) the breakout candle, it is a valid breakout and works as well as the typical breakout candle does.