
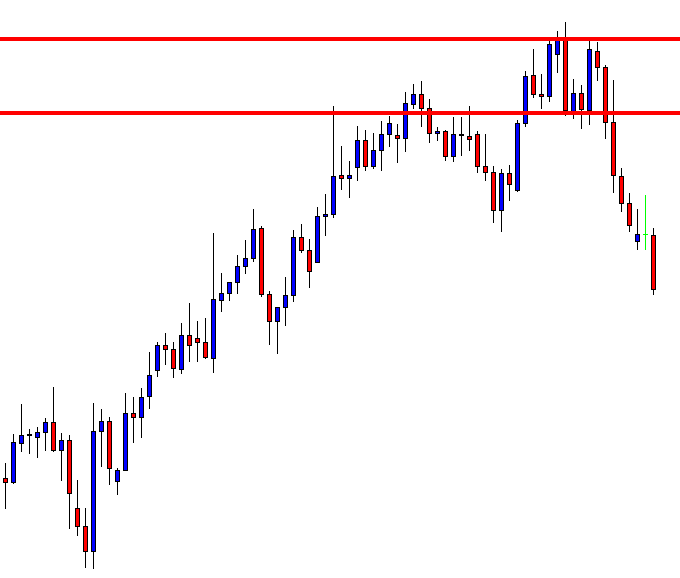
Support and Resistance, also known as Supply and Demand, have long been used in the financial markets. The most characteristic feature of support/resistance is a level of support becomes resistance, and a level of resistance becomes support. The price after making a breakout comes back to the level and makes a move towards the established trend. The price does not always confirm all the breakout levels, though. Traders do not know which broken level is going to produce a trading signal. In reality, they do not even have to know or guess. They have to make decisions according to the price movement or Price Action. Let us have a demonstration of this.
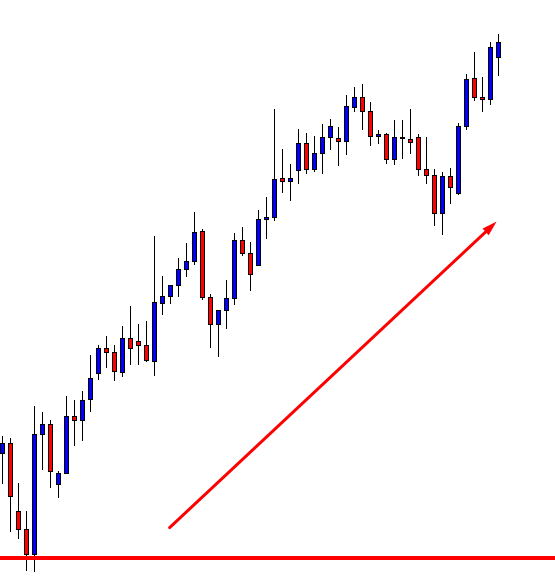
The price is up trending. Traders shall look for long opportunities. To be honest, the last candle on the chart is a buy signal. It was a week ending candle, which must have held the buyers back. Let us wait for a while to get more clues.
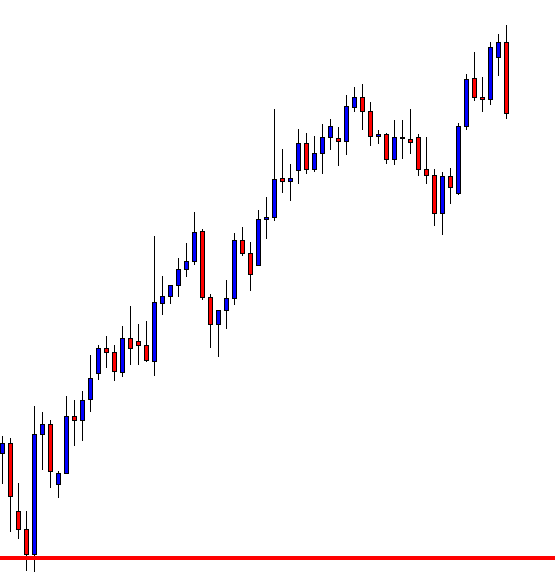
The last candle came out as a bearish engulfing candle. Such price action usually makes a pair choppy. The buyers may want to wait for an upside breakout to go long. However, a bearish engulfing candle may not let that happen.
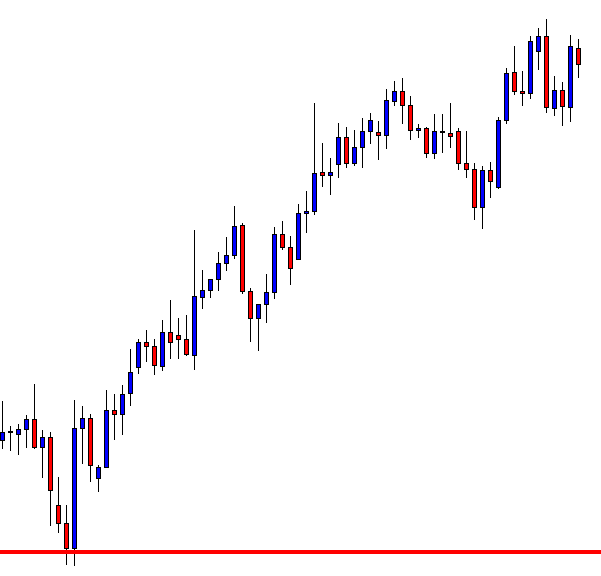
A strong bullish candle closes within the resistance. It seems that the chart may produce a Double Top. Thus, the bear may come and dominate. Let us draw the Neck Line and resistance of the Double Top.
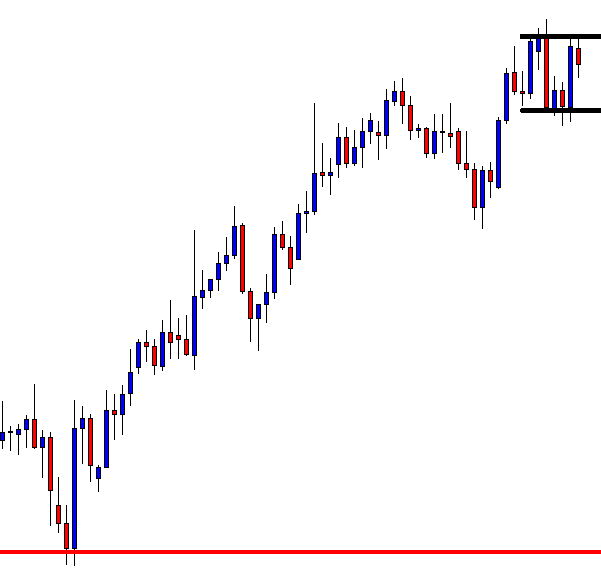
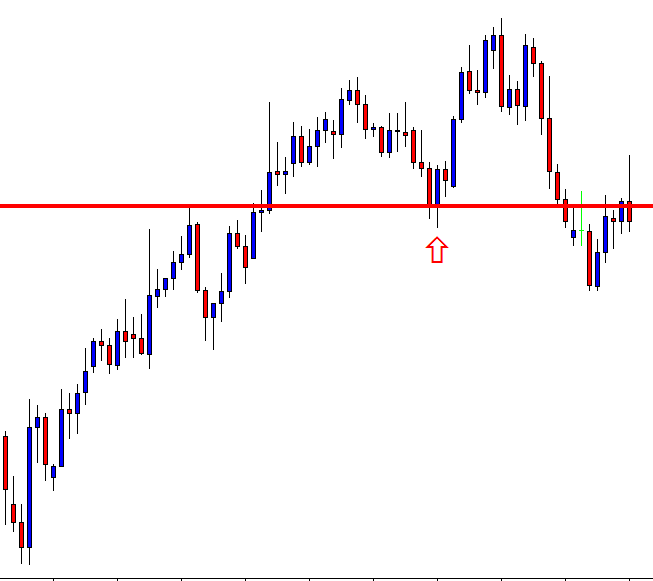
The equation is very simple here. A breakout at the neckline attracts the sellers, which is more likely. On the other hand, an upside breakout attracts buyers. Let us find out which way the price heads to.
The price makes a breakout at the Neckline. However, it does not consolidate around the Neckline after the breakout. Unfortunately, the sellers do not get an opportunity to go short here. It often happens with the traders. Traders’ life is never easy!
Here is a question. Do you see anything interesting? Has the price made another breakout?
It has made a breakout at the red-marked level. It goes back to the level to confirm the breakout, as well. Moreover, it has produced a bearish engulfing candle with a long upper shadow. Things look good for the sellers. A breakout at the lowest low would be the signal to go short.

Here comes the breakout. A bearish Marubozu candle breached the lowest low. The sellers may want to trigger a short entry right after the last candle closes. Let us find out how far down it goes before producing any bullish reversal candle.
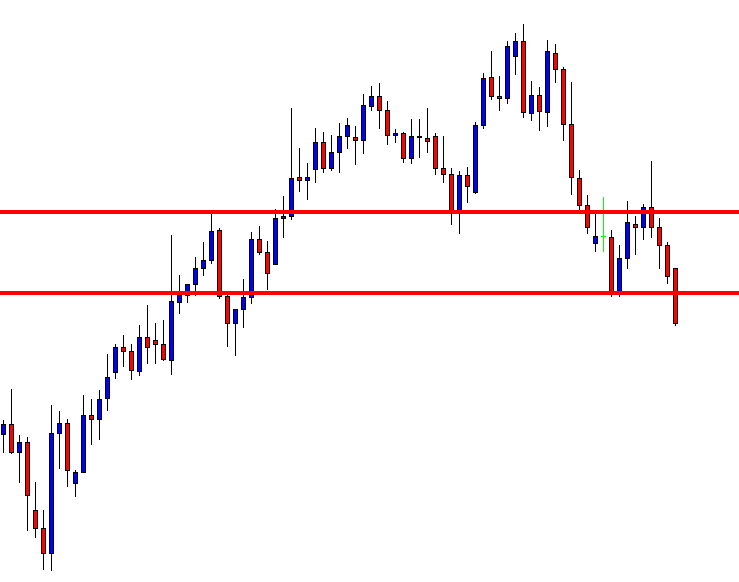
Here comes the breakout. A bearish Marubozu candle breached the lowest low. The sellers may want to trigger a short entry right after the last candle closes. Let us find out how far down it goes before producing any bullish reversal candle.
The price heads toward the downside with good bearish momentum. It produces a Doji Candle. It may be time to come out with a profit.
The Bottom Line
The price does not confirm all the breakouts. That does not mean we should start pulling our hair. Concentrate hard and calculate well. The next opportunity is just around the corner.