Support and Resistance are the two key factors of Forex trading. The good thing is in most cases time these levels can be guessed well earlier. By drawing support/resistance levels where the price reacts earlier, we can spot those levels. This helps a trader set his stop loss, take profit and make a trading decision. In today’s lesson, we are going to demonstrate an example of how the previous levels where the price reacts earlier play a significant part as far as support/resistance is concerned.

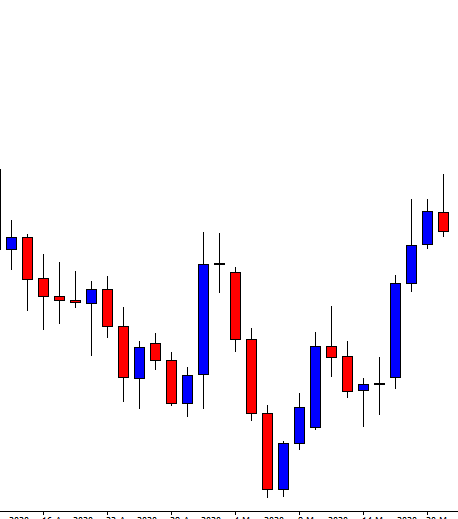
Look at the chart carefully. The price makes a strong bearish move and makes an upside correction. The chart produces a spinning top followed by a bearish engulfing candle. If we consider the existent trend and candlestick pattern, it is a short signal. The question is whether it really is a short signal or not. Look at the next chart.
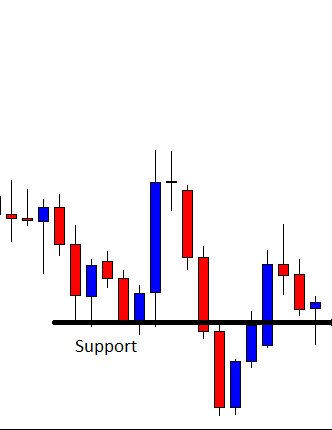
At the correction, one of the candles breaches through a level. This level was a level of support earlier. After being bearish, the level should work as a level of resistance. It does not. The price breaches through the level. In fact, it may work as a level of support again. If it produces a bullish reversal candle, the buyers are going to take control here.
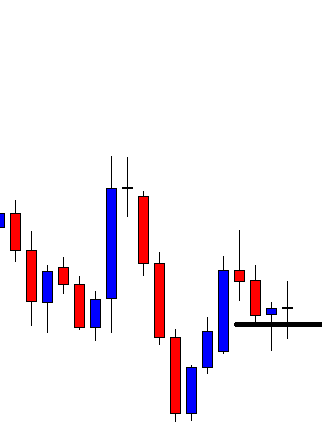
The level seems to hold the price as a level of support. It produces two a bullish pin bar and a doji candle. If it produces a bullish engulfing candle here, the price may get bullish and head towards the North.
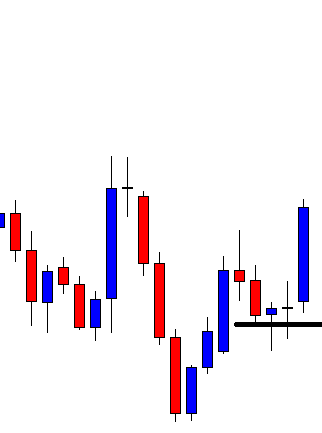
The chart produces a bullish engulfing candle closing well above the wave’s highest high. Let us calculate whether the buyers should go long here or not. The price makes a bullish move breaching a significant level. The price makes a bearish correction and the breakout level works as a level of support. As far as price action trading is concerned, traders may trigger a long entry right after the last candle closes.
As expected, the price heads towards the North with good bullish momentum. It gets the buyers 1R already. The last candle comes out as a bearish inside bar. The price may reverse now. However, there is still a 40% possibility that the price continues its bullish move. Let us assume that the buyers close the trade and cash in some profit.
If we consider the whole scenario, the market seems bearish in naked eyes. When we draw the significant level, it gives us a clearer picture of the breakout and correction. We, then realize that the market is actually bullish. A long entry at the pullback gets the buyers some green pips. This is what Support and Resistance (significant levels) do.