Categories
Forex Daily Topic Forex Price Action

Trendline Trading: How a Trend upon a Trendline Run Longer

In today’s lesson, we are going to demonstrate an example of a chart that made a long bearish move obeying a bearish trendline. The price after forming a bearish trendline does not offer entry to the sellers. It makes a breakout at the first trendline and then produces another bearish trendline ending up offering short entries. Let us now have a look at the chart and find out how it happens.
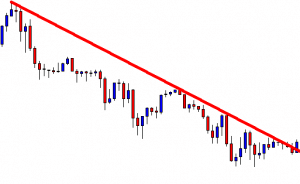
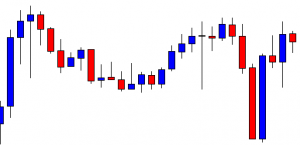
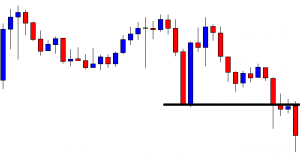
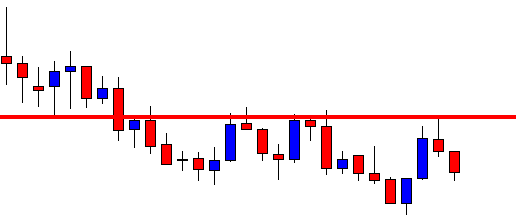
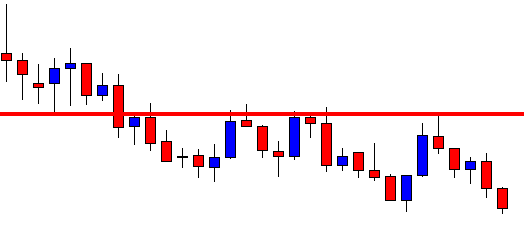
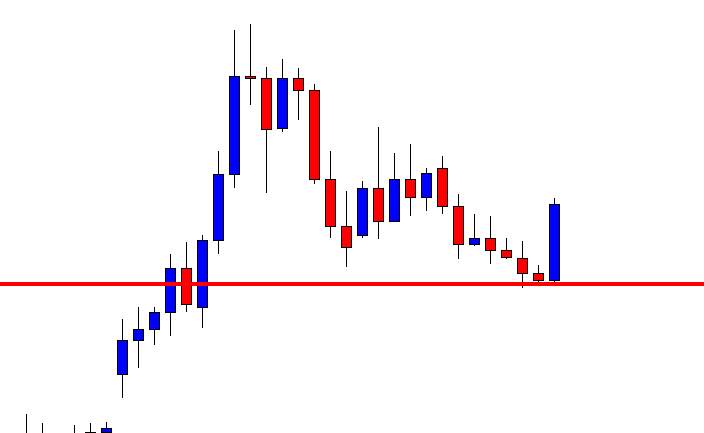
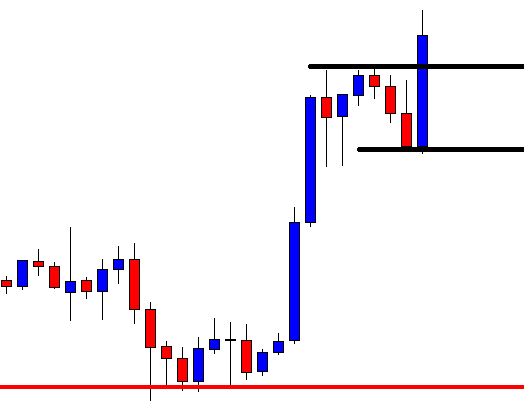
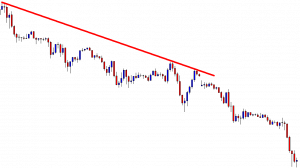
The chart shows that it makes two swing lows trending from two swing highs. By joining those points, we can draw a trendline shown in the above chart. The sellers may wait for the price to go back at the trendline’s resistance and produce a bearish reversal candle to go short in the pair. However, the price action has been choppy around the trendline’s resistance. The last candle comes out as a bullish engulfing candle. It does not look good for the sellers.
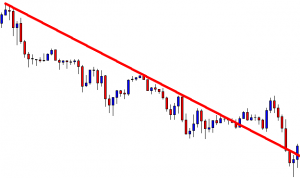
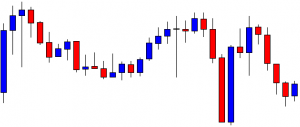
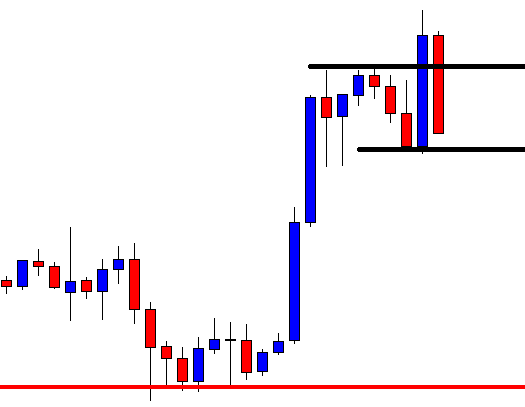
The price makes a breakout at the trendline’s resistance. It heads towards the North and then makes a strong bearish move. Such price action may puzzle traders. Do you notice something interesting here? Have a look at the next chart.
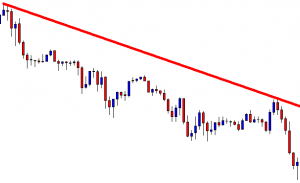
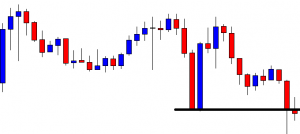
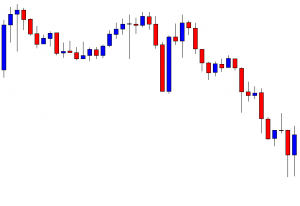
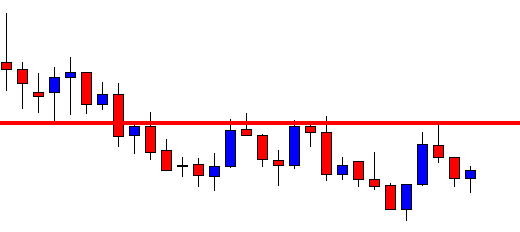
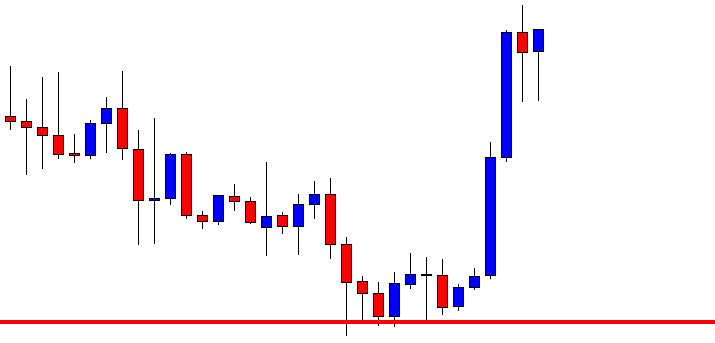
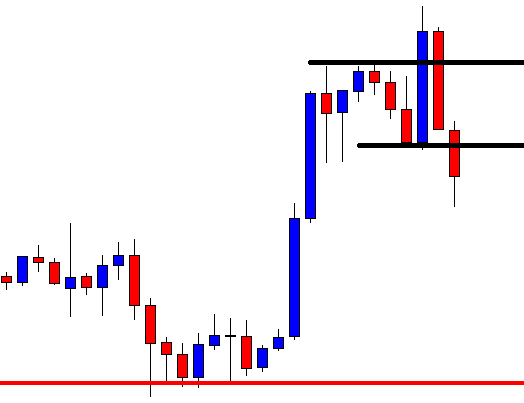
The sellers may draw another bearish trendline by joining two swing lows. As long as the price makes new lower lows, we can draw a bearish trend line by joining two higher highs. We know what sellers are to do here. Yes, they are to wait for the price to go back to the trendline’s resistance and produce a bearish reversal candle to go short in the pair.
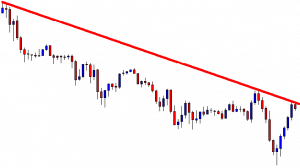
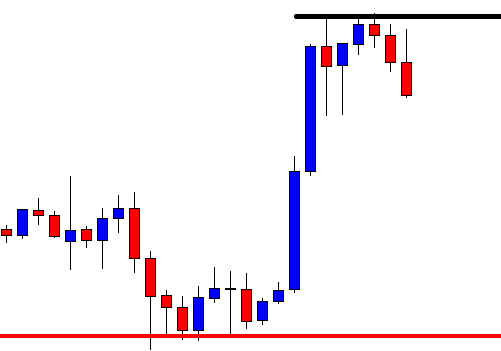
The chart produces a bearish inside bar. It is not a strong reversal candle. However, it is produced at a trendline’s resistance. The sellers may keep their eyes in the pair to go short according to their trading strategies. The price may find its next support at the last swing low. The chart shows that the price has enough space to travel towards the South.
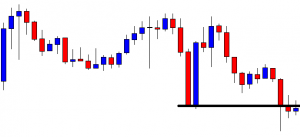
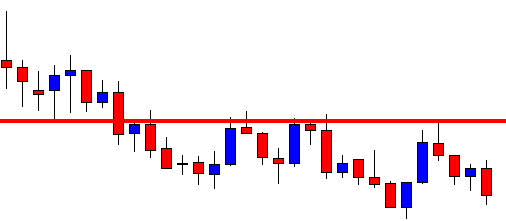
The price heads towards the South at a moderate pace. It makes a long bearish wave, though, by making a breakout at the horizontal support. In the end, it comes out as an excellent trade for the sellers.

If we recap, the first drawn trendline is disobeyed by the price. It is breached, and the chart looks slightly bullish biased. It does not make any more bullish breakout but makes a long bearish move by making a breakout at the last swing low. It gives the sellers an opportunity to draw another bearish trendline, and that ends up offering an excellent entry.

Categories
Forex Daily Topic Forex Price Action

Even a Fragile Breakout Makes the Price Move

In today’s lesson, we are going to demonstrate an example of a chart producing a double top and offering entry. The breakout does not look that promising though. However, the price heads towards the breakout direction and makes a long bearish move. Let us get started.

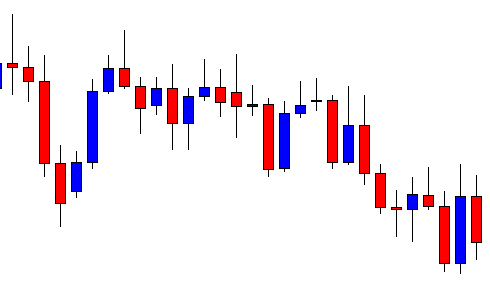
The chart shows that the price has a rejection at a level and makes a bearish move. Upon finding its support, it produces a bullish engulfing candle and heads towards the North. The chart produces a bearish inside bar around the level of double top resistance. It may attract the sellers to keep their eyes on the chart to go short upon a neckline breakout.

The price heads towards the South with good bearish momentum. The last candle comes out as a bullish inside bar. It is a sign that the chart may get choppy instead of making a breakout at the neckline. However, we never know. The sellers may keep patience and wait for a bearish breakout.

The price consolidates for a while and makes a bearish move. The last candle closes below the neckline. It is a kind of breakout that the sellers are waiting for, but it is a breakout. Let us wait and see what the price does here.

The chart produces a spinning top. The candle closes within the breakout level. Thus, it is a valid breakout. The sellers may wait for the chart to produce a bearish engulfing candle closing well below the last swing low. Let us proceed to the next chart.

Look at the last candle. The candle comes out as a bearish engulfing candle closing well below the last swing low. The sellers may trigger a short entry right after the last candle closes by setting stop-loss above the breakout level and take profit with 1R.

The price heads towards the South with excellent bearish momentum. It hits the target of 1R in a hurry too. This means the trade setup has worked for the sellers nicely. Considering the breakout factor, the trade setup is not an A+ trade setup. However, we may consider two important factors here.

  1. Double Top
  2. The signal candle.

These two factors are significant to make the price move. Yes, when an A+ momentum breakout goes with two of them, it gives us more chances to make a profit out of the trade. Today’s example shows that as long as it’s a breakout, upon the breakout confirmation, the price may head towards the trend direction with good momentum if the mentioned two factors meet all the requirements.


Categories
Forex Price Action

Chart Combination Trading: Even an Inside Bar Has a Lot to Offer

An Inside Bar is considered the weakest reversal candle as far as candlestick trading is concerned. However, in today’s article, we find out the significance of a daily Inside Bar in the daily-H4 chart combination trading. Let us get started.

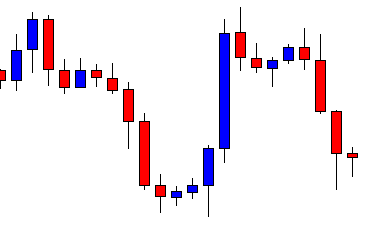
This is the daily chart. The chart shows that the last candle comes out as a bearish Inside Bar. The daily chart traders may still think that the chart is bullish biased. However, the daily-H4 chart combination traders are to flip over to the H4 chart and look for short entries since it is a bearish reversal candle after all.

The H4 chart looks to be tailor-made for the sellers. The chart produces a double top, and the price breaches the neckline. The last candle comes out as a doji candle. The price may consolidate now.

The chart produces another bearish candle closing within the same resistance. Then, it creates a bullish engulfing candle. Let us draw two lines here. The level of support looks very evident. However, the level of resistance still has a lot to prove.

The level of resistance produces a bearish reversal candle. To be precise, it creates a bearish engulfing candle, closing below the level of resistance. The sellers may trigger entry right after the last candle closes by setting stop-loss above the level of resistance and by setting take profit with 1R.

The price heads towards the South in the next candle as well. It seems that the sellers may not have to wait too long to achieve their target. Let us proceed to the following chart to find out how it goes.

As expected, the next candle comes out as another bearish candle. This time it has even a longer body. Look at the last candle. The candle comes out as a bullish inside bar. Technically, the chart is still bearish biased. Do not forget that for the H4-H1 chart combination trading, they may have to flip over to the H1 chart to go long in the pair. This is what we have just demonstrated in the daily-H4 chart combination trading.

To sum up the lesson, an Inside Bar may not be a strong reversal signal in the chart. For the chart combination traders, it is a bit different. As long as it is a reversal candle does not matter how weak it is. The combination traders may flip over to the counterpart and wait for consolidation and a signal candle to trigger entry.

Categories
Forex Price-Action Strategies

Price Action Trading: Dealing with Daily Chart’s Support/Resistance

In today’s price action lesson, we are going to demonstrate an example of a daily chart where the price reacts to support and resistance. We will dig into the chart and find out what message it has to offer us.

The chart shows that the price heads towards the North upon producing a bullish track rail pattern. The next candle comes out as another bullish candle. However, the price finds its resistance. The level has been working as a level of resistance where the price has rejection twice already. Look at the last candle on the chart. It comes out as a bearish inside bar. However, the level is now triple top resistance. Intraday sellers may look to go short in the pair and drive the price towards the South.

As expected, the pair produces another bearish candle. The last swing low offers enough space for the sellers to go short in the pair. Thus, they may still go short in the pair and drive the price towards the South further. The daily sellers are to wait for the price to consolidate and produce a bearish reversal candle to offer them a short entry. Let us see what happens next.
The chart produces a bullish inside bar. The sellers on the daily chart may go short if the next daily candle comes out as a bearish reversal candle. They are to keep this chart on their watch list.

The next candle comes out as a bearish engulfing candle. This means the sellers on the daily chart may go short in the pair and drive the price towards the last swing low as far as price action trading is concerned. If the next daily candle breaches the level of support (last swing low), they may keep holding the position to grab more pips. Let us find out what happens next.

The next candle comes out as a bearish candle closing within the last swing low though. The sellers make some green pips. It might be time for them to close the trade since the candle closes within the level of support. If the candle closes below the level of support, it would surely be a different ball game for the sellers.

Intraday traders obey Support/Resistance on the daily chart a lot. Thus, daily support/resistance plays a significant role in the Forex market to make a reversal/correction/consolidation. Thus, if we take entry even based on the daily chart, we must count those to manage our entries.

Categories
Forex Price-Action Strategies

Forex Price Action: Do Not Be Over Confident

Engulfing candle is the strongest reversal candle. In a bearish market, the buyers wait for a bullish engulfing candle and flip over to the minor chart to take entry. It does not usually go wrong. However, from time to time, things may not go according to traders’ expectations, even with engulfing candle. In today’s lesson, we are going to demonstrate an example of that. Let us proceed.
This is a daily chart. The chart shows that the price makes a bearish move and finds its support. It produces a bullish engulfing candle. Thus, the H4 breakout traders may flip over to the H4 chart and wait for the price to consolidate and to create a bullish engulfing candle to go long in the pair. Let us flip over to the H4 chart.

The H4 chart also looks very bullish. The price starts having consolidation. Then, it produces a hammer. It seems the chart may not take too long to produce a bullish engulfing candle breaching consolidation resistance.

The chart produces another bullish candle closing within consolidation resistance. The price heads towards the South to search for its support. It has been taking longer than the buyers’ expectations. They must not be impatient but keep their eyes on the chart.

The price finds its support and produces a bullish engulfing candle. The candle closes well above consolidation resistance. The buyers may trigger a long entry right after the last candle closes by setting stop loss below the level of support and by setting take profit with 1R. The signal candle suggests that the buyers find a good deal here. Let us proceed to the next chart to find out what the price does.

I do not think that the buyers are ready for this. The last candle comes out as a bearish inside bar, but it closes within consolidation resistance and support. It does not hit stop loss yet. The buyers still have a chance to win this. This looks ominous for them, though.

The price hits stop loss now. The last candle comes out as a bearish candle closing below consolidation support this time. All of a sudden, it becomes the sellers’ territory. The H4 buyers must avoid this chart for a while.

The lesson we get from today’s example is a chart, which looks only for the buyers’ turns into opposite within two candles. Things get changed anytime in the Forex market. Thus, traders should not be overconfident with their analysis, strategy at any point in their trading life.

Categories
Forex Daily Topic Forex Price-Action Strategies

Manage Your Trade Differently on Different Charts

In today’s lesson, we are going to demonstrate an example of an H1 breakout strategy. Before hitting the target, at some point, the price gets sluggish. Nevertheless, it hits the target in the end. Let us now proceed to find out the lesson it has to offer us.

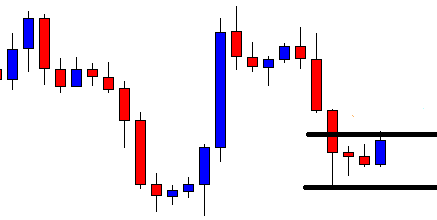
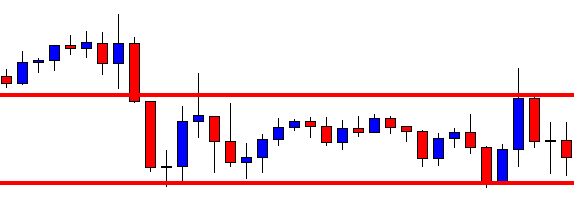
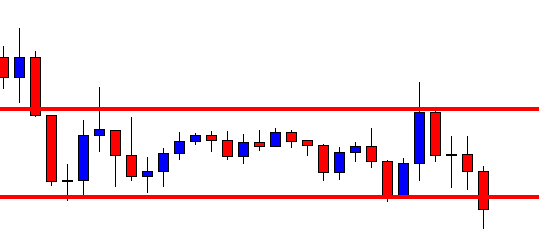
This is an H1 chart. The price gets choppy within these two horizontal lines. It has a rejection and makes a bearish move upon producing a bearish inside bar. The chart is yet to make a breakout. Until it makes a breakout, it does not have anything to offer to the buyers or the sellers. However, as it stands, the buyers may have an upper hand here. Let us proceed to the next chart.

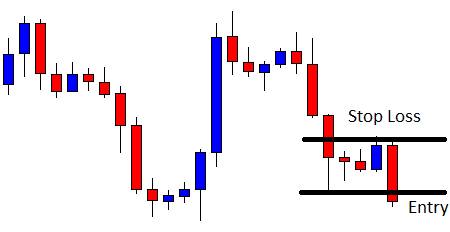
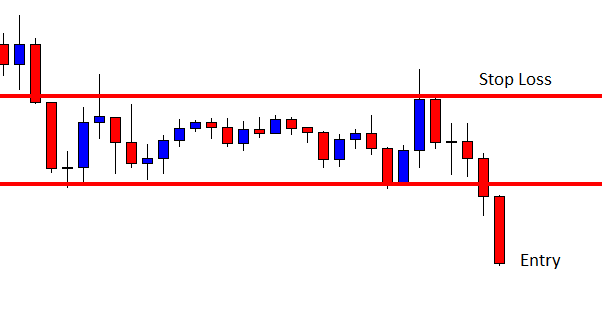
Here it comes. After a long while, a candle breaches through the level of support closing well below it. The candle has a long lower shadow, but the breakout is explicit. The sellers are to wait for the next candle to close its lowest low to trigger a short entry.
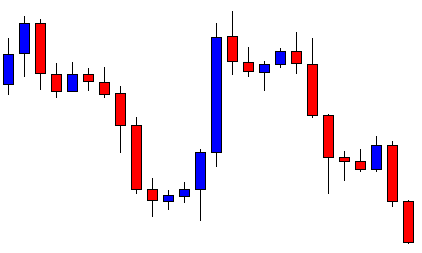
The next candle comes out as a strong bearish candle. This is one perfect looking bearish candle to attract the sellers to trigger an entry. The sellers may trigger a short entry right after the candle closes, setting stop-loss above the level where the trend starts with 1R.
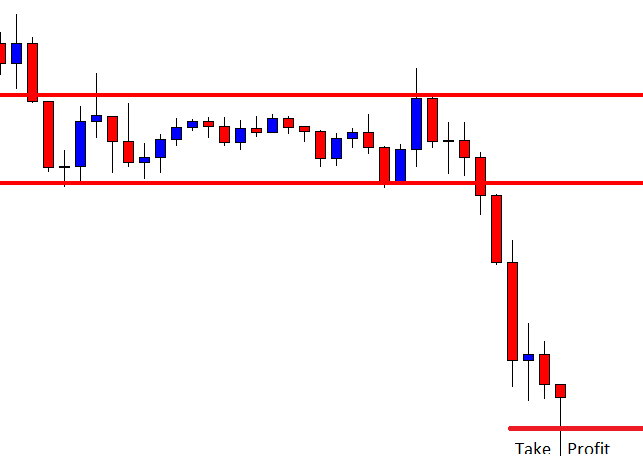
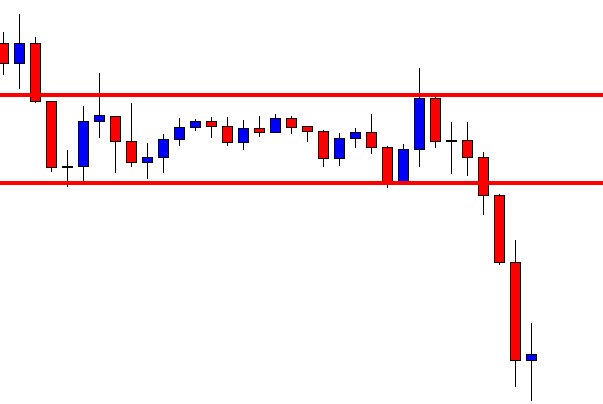
As expected, the price heads towards the South with good bearish momentum. However, look at the last candle. It comes out as a spinning top. In a strong bearish trend, it is not considered as a strong bullish reversal candle. Moreover, it is an H1 chart, and the entry is triggered based on the H1 breakout strategy. Thus, the sellers must hold their position and wait. To be precise, they should not even look at this chart anymore by following the rule of ‘Set and Forget.’

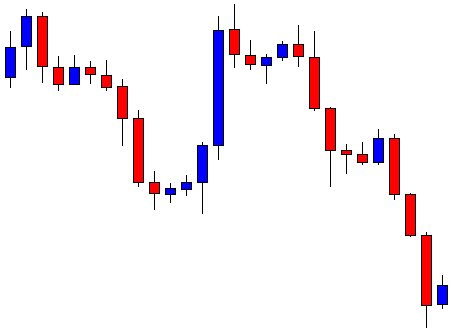
The price hits the target. The next candle, after the spinning top comes out as a bearish candle. However, it closes within consolidation support. If it were an H4 or the daily chart, the sellers would have to close the trade manually. This is the difference between trading on the minor chart and major chart.

If we have a plan to take trading as our fulltime business, we may have to trade on different charts from the 15M to Weekly. Trade management varies from chart to chart. This is what we must remember. In the beginning, we shall master on a particular chart that we are comfortable with. Then, we may start trading on the other charts, preferably on the demo first. Once we are confident, we may trade on that chart in our live account. We must not apply a strategy or manage the trade the same way on the weekly chart that we are successful on the H1 or the 15 Chart.