Categories
Forex Price Action

Chart Combination Trading: Even an Inside Bar Has a Lot to Offer

An Inside Bar is considered the weakest reversal candle as far as candlestick trading is concerned. However, in today’s article, we find out the significance of a daily Inside Bar in the daily-H4 chart combination trading. Let us get started.

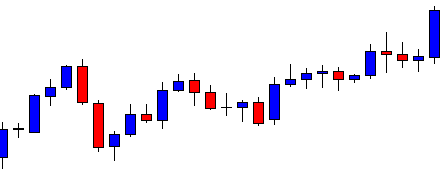
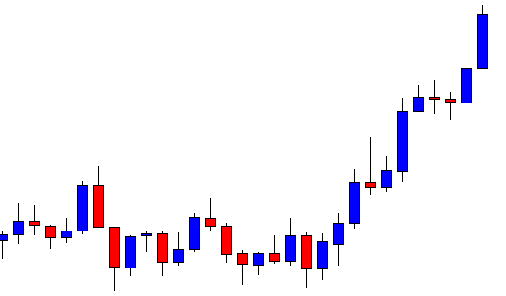
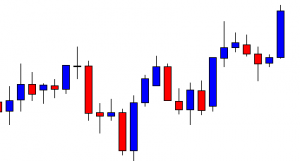
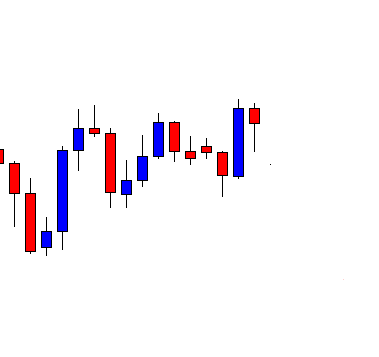
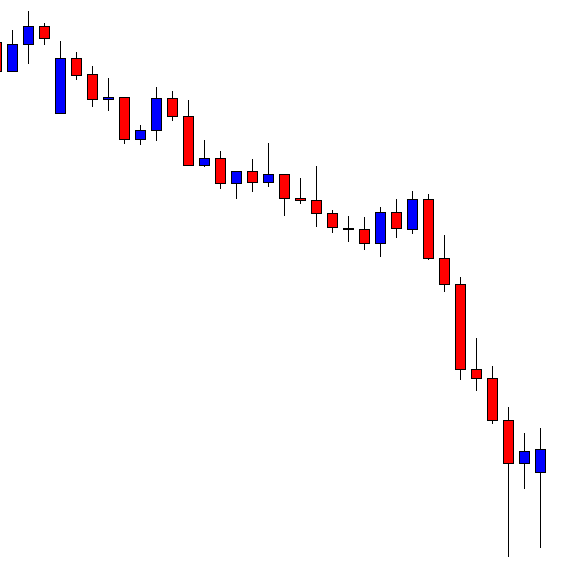
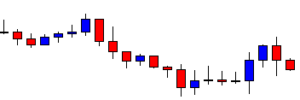
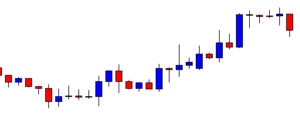
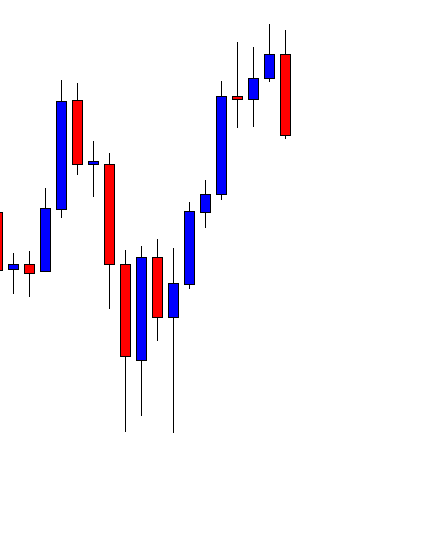
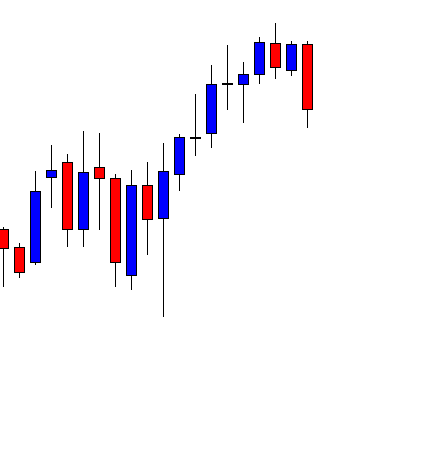
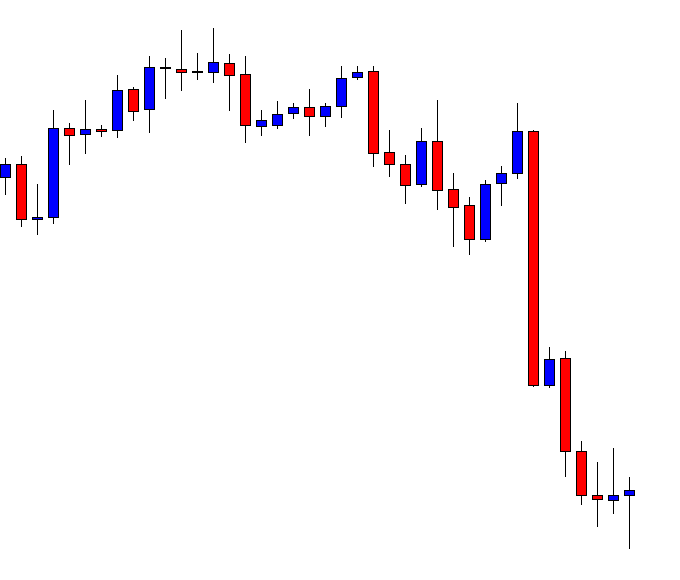
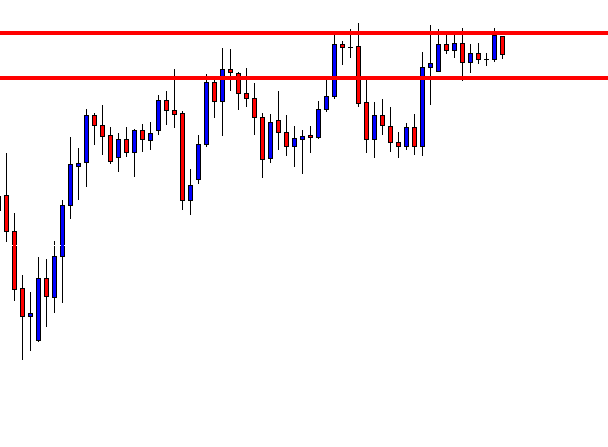
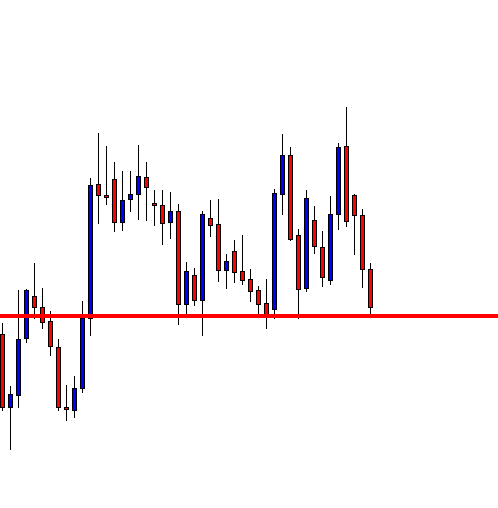
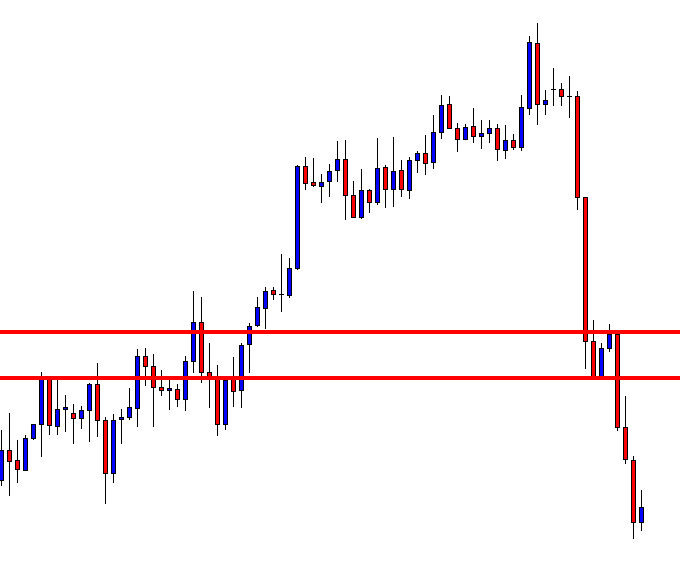
This is the daily chart. The chart shows that the last candle comes out as a bearish Inside Bar. The daily chart traders may still think that the chart is bullish biased. However, the daily-H4 chart combination traders are to flip over to the H4 chart and look for short entries since it is a bearish reversal candle after all.

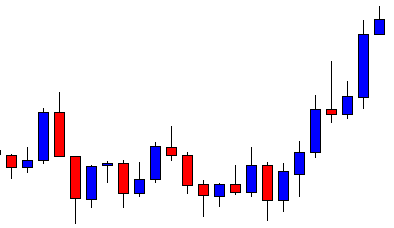
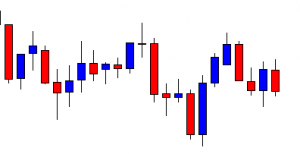
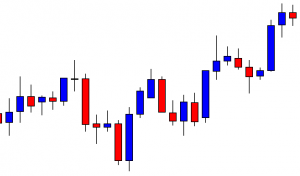
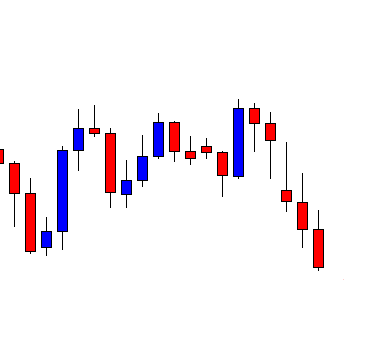
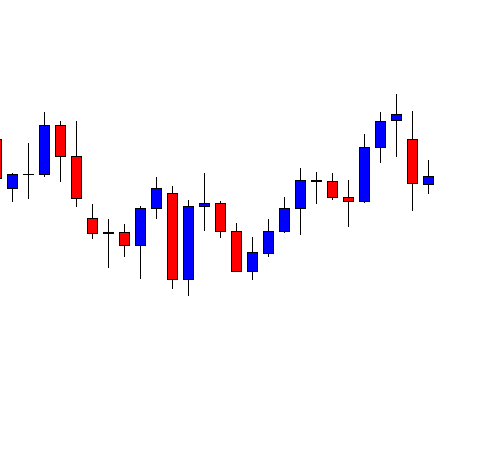
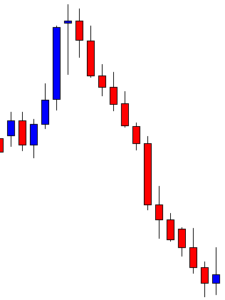
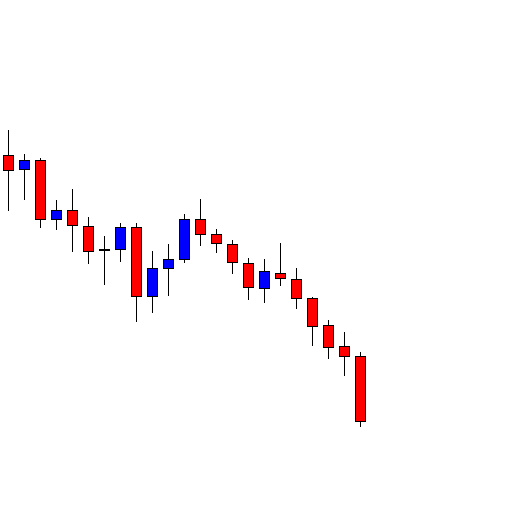
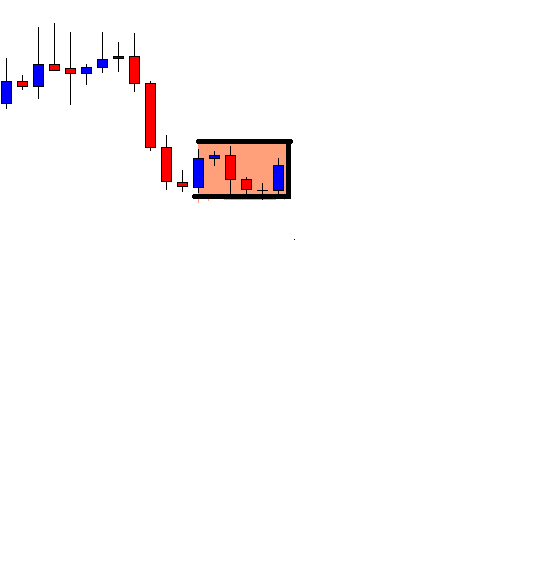
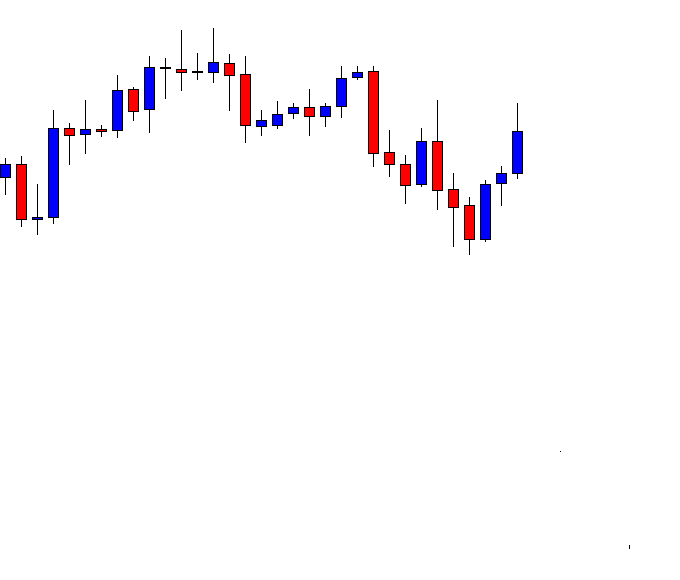
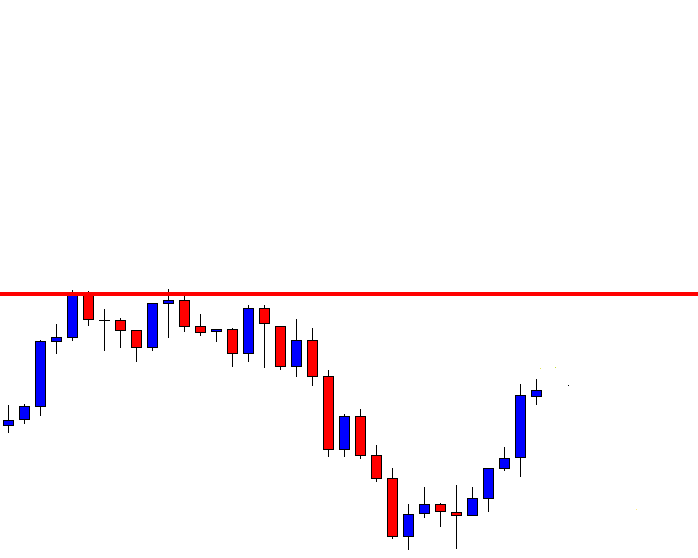
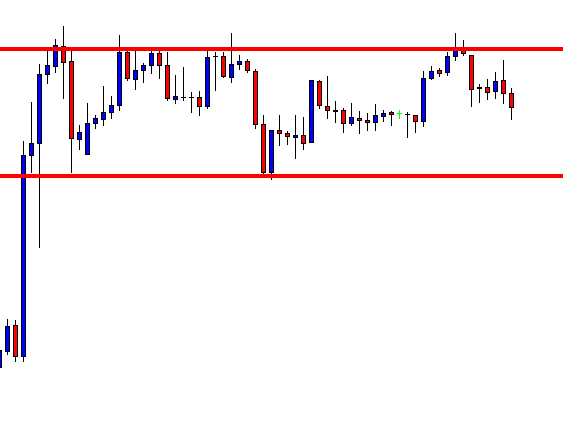
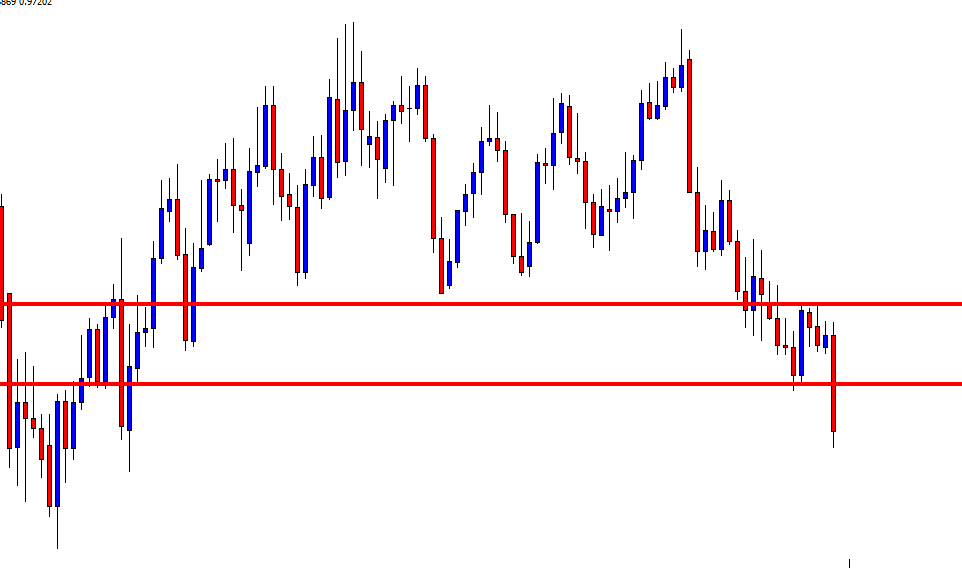
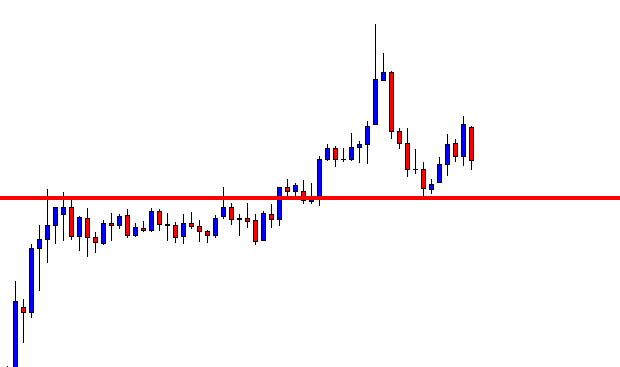
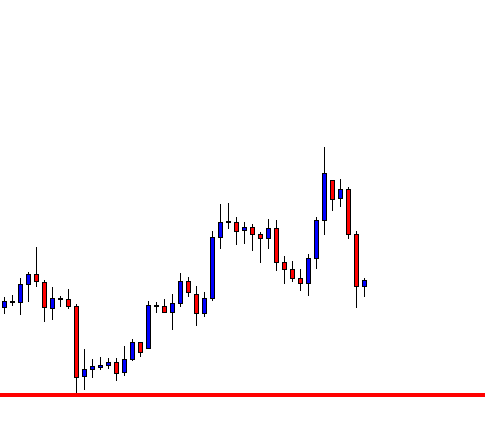
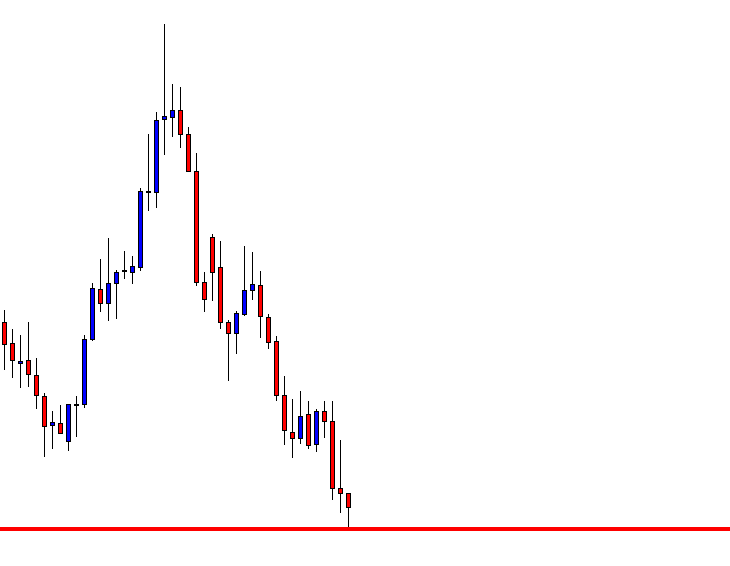
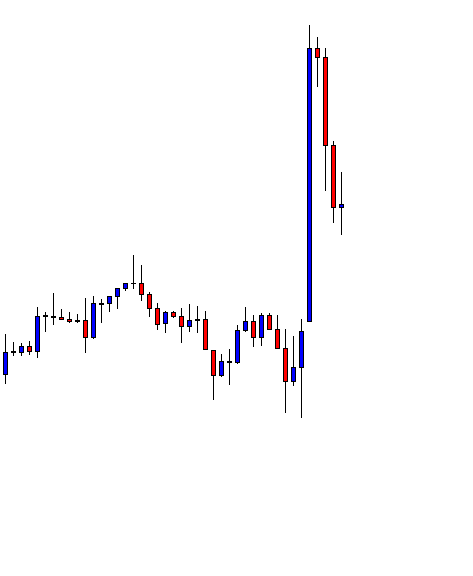
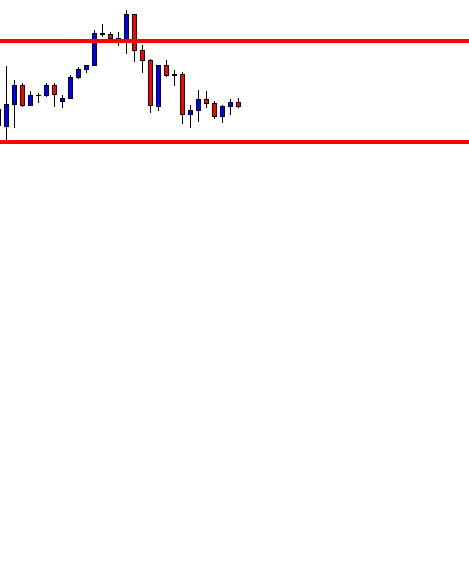
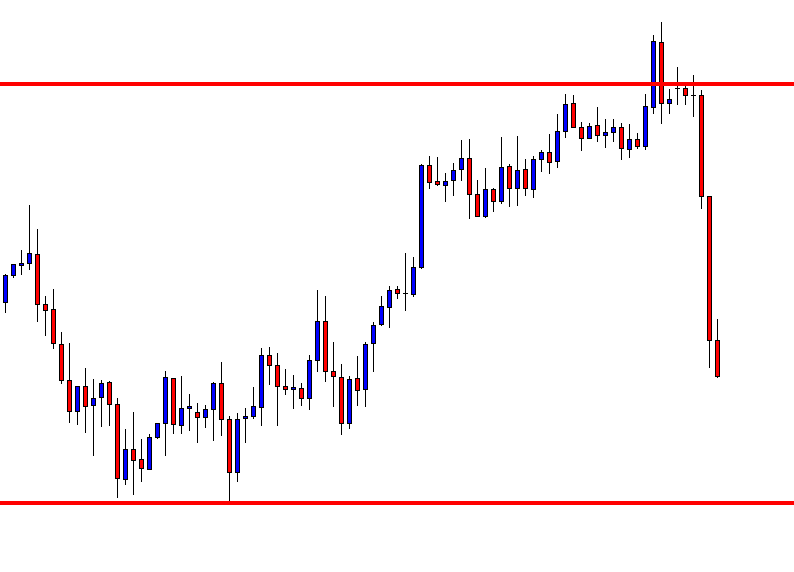
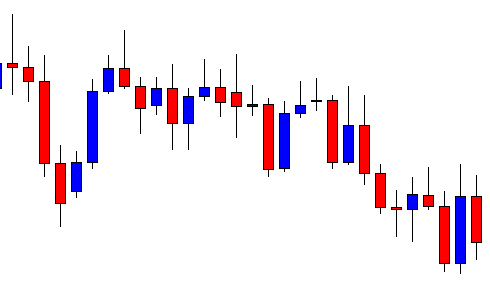
The H4 chart looks to be tailor-made for the sellers. The chart produces a double top, and the price breaches the neckline. The last candle comes out as a doji candle. The price may consolidate now.

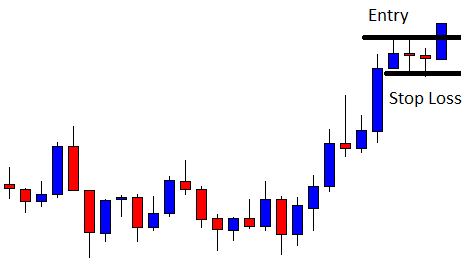
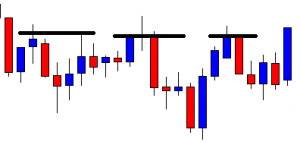
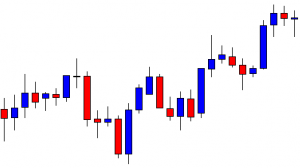
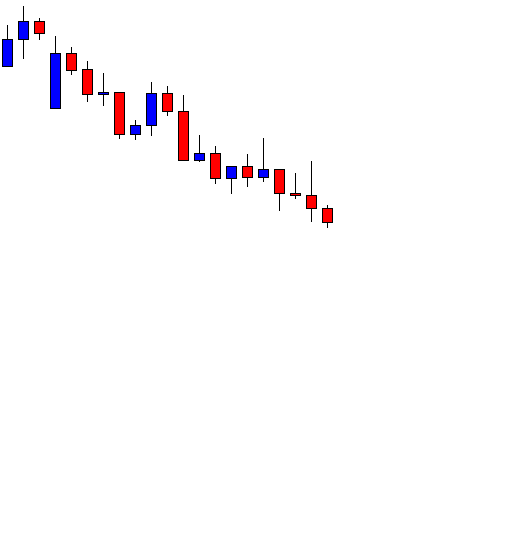
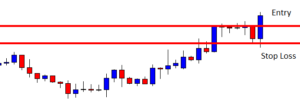
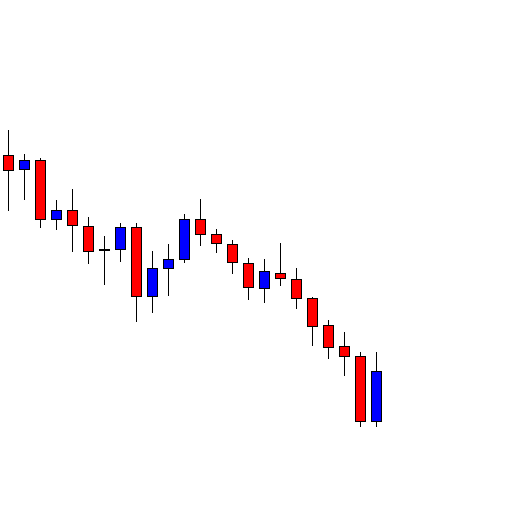
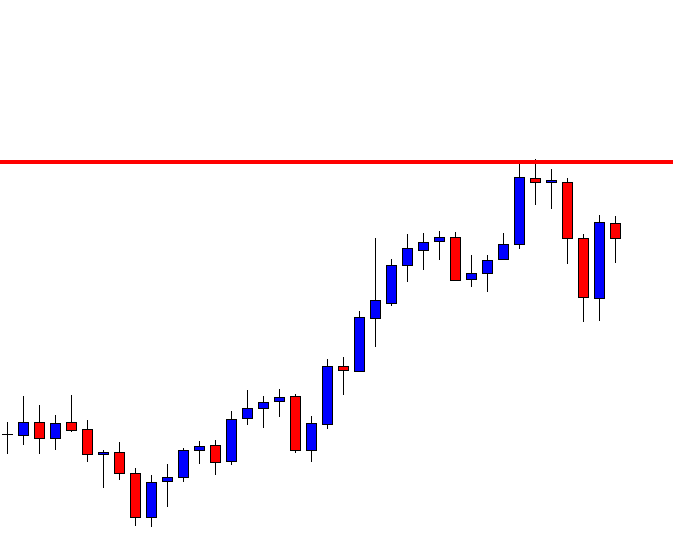
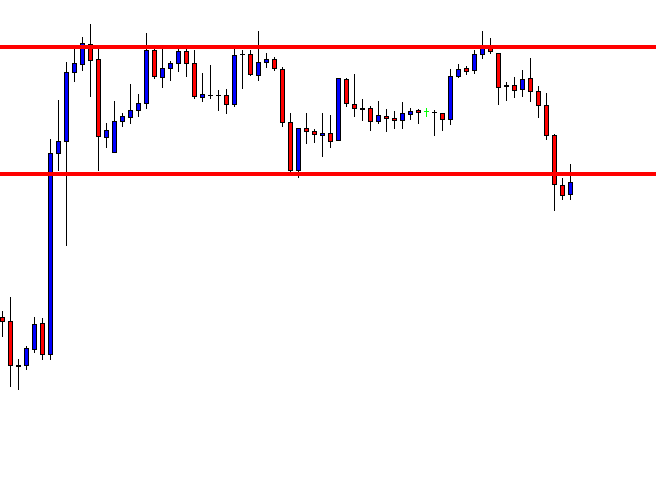
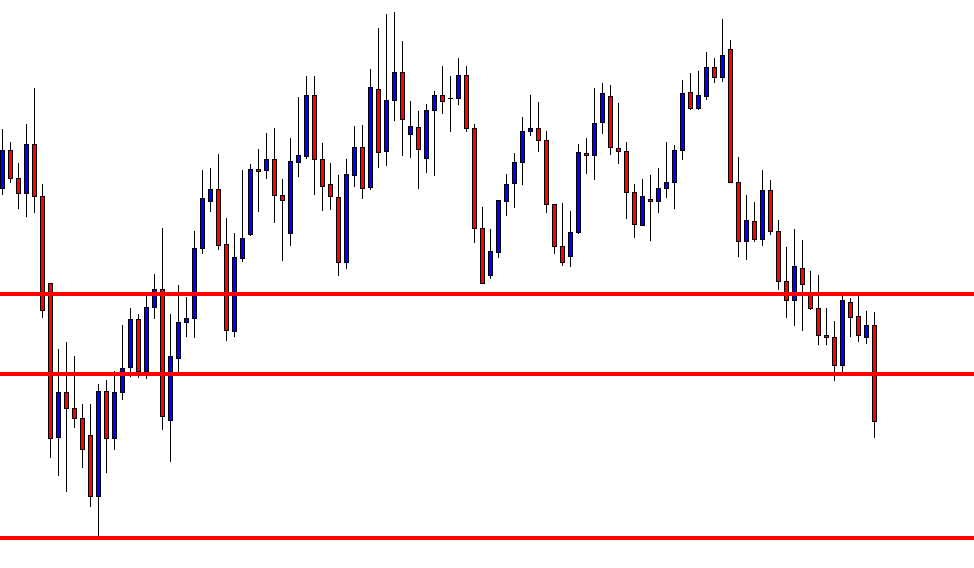
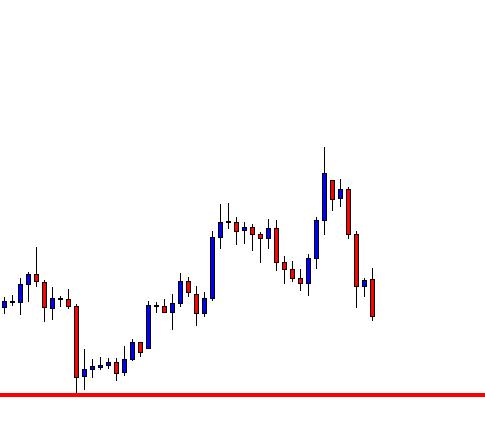
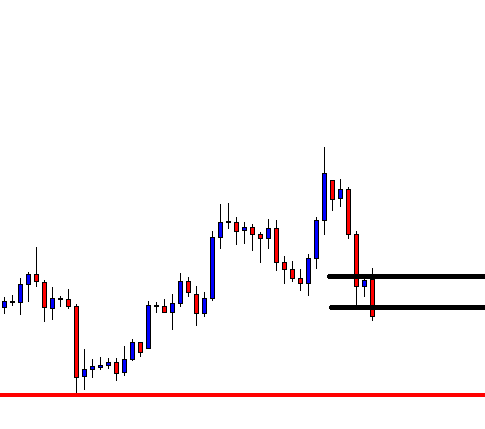
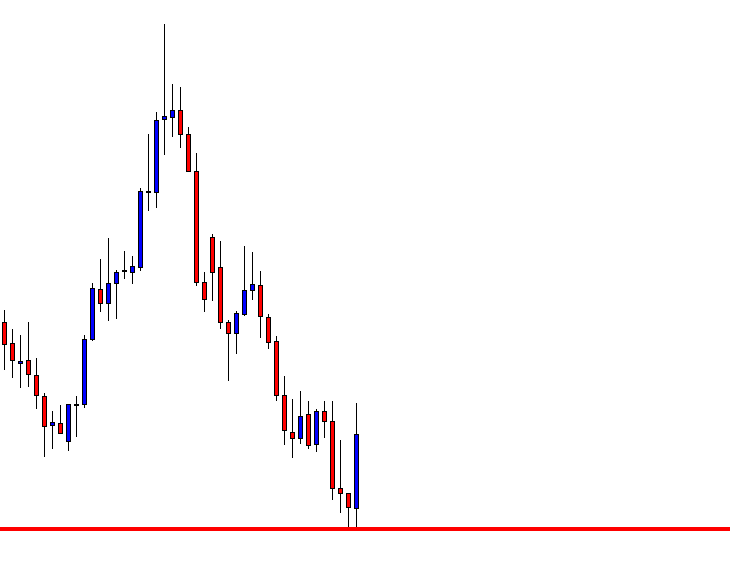
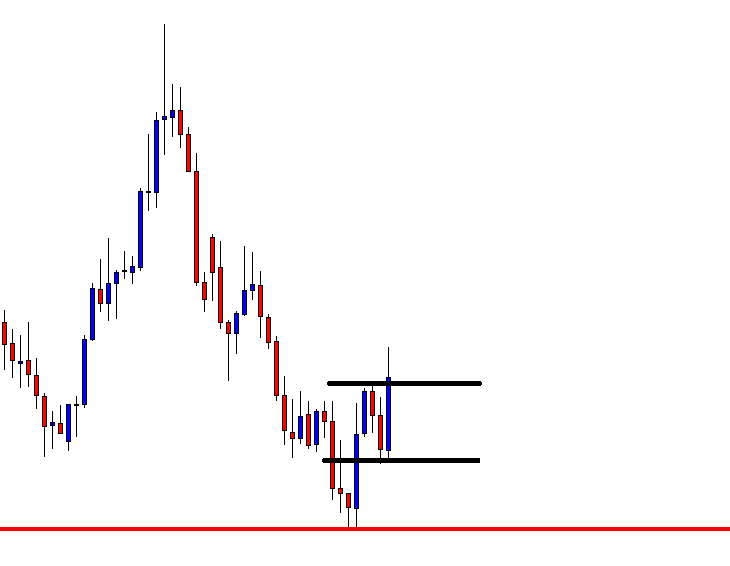
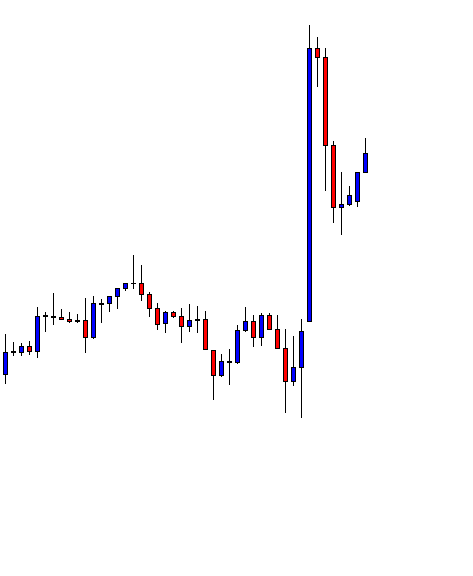
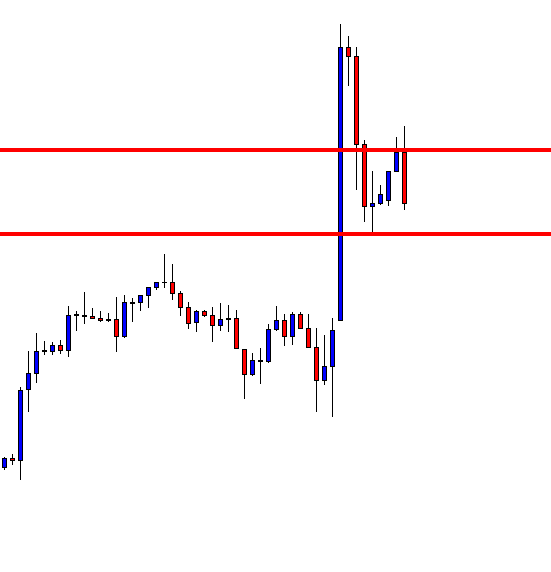
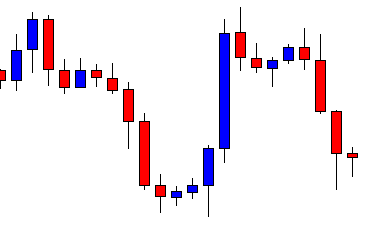
The chart produces another bearish candle closing within the same resistance. Then, it creates a bullish engulfing candle. Let us draw two lines here. The level of support looks very evident. However, the level of resistance still has a lot to prove.

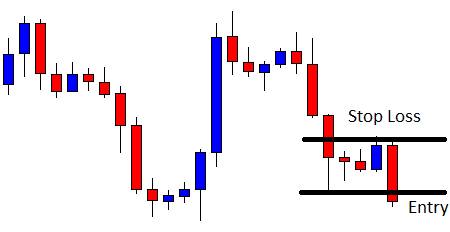
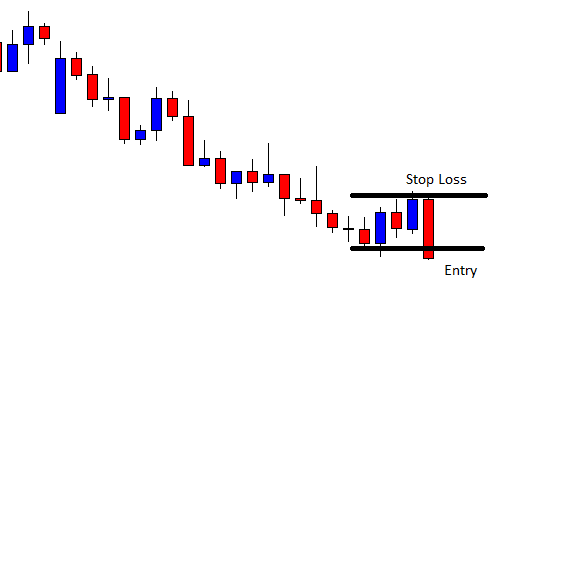
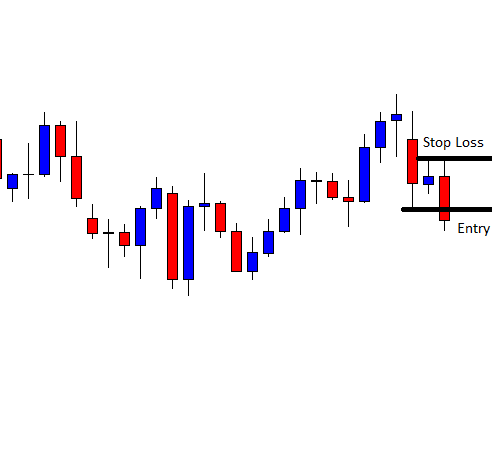
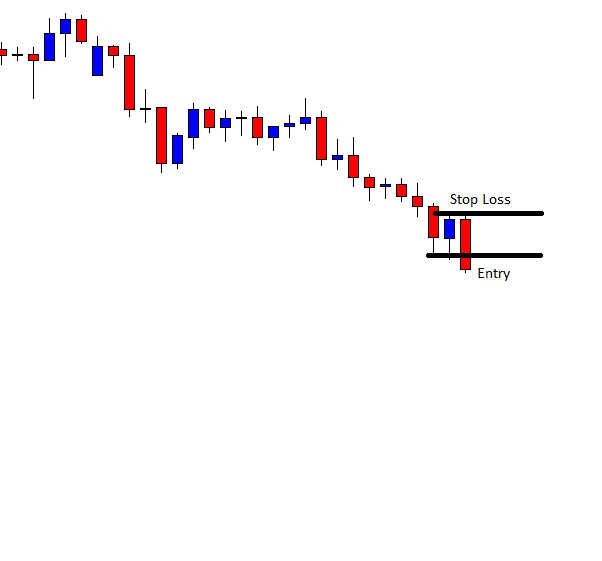
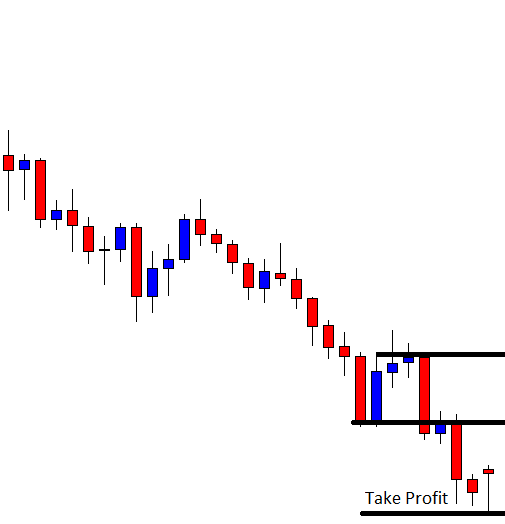
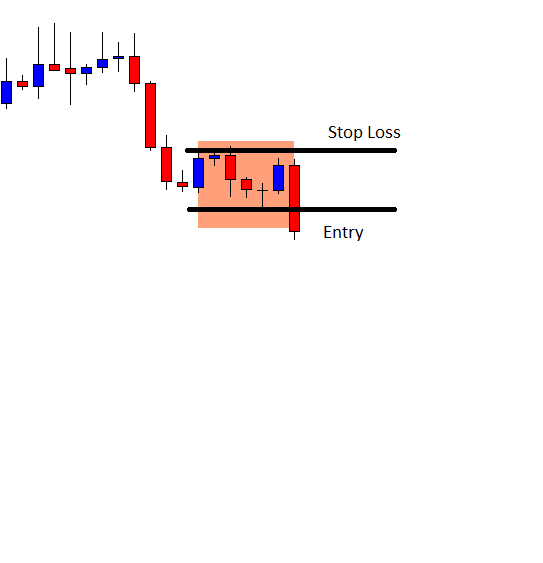
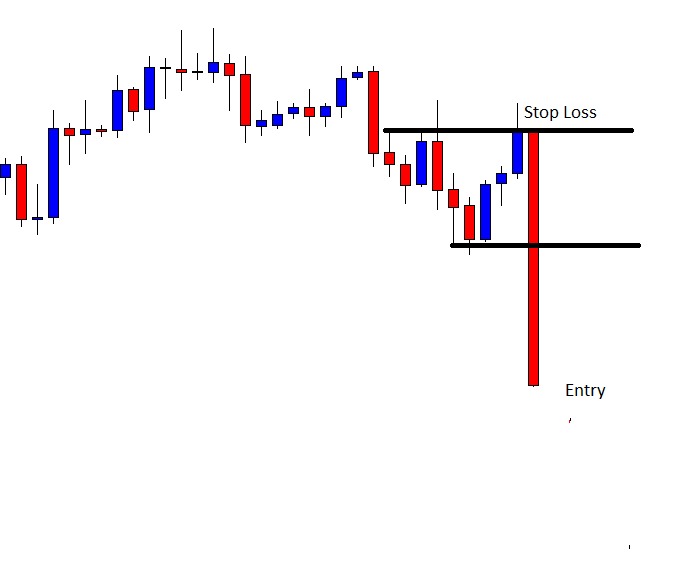
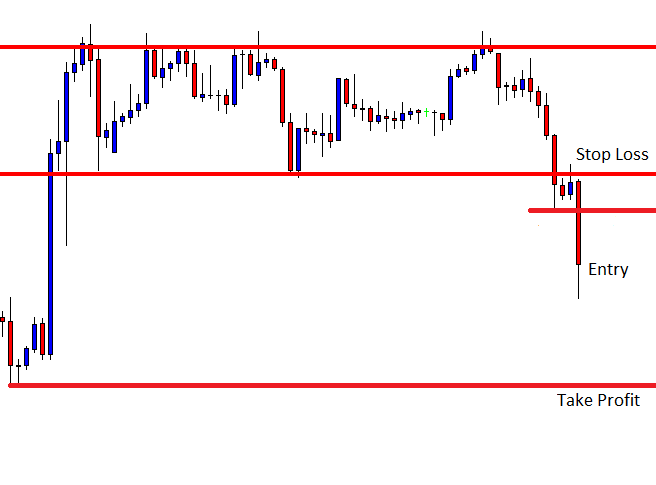
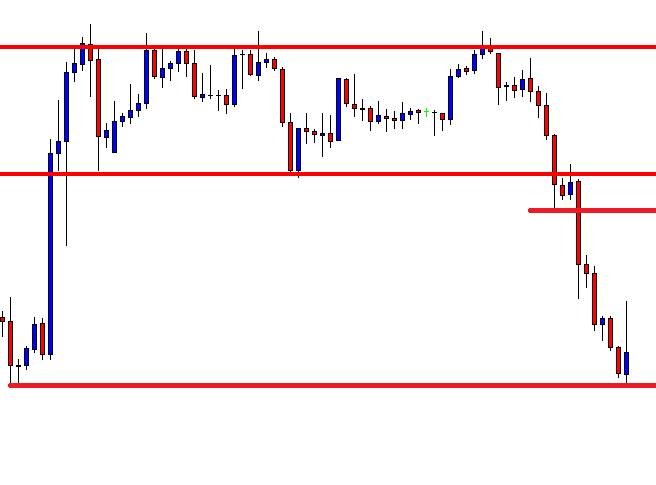
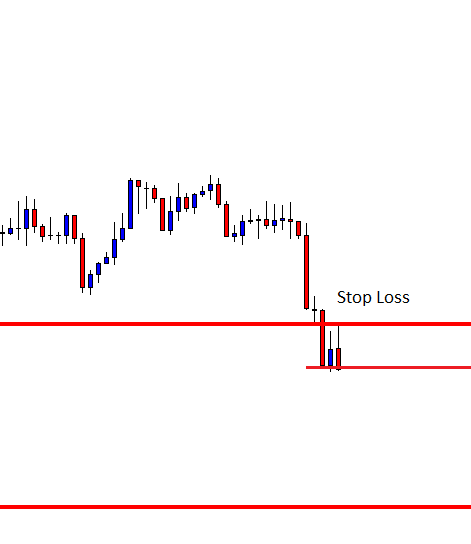
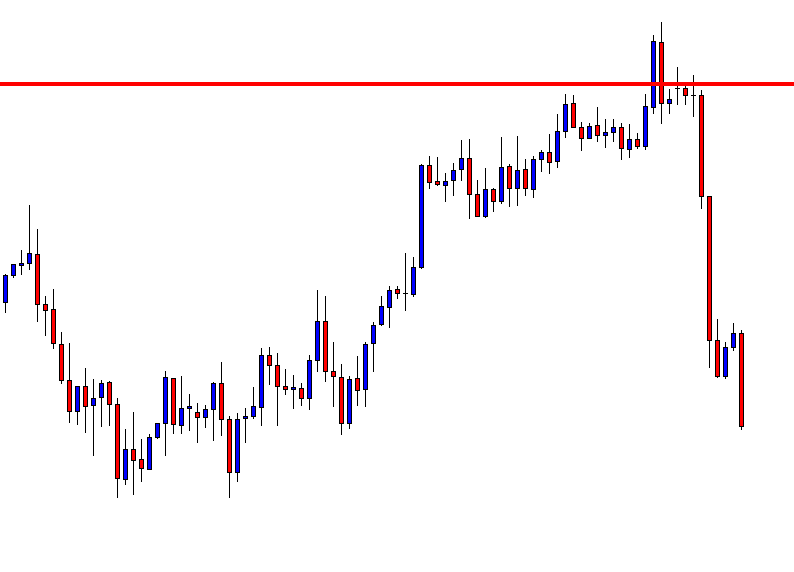
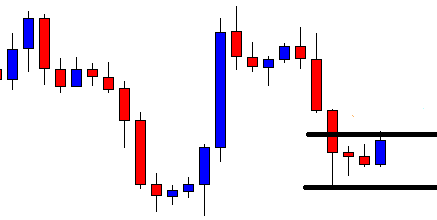
The level of resistance produces a bearish reversal candle. To be precise, it creates a bearish engulfing candle, closing below the level of resistance. The sellers may trigger entry right after the last candle closes by setting stop-loss above the level of resistance and by setting take profit with 1R.

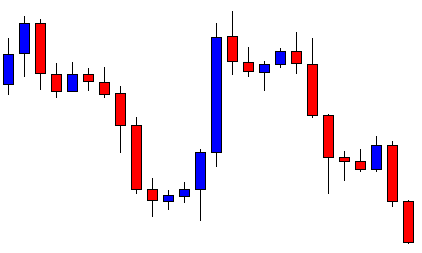
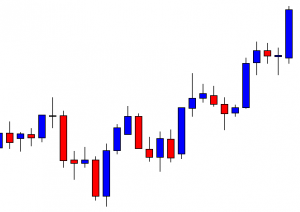
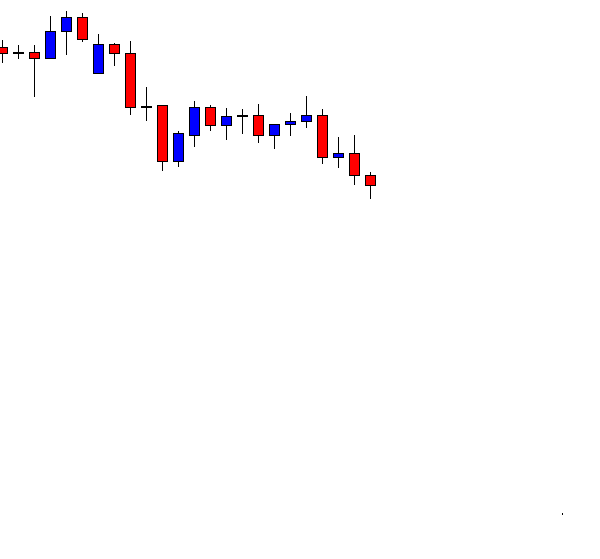
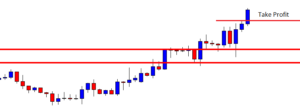
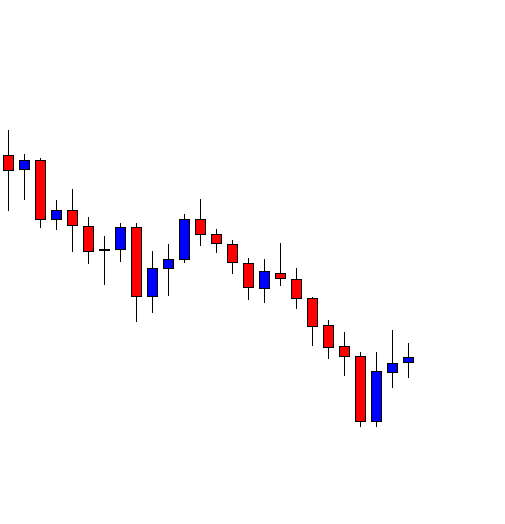
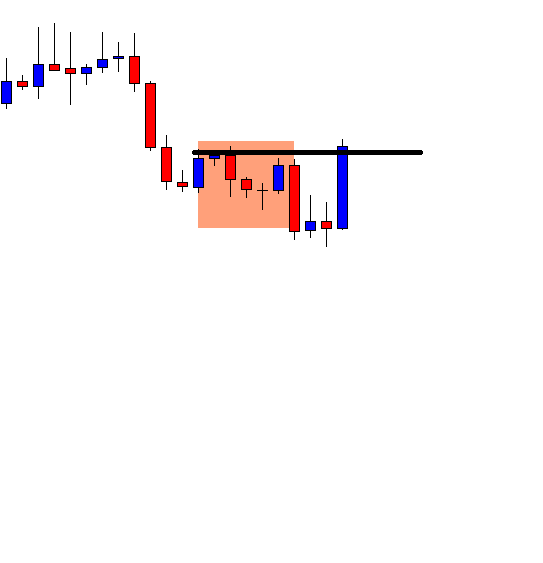
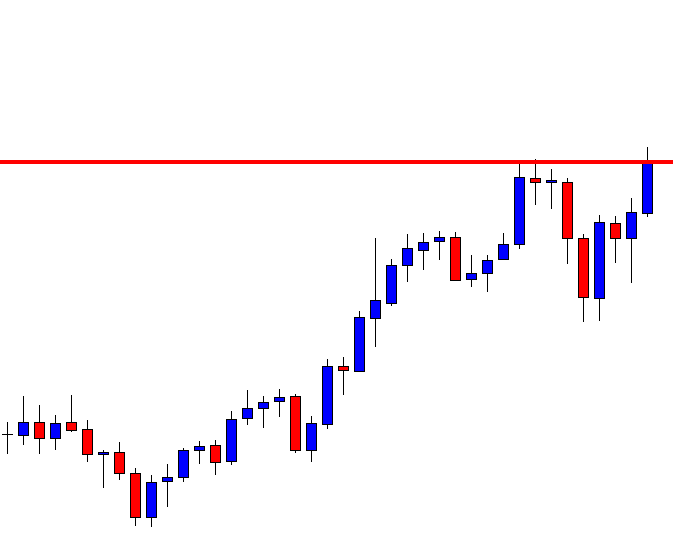
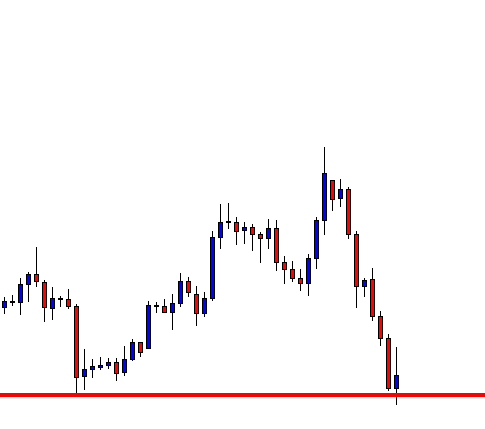
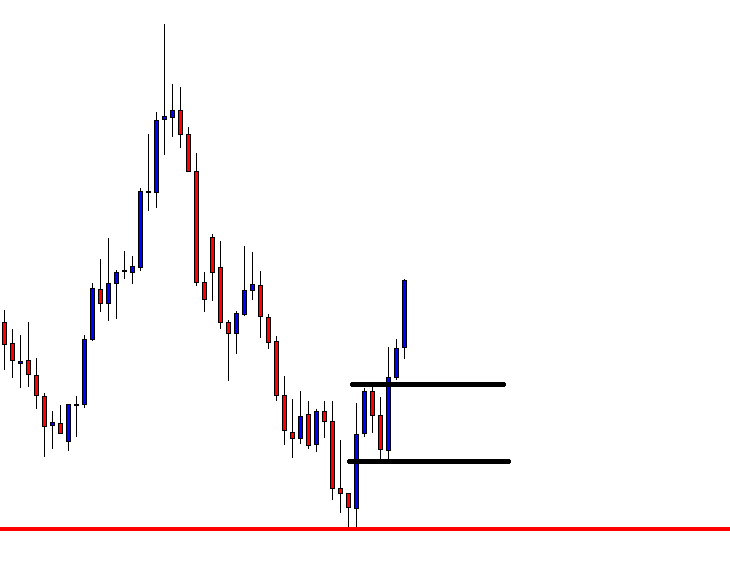
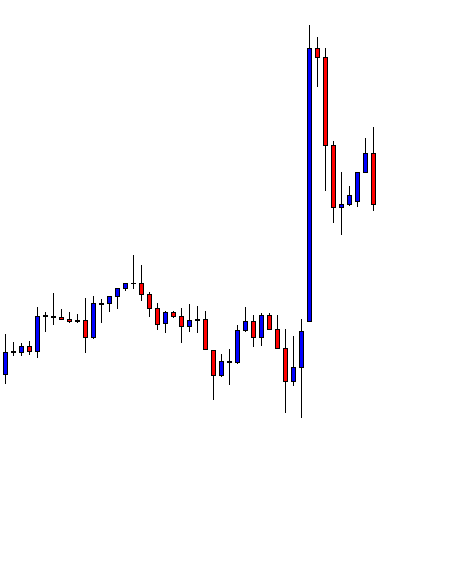
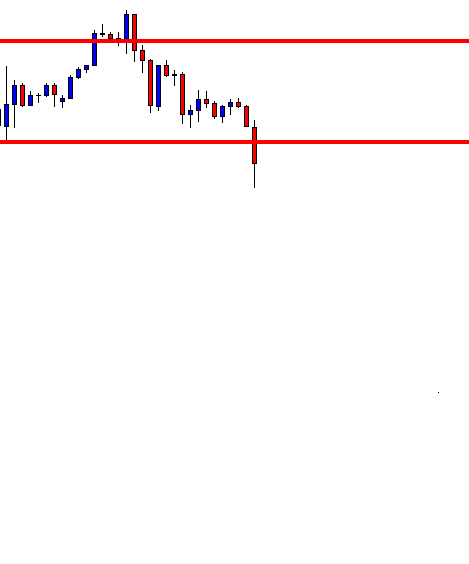
The price heads towards the South in the next candle as well. It seems that the sellers may not have to wait too long to achieve their target. Let us proceed to the following chart to find out how it goes.

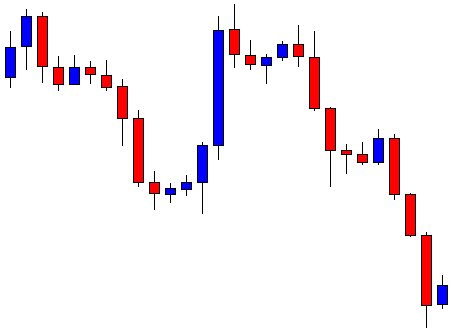
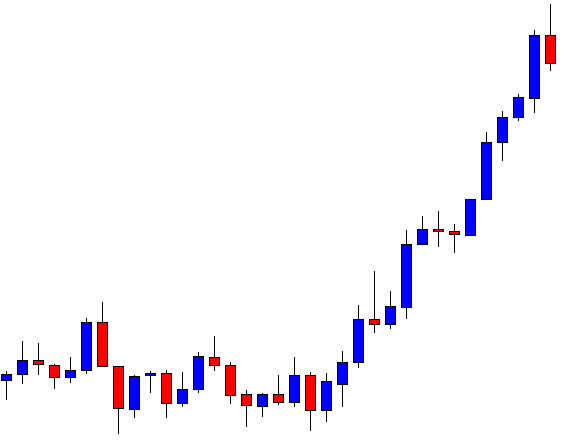
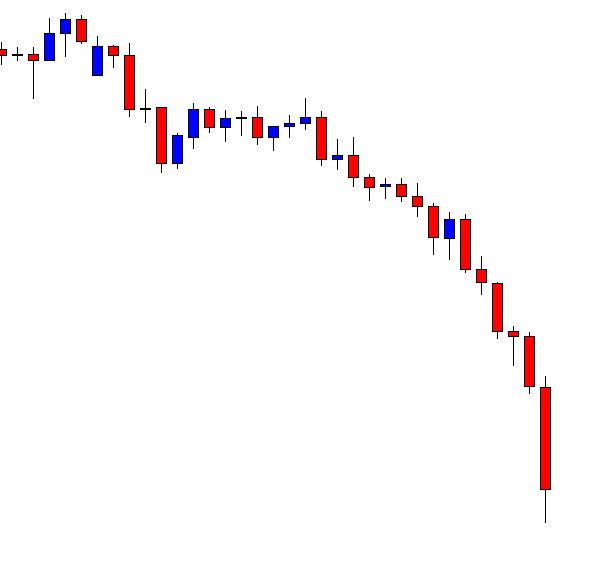
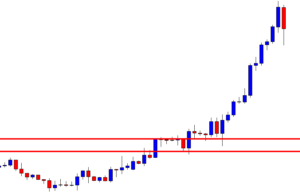
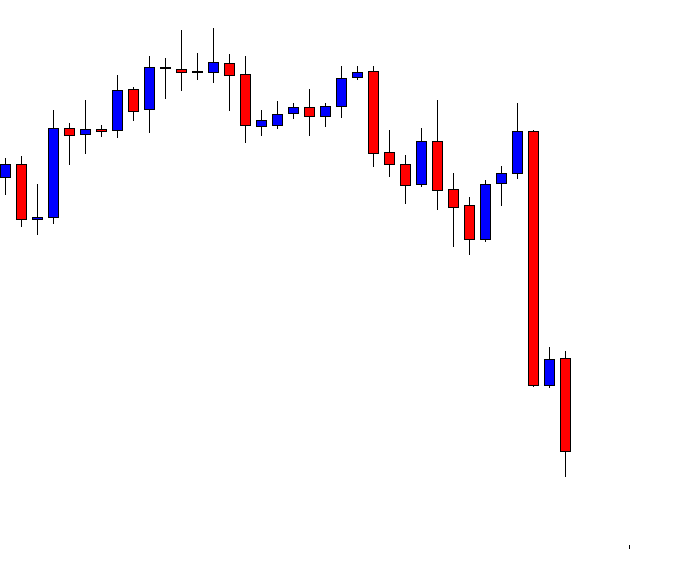
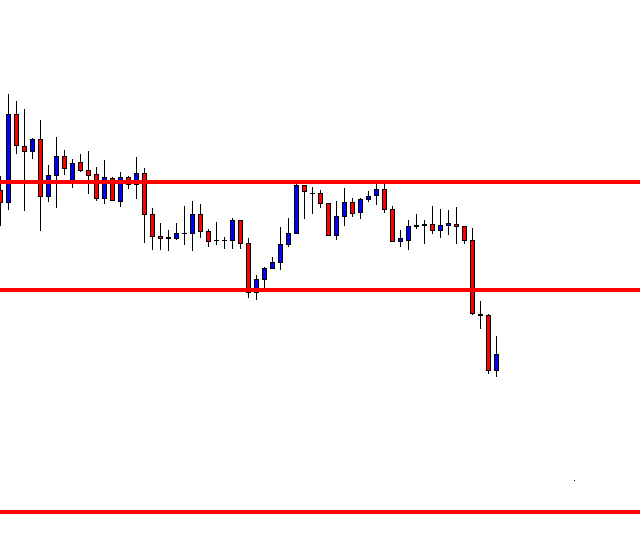
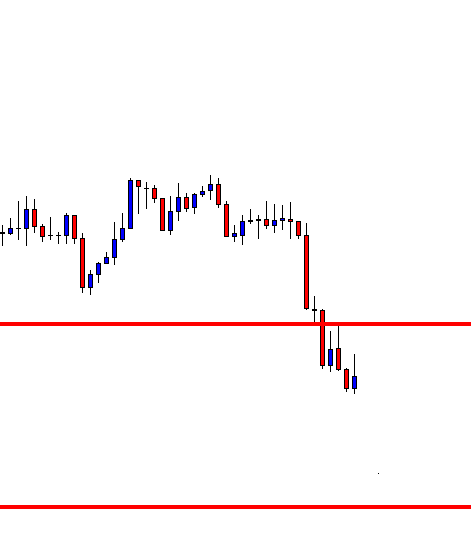
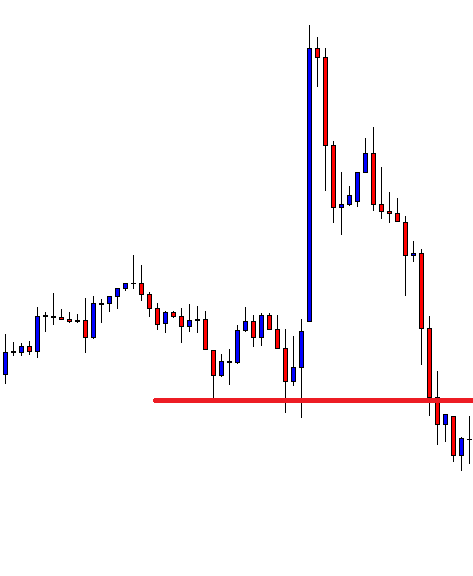
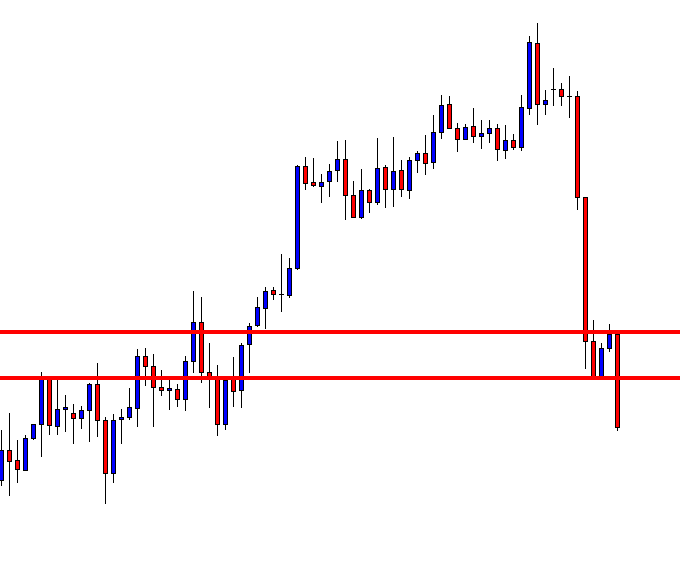
As expected, the next candle comes out as another bearish candle. This time it has even a longer body. Look at the last candle. The candle comes out as a bullish inside bar. Technically, the chart is still bearish biased. Do not forget that for the H4-H1 chart combination trading, they may have to flip over to the H1 chart to go long in the pair. This is what we have just demonstrated in the daily-H4 chart combination trading.

To sum up the lesson, an Inside Bar may not be a strong reversal signal in the chart. For the chart combination traders, it is a bit different. As long as it is a reversal candle does not matter how weak it is. The combination traders may flip over to the counterpart and wait for consolidation and a signal candle to trigger entry.

Categories
Forex Price Action

The Trend in a Bigger Frame is Traders’ True Friend

There is a saying in financial trading “Trend is traders’ friend.” Without any doubt, this is true. In a chart combination trading, a bigger timeframe’s trend plays an important role and helps traders a lot to go with an entry in its counterpart. Let us have a look through an example of how it works.

This is a daily chart. The chart shows that the price heads towards the North at a moderate pace. The last candle comes out as a bullish candle closing well above consolidation resistance. It means the daily traders may start eyeing to go long in the pair.  The daily-H4 combination traders may flip over to the H4 chart for the price to consolidate and produce a long signal.

This is the flipped H4 chart. The chart shows that the last candle comes out as a bullish candle with an upper shadow. The buyers are to wait for the price to consolidate now.

The price consolidates and produces a bullish candle breaching consolidation resistance. Here is a thing. The consolidation range is shallow. The consolidation range plays a significant role in determining the next move’s length. The length of consolidation here does not suggest that the next move will be a big one. The daily-H4 combination traders may trigger a long entry by setting stop loss below consolidation support and by setting take profit with 1R. Let us proceed to the next chart.

The price hits the target of 1R by the next candle. Concentrate on the last candle. The candle comes out as a bullish Marubozu candle. It suggests that the price may head towards the North further. Let us find out how far it goes.

The price heads towards the North with three more candles. This means it travels almost three times more length than the combination traders have anticipated. Can you guess what may be the reason for this?

The daily chart is in a strong bullish trend. The last daily candle breaches through consolidation resistance and makes a strong statement about its bullishness. That may have attracted the daily buyers to go long in the pair as well. This brings extra liquidity and helps the price head towards the North with extreme pressure. This happens most of the time in combination trading. If the bigger chart makes a breakout and has a solid trend, the price seems to head towards the trend’s direction at a good pace in the minor chart. The combination traders may keep this in their mind and make full use of this.

Categories
Forex Price-Action Strategies

Do not Forget to Check the Daily Chart

In today’s lesson, we demonstrate an example of an H4 chart and try to evaluate its price movement after breakouts. The chart shows that the price makes three breakouts altogether. The first two breakouts do not create that much momentum towards the breakout, but the last one does. We try to find out the reason behind it.

This is an H4 chart. The chart shows that the price makes a bullish move and consolidates. It seems that the price has found its support since it has already produced a bullish engulfing candle. The buyers may go long in the pair above consolidation resistance.

The chart shows that consolidation resistance is a strong level of resistance where the price gets rejection several times. Since it is an H4 chart, three times rejections, on the same level, means that it is a daily level of resistance. Thus, an H4 breakout may not create that much momentum all the time.

The chart shows that the price after making a breakout consolidates for a long time again. It is because of the daily resistance factor. The daily candle confirms the breakout. Thus, the price in the H4 chart consolidates. Look at the last candle. This comes out as a bullish candle breaching consolidation resistance. Let us find out what happens next.

The last H4 bearish inside bar is the last candle of the day. It means the daily candle comes out as a bullish candle after the daily breakout, breakout confirmation, and daily reversal candle.

The price consolidates with one more candle to start the next trading day. A bullish reversal candle may push the price towards the North with good bullish momentum. Since the chart now belongs to the H4 traders as well.

Here it is. The chart produces a bullish engulfing candle closing well above consolidation resistance. The length of consolidation is shallow. However, the bullish reversal candle looks to be a perfect signal candle.

There she goes. The price heads towards the North with extreme bullish momentum. The last candle suggests that the price may continue its bullish journey. Let’s look at the last move. The price does not consolidate with enough depth, but it makes a strong bullish move. On the other hand, on the first two occasions, it consolidates well, but its breakout does not create good momentum. It is because, on the first two occasions, there is a daily resistance factor. The level of daily resistance makes the H4 traders wait for more. Once the price makes a breakout on the daily chart, it heads towards the breakout direction with good momentum. The H4 traders are to check the daily chart before taking entry. This is one more reason to check that one thoroughly.

Categories
Forex Daily Topic Forex Price-Action Strategies

Forex Traders: Get Patience, Optimism, and Never Give Up Attitude

In today’s lesson, we are going to demonstrate an example of the daily-H4 combination trading, which makes traders wait for a long time. Usually, if the daily chart produces a daily reversal, it creates an H4 entry within a day or two. In today’s lesson, the H4 chart takes four days after creating a daily reversal to produce the signal candle. Let us find out how it offers us entry.

This is a daily chart. The chart shows that it produces a bearish inside bar at a strong resistance zone. An inside bar is not a strong reversal candle, but a strong resistance zone may attract the sellers to look for short opportunities. The daily-H4 combination traders are to flip over to the H4 chart for the price to consolidate and produce a bearish reversal candle to offer a short entry. We flip over to the H4 chart later. Let us now have a look at the daily chart with four more daily candles.

The chart produces four more candles that are bearish. However, the daily-H4 combination traders do not get any A+ entry to go short. Should they skip eyeing on this pair? Never, they need to perform the same duty. As long as the last daily candle is bearish, they are to flip over to the H4 chart. The last candle on this chart is bearish. Let us flip over to the H4 chart this time.

You may notice that the H4 chart does not make deep consolidation followed by a bearish engulfing candle to offer them a short entry so far. Traders are to flip over to the H4 chart every day with no luck. Let us proceed to the next H4 chart.

The chart shows that it is having a deep consolidation. The last candle comes out as a bullish engulfing candle. However, the chart is still bearish biased unless it produces a bullish daily reversal candle. The sellers are to wait for an H4 bearish engulfing candle closing below consolidation support to offer them a short entry.

Here it is. The last candle comes out as a bearish engulfing candle closing well below consolidation support. The sellers may trigger a short entry right after the last candle closes with 1R.

The price heads towards the South with extreme bearish pressure. The price hits 1R with ease. Some traders may even make much more than 1R by taking a partial profit. In the end, it ends up being a prolific entry.

It does not come easily, though. The daily-H4 combination traders are to keep eying on the charts for four consecutive days. The H4 chart produces the signal on the fifth day after producing the daily bearish reversal candle. This is why Forex traders need to have patience, optimism, and never give up attitude.

Categories
Forex Price-Action Strategies

A Pair Offering Multiple Entries on Different Charts

In today’s lesson, we are going to demonstrate an example of a chart, which ends up offering two breakout entries for the price action traders. There is a saying, “do not put all your eggs in the same basket.” Forex traders are to maintain this as well. However, sometimes we may have to do things a bit differently. Let us find out why and how.

This is a daily chart. The chart shows that a bearish engulfing candle followed by a bullish inside bar sets a strong bearish tone in the chart. If a bearish candle closes below consolidation support, the sellers may go short on the pair.

Here it comes. The last candle on this chart closes below consolidation support. This is an explicit breakout. The daily breakout traders may trigger a short entry right after the candle closes by setting their stop loss above the signal candle’s highest high and by setting their take profit with 1 R.

Here is something interesting you may have noticed. Since the daily chart is bearish biased, the H4 chart shall be bearish as well. Let us flip over to the H4 chart.

This is how the H4 chart looks. The price consolidates and produces a bearish reversal candle already, although it is not a deep consolidation. Let us not talk about it. Let us proceed to the next chart.

The last candle comes out as a bullish inside bar. This time there is a deep consolidation as well. If the chart produces a bearish engulfing candle, the sellers may trigger a short entry. Let us not forget that the daily breakout traders have already taken an entry.

The H4 chart produces a beautiful bearish engulfing candle closing below consolidation support. The H4 breakout traders may trigger a short entry right after the last candle closes by setting stop-loss above the signal candle’s highest high and by setting take profit with 1R.  Let us find out how the trade goes.

The price heads towards the South with extreme bearish pressure. Some H4 breakout traders may get 3R from this chart. Now the question may arise here is whether we should take an entry on the H4 chart as well? If we go by saying, “do not put all your eggs in the same basket’, we may not.

We actually should take the entry on the H4 chart as well after taking the first entry on the daily chart. First, we are not taking the second entry based on the daily chart. It is a different setup, although the strategy is the same. If we are confident and experienced in trading different charts, we are all right to take entry in the same pair. This usually brings us a bagful of pips.

Categories
Forex Daily Topic Forex Price Action

A Business of Glorious Uncertainty

Trading on the daily-H4 chart combination often brings more reward than our initial expectation. Typically, traders aim to earn 1R. However, it may even bring up to 5R. In today’s lesson, we are going to show an example of this.

This is a daily chart. The price heads down with good bearish momentum. The last candle is a spinning top. In a strong bearish daily trend, a spinning top does not suggest that the trend may change. However, the H4-daily traders’ strategy is different. They are to flip over to the H4 chart and wait for consolidation followed by a bullish breakout, to go long on the pair. Let us flip over to the H4 chart.

The H4 chart looks good. The chart produces two bearish candles consecutively. The buyers are to wait for a bullish engulfing candle closing above consolidation resistance to go long. The chart suggests that the buyers shall stick with the chart.

It consolidates more and produces a bullish engulfing candle. However, the candle closes within consolidation resistance. They are to wait for more. Look at the last candle. It seems like it is going to have a deep consolidation again.

This time the chart produces a bullish engulfing candle closing well above consolidation resistance. The buyers could trigger a long entry right after the candle closes and set the stop loss below the signal candle’s lowest low.

The trade does not go as per buyers’ expectations. It takes time to hit the target. However, the candle breaches through the take-profit level, closing as a strong bullish candle. The buyers may consider taking a partial profit and let the rest of the trade run. Let us find out what happens next.

This time the price heads towards the North with extreme bullish pressure. It travels about five times the distance of the buyers’ initial target. Assume, by taking partial profit, how much more a trader can earn. This is the beauty of trading on the daily-H4 combination. Since the daily chart is involved here, the price often heads towards daily support/resistance. This brings traders more profit if they deal with their trade accordingly. Another interesting point here to be noticed, despite producing an excellent bullish engulfing candle, the price does not head towards the North with good bullish momentum. On the other hand, once it hits the target level by producing another bullish Marubozu candle, it keeps going towards the North with extreme bullish momentum. This is why trading may be called a business of glorious uncertainty.


Categories
Forex Price Action

Never Know What is around the Corner

In today’s lesson, we are going to demonstrate an example of trend riding along with the H4 breakout trading strategy. We often see that the market is in a strong direction, but it does not offer many entries. It is frustrating, but we must take it easy. We must not be impatient but keep our eyes on the chart. We never know what is around the corner.

This is an H4 chart. The chart shows that the price has been heading towards the South with strong bearish momentum. However, it has not offered any A+ entry yet. It produces some strong bearish engulfing candle breaching through consolidation support. However, consolidations have been shallow. Thus, the sellers on this chart have not been able to make the most of it. Look at the last candle. It comes out as a strong bearish candle as well. It suggests that the bearish trend is strong enough, and it may drive the price towards the South further. Let us proceed to the next chart.

The chart produces a bullish inside bar. This time it looks better since the inside bar candle is a long one. This means if the chart produces a bearish engulfing candle again, it would be after a deep consolidation. The deeper consolidation, the better it is as far as reward is concerned.

The chart produces two more bullish candles. It looks like it has been searching for its support. Deeper consolidation/correction is good, but if it goes too far by making a bullish breakout, equation changes. Let us proceed to the next chart.

Here it comes. An A+ bearish engulfing signal candle this is. The sellers may trigger a short entry right after the candle closes by setting stop-loss above the candle’s high. Take profit may be set with 1:1 risk-reward.

The chart produces another bullish corrective candle after such a nice-looking bearish reversal candle. However, it heads towards the South and hits the target. We learn two lessons here.

  1. A chart may not offer as many entries as we anticipate, even it is on a strong trend.
  2. We never know what is around the corner in the Forex market.

At one point, it seems that the chart may not offer any short entry for the H4 sellers. The price keeps heading towards the North. Deep consolidation is about to get into too deep. At last, the signal candle comes and offers an excellent short entry. While trading, we are always to be on our toes since we do not know what is around the corner in the Forex market.


Categories
Forex Price-Action Strategies

The Right Strategy with the Wrong Chart Creates a Losing Trade

In today’s lesson, we are going to demonstrate an example of the daily-H4 chart combination trading, which has everything to offer a good entry. However, the outcome is not what we would love to get. Let us dig into it and find out what may go wrong with the setup sometimes and where we have to be careful.

This is a daily chart. Look at the last candle. This is an A+ bearish engulfing candle, which the price action traders crave for. The sellers are to flip over to the H4 chart for the price to consolidate and make a bearish breakout to offer them a short entry. Let us flip over to the H4 chart.

The price consolidates for six H4 candles (remember the number six). However, it has not made any breakout. Let us assume that we keep an eye on the pair. Let us proceed to the next chart.

The chart produces a breakout candle. If we are to give it a grade, it would get A+ as well. It means everything looks good. We may trigger a short entry right after the breakout candle closes.

The price does not head towards the South according to the sellers’ expectations. It goes another way and hits the stop loss. The daily reversal candle and the H4 breakout candle both have all the attributes to attract the sellers to go short on the pair. Is there anything wrong with the entry?

First, it may happen. It does not matter how good a trade setup looks. It may get us loss. It is a game of probability after all.

Now concentrate here. This entry looks good in naked eyes but it is not. Do you remember how many candles it consolidated with? It consolidated with six H4 candles and makes the breakout by the 7th candle. It means the H4 support becomes daily support. Thus, an H4 breakout is not enough to attract the sellers to go short on the pair. To have a clearer view, have a look at the daily chart again.

The last candle comes out as a bullish inside bar. It means the pair is still bearish biased but it is for the daily traders. If the daily chart produces a bearish engulfing candle closing below the level of support, the daily sellers may go short. Meanwhile, it produces a false signal on the H4 chart and makes some sellers lose money.

Trading at the right chart with the right strategy is an important aspect to be successful in trading. It does not matter how good an angler you are. If you do not choose the right place and the right hook, you are going to come back home empty-handed.

Categories
Forex Daily Topic Forex Price-Action Strategies

Taking Partial Profits: an Alternative if You are Too Defensive

In today’s article, we are going to demonstrate an example of the daily-H4 chart-combination price-action trading. The signal candle comes out as a strong bearish candle, which attributes have a lot to offer to the sellers. Let us find out how it ends.

This is a daily chart. The last candle comes out as a bearish engulfing candle. The daily-H4 combination traders are to flip over to the H4 chart for the price to consolidate and produce a bearish reversal candle to offer them a short entry below the consolidation level of support.

This is the H4 chart. The price consolidated earlier before producing that daily bearish reversal candle. Traders must wait for consolidation and a bearish candle from now. It produces two bearish candles consecutively. It may consolidate soon.

It produces one more bearish candle and starts having a correction instead of consolidation. It is less likely that the chart presents a bearish engulfing candle breaching the level of support. We shall never be certain, though, since it is the Forex market. Let us see what happens next.

Would you believe it? What a good-looking bearish engulfing candle that is! The sellers may trigger a short entry right after the candle closes by setting stop-loss above the level where it has a rejection. Such price action offers 1:1 risk-reward easily. Considering the signal candle, the price may go towards the South further and get more reward to the sellers.

The chart produces a bullish inside bar and heads towards the South again. The last candle comes out as a bearish Marubozu candle. The sellers must hold the trade to make a handful of pips.

The price heads towards the South for one more candle. However, it produces three consecutive bullish reversal candles. The last one comes out as a bullish pin bar. The price is still to cover a lot of space to get us 1:1 risk-reward. By looking at the price action for the last three candles, it seems that the price may have an upside correction before making the next bearish move. It may even change its trend as well. It is best to have a belief in our positions and hold it as long as we can. In other words, we shall remember the rule ‘set and forget.’ However, if the price produces too many reversal candles and strong reversal candle such as pinbar, truck rail, or engulfing candle, we may consider taking a partial profit.

In such cases, taking a partial profit comes handy. We may take out at least 50% profit and let the rest of it run. Even if the trend changes, we do not lose money. On the other hand, if it goes towards our desired direction, it gets us more profit.

Categories
Forex Price-Action Strategies

The Daily-H4 Chart Combination May Have More to Offer

We have been learning the daily-H4 chart combination trading, where we flip over to the H4 chart once we get a daily reversal candle. In today’s lesson, we are going to demonstrate the strategy, which offers entry in a different way. This strategy is quite handy. We find out the reason in a minute.

This is a daily chart. The chart produces a bullish engulfing candle, with its the swing high far enough. This allows that daily-H4 chart combination traders enough space to hunt for pips. This is time for the traders to flip over to the H4 chart.

The H4 chart shows that the price heads towards the North with good bullish momentum. The last candle comes out as a bullish candle. However, it closes within the last H4 candle’s resistance. Traders are to wait for consolidation and bullish H4 reversal candle to go long on the pair.

The price consolidates and produces a bullish reversal candle. However, the price does not breach the consolidation resistance yet. Moreover, you may have noticed that there have been six H4 candles. It means the whole trading is passed, but the price does not make any breakout. Please note that if the H4 chart does not produce a reversal candle followed by a breakout at the highest high or lowest low within the next day, the daily-H4 chart trade setup is not valid anymore. This means we have wasted our time. It is a part of trading. We must take it professionally. However, we may have good news here. Let us flip over to the daily chart again.

The last daily candle comes out as an Inside bar. As far as the candlestick pattern is concerned, the price is bullish biased. If we get a bullish engulfing candle closing above the last two candles, the price may head towards the red marked level.

Here it comes. A bullish engulfing candle with a long lower shadow closes above the last two candles. This is a buy signal to go long for the daily traders (it is a daily chart). Daily traders may trigger a long entry right after the candle closes. Take Profit level is to be set at the red marked level, and Stop Loss is to be placed below the signal candle’s lower low. Make sure that it offers a 1:1 risk-reward ratio, at least. Let us find out how the trade goes.

It goes well. It may go towards the North further. Nevertheless, traders may either close the whole trade or take partial profit, at least. The bottom line is we may be eying on a pair to take an entry on a daily-H4 chart combination. The H4 timeframe may not offer an entry. However, the daily chart may do. This is how our effort, time never go in vain, but we make most of our invested time and effort.

Categories
Forex Price-Action Strategies

The Better the Risk-Reward, the More the Opportunities

Risk-Reward is an extremely important factor in price action trading. The price action of a chart is related to risk-reward to some extent. In today’s lesson, we are going to reveal an example of that. Despite the daily chart producing a bearish reversal candle, the H4 traders do not get the opportunity to take an entry. However, something interesting happens afterwards. We find that out in a minute.

This is the daily chart. The chart shows that it produces a bearish inside bar, which is a not a strong bearish reversal candle. Nevertheless, a good consolidation and a bearish engulfing candle on the H4 chart may attract the sellers to go short on the pair. The nearest support is not too far. However, if we flip over to the H4 chart, we will be able to find out whether it offers a 1:1 risk-reward or not.

This is the H4 chart. The chart shows that if it starts consolidating now, it may offer 1:1 risk-reward (depending on the breakout candle). Thus, sellers may wait for a consolidation and an H4 bearish engulfing candle to make some green pips.

It does not consolidate but keeps going towards the South. The sellers on the minor charts may have found some short entries earlier. Since we are dealing with the daily-H4 combination, we may not shift our concentration on the minor charts of this pair. Do you notice one thing? Concentrate and try to find an interesting thing about the chart. The interesting fact about the chart is it has made a breakout on the H4 support. It consolidates and seems to have obeyed the breakout level. A bearish engulfing candle may attract the price action sellers to go short. Have a look at the chart below.

Here it is. A bearish engulfing candle breaches the consolidation support. Look at the red marked take profit level. In naked eyes, it offers an excellent risk-reward. As far as the daily-H4 chart combination trading is concerned, the pair may head towards the take profit level with good bearish momentum. Let us find out how the trade goes.

As expected, the price heads towards the downside and hits the take profit with ease.

On the first occasion, the price neither consolidates nor offers an entry. On the second occasion, it consolidates nicely and produces an ideal bearish engulfing candle to offer a short entry with an excellent risk-reward. I am not saying that it never offers an entry on such occasions (first occasion). Risk-reward attracts more traders. Thus, if there is a better risk-reward, most likely, there is more opportunity for traders.

Categories
Forex Price-Action Strategies

Edged Breakout Lessens Momentum and Chance of Winning

In today’s lesson, we are going to demonstrate an example of the daily-H4 combination trade, where the price produces a reversal candle, but it does not make an explicit breakout. The price heads towards the breakout direction after having more consolidation. It often happens. Thus, we need to get familiar with such price action. Let us get started.

Above, we can observe a daily chart. The last daily candle closes well below the last swing low. This is an explicit breakout. Let us now determine the level where the price may find its next support. The chart shows that the price closes within a swing low. However, the swing low one below may come as the next level of support. Have a look at the chart below.

The price may head towards the South and find its support at the red-marked level as far as the daily chart is concerned. The daily-H4 chart combination traders are to flip over to the H4 chart for the price consolidation and bearish breakout to go short on the pair.

The image above corresponds to the H4 chart. The chart produces a bullish corrective candle. If it produces a bearish candle closing below the last swing low, the sellers may trigger a short entry. Let us proceed to the next chart.

The chart produces a bearish engulfing candle. However, look at the breakout. It is not an explicit breakout. If the candle closed below the level of support with a 15%-25% extra red body, it would be an excellent entry. Nevertheless, it is a strong bearish reversal candle (bearish engulfing). A bearish engulfing candle in a bearish market makes a very strong statement that the sellers are in control on the minor charts. Let us find out what happens next.

The chart produces another bearish candle. Look at the last candle. It comes out as a bullish candle with a long upper shadow. The pair still looks bearish, but the bullish corrective candle goes too far up. It may be because of the bearish reversal candle that we have after the first consolidation. If it closed well below the level of support, it would have been bearish with more momentum. Often the price goes towards the opposite direction and hits the stop loss too in such breakout. Let us find out what happens here.

It goes according to the sellers’ expectations and hits the Take Profit. Here is a question. Would you take such entry next time? I would not blame if you say ‘yes.’ Because such trade may have a 55% chance of winning, however, to be very consistent and keep our confidence at the top level, it is better if we skip such entry.

Categories
Forex Daily Topic Forex Price-Action Strategies

Don’t Only Rely on Your Initial Assumption, Dig into It

In today’s article, we are going to demonstrate an example of an entry, which is derived from the daily-H4 chart combination. It is a typical entry once we flip over to the H4 chart. Before flipping over to the H4 chart, there is a good lesson, which may help us in the future. Let us get started.

This is a daily chart. It shows that the price, after having a bounce, heads towards the upside. It finds its resistance and produces a bearish marubozu candle. The combination of the last two candles is also known as track rail. It is a strong bearish signal. Usually, the daily-H4 combination traders may want to flip over to the H4 chart to hunt an entry. However, the level of support seems too adjacent to offer a short entry. In naked eyes, the daily chart shows that there is very little space for the price to travel towards the South. Is it? Let us flip over to the H4 chart and reveal the truth.

This is the H4 chart. It shows that the price is on consolidation, searching for its resistance already. The level of support is far enough to offer some handful of pips to the sellers.

The chart produces a bearish engulfing candle closing below the last swing low. The sellers may trigger a short entry right after the candle closes. Let us not just guess it. Let us measure it by drawing two horizontal lines.

These two lines determine the stop loss and entry-level. The drawn support is far enough to offer excellent risk-reward. If you are not sure, measure it with the tool on the trading platform. The risk-reward is 1:1.5 here. Let us now find out the result.

The price heads towards the level of support and produces a bullish reversal candle as well. The sellers have grabbed some green pips. The consolidation, the signal candle, and the risk-reward are perfect here. Do you remember how it begins, though? The daily chart does not look that appealing at the very outset despite producing an excellent daily bearish reversal candle. In naked eyes, it looks bad. However, once we have flipped over to the H4 chart, it is a different story. It looks very appealing, and in the end, it offers an excellent entry. In the beginning, do not just skip a chart by its outlook. Dig into it. The habit of digging may get you more entries.

Categories
Forex Daily Topic Forex Price-Action Strategies

Do not Mix up, Stick with the Rules

In today’s lesson, we are going to demonstrate an example of an H4 chart offering an entry. The daily-H4 chart combination traders are to keep an eye on the daily chart first. Once the daily chart produces a daily reversal candle from the support/resistance zone, they are to flip over to the H4 chart to take an entry. Today, we are going to do it in another way for a reason. We are going to start monitoring from the H4 chart. Let us start. Soon you will know why I am doing it so.

This is the H4 chart, and the red-marked level is daily support. It shows that the price is at the level of support. The last candle comes out as a bearish candle with a long lower shadow. It suggests that the level may produce a bullish reversal soon.

As expected, the chart produces a bullish engulfing candle right at the level of support. A bullish engulfing candle at a support zone has a strong message to send to the buyers that it is their territory.

The price goes towards the North for one more candle. It then has a correction and produces another bullish engulfing candle closing above the resistance. This is an ideal sequence for the price action traders to take a long entry. Let us assume that we do not trigger an entry here and have a look at the next chart.

The price keeps heading towards the North. It means that we have missed an opportunity to make some green pips here. Everything seems perfect, but why we skip taking the entry. Is it a mistake? Is not it? No, it is not a mistake. We shall not take the entry as far as the daily-H4 chart combination chart is concerned. We have started monitoring the chart from the H4 chart today. The daily-H4 chart combination traders are to monitor from the daily chart. Let us have a look at the Daily chart how it looks before flipping over to the first H4 chart here.

You see that the last daily candle comes out as a bearish one. It closes within a level, which has the potential to hold the price as a level of support. However, it has not produced a bullish reversal candle yet. Thus, they shall not flip over to the H4 chart. This is the reason that the daily-H4 chart combination traders may not take the above entry. The H4-H1 chart combination traders may not get an entry here as well since the level of support is not H4 support. The price does not react to the level on the H4 chart in recent times.  It moves towards the North by obeying other trading methods but not according to the price action chart combination trading.

We must be disciplined and must not mix up one strategy with others but stick with the rules. Sticking with the rules is one of the most important factors to be consistent in trading.

Categories
Forex Daily Topic Forex Price-Action Strategies

Consolidation and Breakout: The Two Key Movements in Price Action Trading

Price action trading mainly relies on consolidation, trend, and breakout. Reversal candle is another feature that traders keep an eye at. Typically, double top/bottom, morning star/evening star, and engulfing candle are considered the strongest reversal signal. However, even an inside bar may create an excellent bullish/bearish momentum if the price consolidates and makes a perfect breakout. In today’s lesson, we are going to demonstrate an example of this.

We are looking at an H4 chart. It shows that the price heads towards the North with extreme bullish momentum. A bearish inside bar followed by another bearish candle makes a reversal. The price after being bearish may have found its support. The buyers are to wait for the price to make a bullish breakout at the level of resistance. The sellers are to wait for consolidation and a bearish breakout at the level of support.

The price starts having a correction. If it keeps going towards the North further, it may get choppy. If it finds its resistance nearby, the sellers may find an opportunity to go short on the pair.

The chart produces a bearish engulfing candle. It means the price finds its resistance. If it makes an H1 breakout at the level of support, the sellers may want to trigger a short entry. Let us now have a look at the same chart with those two levels.

The equation gets much simpler with those two levels. Since this is an H4 chart, the sellers are to flip over to the H1 chart to get a breakout and trigger a short entry. The reversal candle looks strong enough to make the sellers keep an eye on the pair to take a short entry upon a breakout.

This is how the H1 chart looks. The price seems to have found two levels of support here. However, the H4 chart looks very bearish, which may keep driving the price to make a breakout at the level of red marked support.

Here comes the breakout. The candle closes well below the level of support. It has a long lower shadow, but it has a thick bearish body as well. The sellers may trigger a short entry right after the candle closes by setting stop loss above the resistance. Take profit may be set at the last swing low on the H4 chart. Let us proceed to the next chart to find out how the entry goes.

The price heads towards the South with good bearish momentum. It makes another bearish breakout at the last swing low as well. Concisely, the sellers grab some green pips from the entry.

If we concentrate on the first candle of the trend, we see that the candle is a bearish inside bar. An inside bar is considered the weakest reversal signal. However, it produces an excellent short signal here because of perfect consolidation and the breakout. The above example signifies the importance of consolidation and breakout in price action trading.

Categories
Forex Price-Action Strategies

Choppy Daily Chart, H4 Chart Still Offering an Entry

In today’s price-action lesson, I am going to divulge an example of the daily-H4 chart combination offering an entry. Usually, it is best to trade on the daily-H4 chart combination when the price is having a solid trend on the daily chart. However, not all the time the price is going to have a strong trend on the daily chart. The price action may be trapped within zones and still offer an entry.

The daily chart shows that the price has been roaming around within two levels. The last candle comes out as a bearish engulfing candle. The candle forms at the resistance zone. The level of support is not too far away. Let us have a look at the same chart with those two levels.

The chart shows that the price may find its next support at the red marked line. The price had a bounce at the level earlier. As far as the daily chart is concerned, the price does not have enough space to travel towards the South. However, the daily-H4 chart combination traders may have another equation to play with. Let us flip over to the H4 chart and find that out.

The H4 chart shows that the price heads towards the South with extreme bearish pressure. Traders are to wait for consolidation and bearish breakout to go short on the pair. The selling pressure is too high to consolidate though. Then again, the sellers must not give up. Let us find out what happens next.

The price starts having the correction. It may find its resistance nearby and offer a short entry upon a bearish breakout. On the other hand, if the price goes too far towards the North, the risk-reward factor may hold the sellers back to go short.

The price goes towards the North for one more candle and produces an H4 bearish engulfing candle closing below the level of consolidation support. The last candle looks to be a fantastic signal candle and the price still has some room to travel towards the South. Let us have a look at the same chart with consolidation support and resistance.

The equation gets much simpler with those two lines. A short entry may be triggered right after the last candle closes by setting Stop Loss above consolidation resistance. Take Profit may be set at the last swing low or wait until a bullish reversal candle on the H4 chart. Let us find out what the price does after triggering the entry.

The price heads towards the downside with good bearish pressure. The last H4 candle comes out as a bullish Inside Bar. The sellers may want to close the entry here.

We have seen that as long as the daily chart’s support/resistance offers a lucrative risk-reward for the H4 traders, they may be able to find entry occasionally even though the price is not having a strong trend on the daily chart.