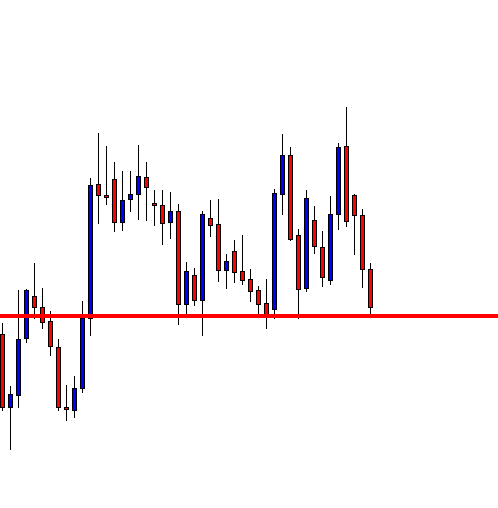
In today’s lesson, we are going to demonstrate an example of an H4 chart offering an entry. The daily-H4 chart combination traders are to keep an eye on the daily chart first. Once the daily chart produces a daily reversal candle from the support/resistance zone, they are to flip over to the H4 chart to take an entry. Today, we are going to do it in another way for a reason. We are going to start monitoring from the H4 chart. Let us start. Soon you will know why I am doing it so.
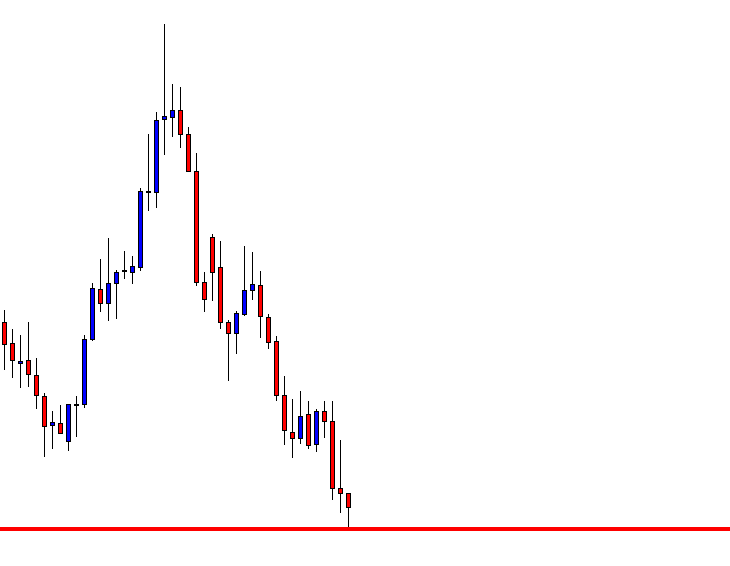
This is the H4 chart, and the red-marked level is daily support. It shows that the price is at the level of support. The last candle comes out as a bearish candle with a long lower shadow. It suggests that the level may produce a bullish reversal soon.
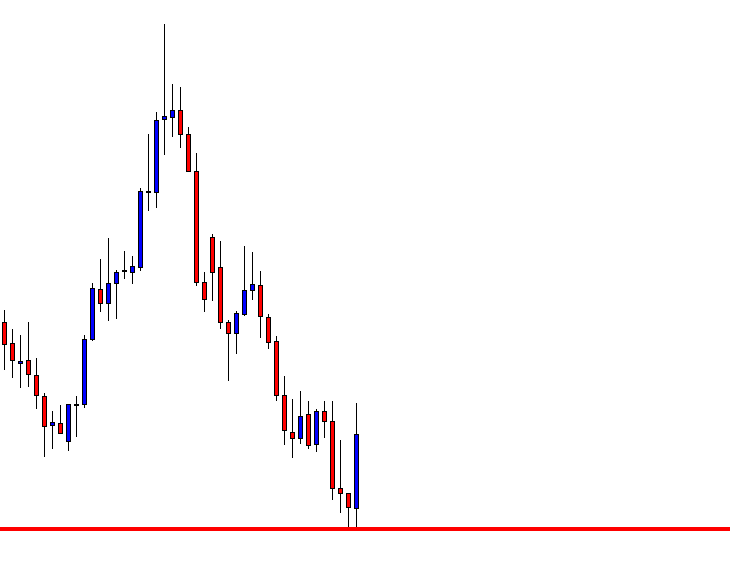
As expected, the chart produces a bullish engulfing candle right at the level of support. A bullish engulfing candle at a support zone has a strong message to send to the buyers that it is their territory.
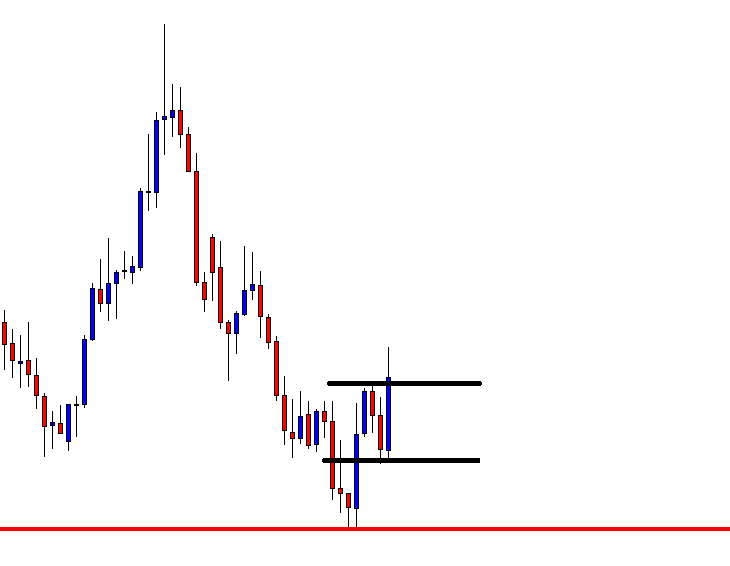
The price goes towards the North for one more candle. It then has a correction and produces another bullish engulfing candle closing above the resistance. This is an ideal sequence for the price action traders to take a long entry. Let us assume that we do not trigger an entry here and have a look at the next chart.
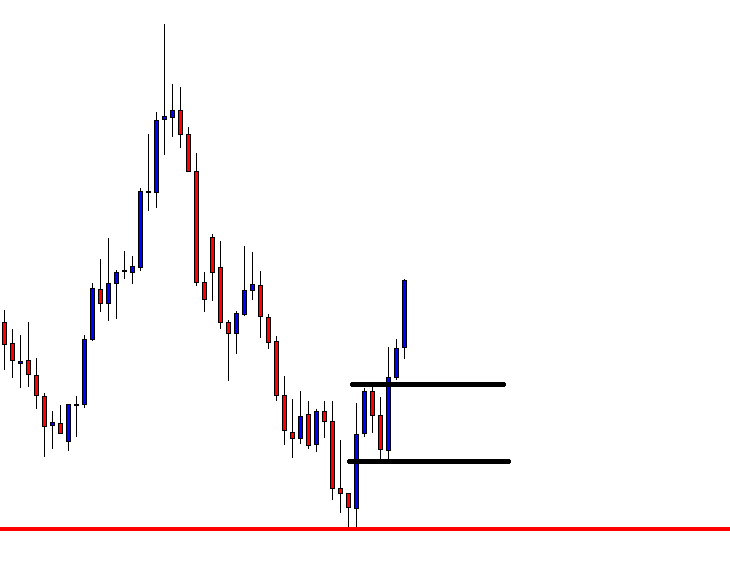
The price keeps heading towards the North. It means that we have missed an opportunity to make some green pips here. Everything seems perfect, but why we skip taking the entry. Is it a mistake? Is not it? No, it is not a mistake. We shall not take the entry as far as the daily-H4 chart combination chart is concerned. We have started monitoring the chart from the H4 chart today. The daily-H4 chart combination traders are to monitor from the daily chart. Let us have a look at the Daily chart how it looks before flipping over to the first H4 chart here.
You see that the last daily candle comes out as a bearish one. It closes within a level, which has the potential to hold the price as a level of support. However, it has not produced a bullish reversal candle yet. Thus, they shall not flip over to the H4 chart. This is the reason that the daily-H4 chart combination traders may not take the above entry. The H4-H1 chart combination traders may not get an entry here as well since the level of support is not H4 support. The price does not react to the level on the H4 chart in recent times. It moves towards the North by obeying other trading methods but not according to the price action chart combination trading.
We must be disciplined and must not mix up one strategy with others but stick with the rules. Sticking with the rules is one of the most important factors to be consistent in trading.


