Categories
Forex Fibonacci

Fibonacci Trading: How Fibonacci Levels Give Clues to the Traders

In today’s Fibonacci lesson, we are going to demonstrate an example of a chart, which makes a bearish move. We dig into the charts and find out how we can take an entry based on Fibonacci levels and how the levels may help us giving clues to execute our plan. Let us get started.

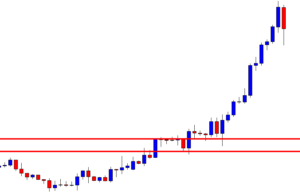
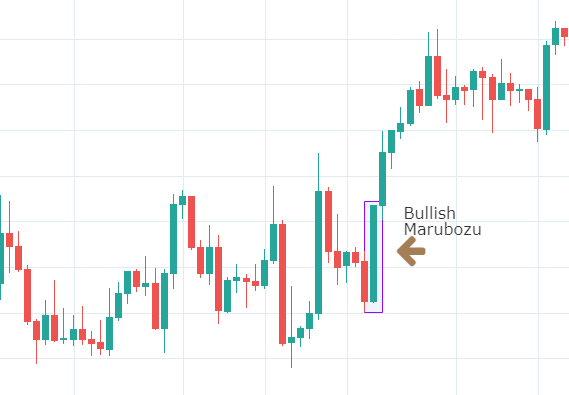
The above figure shows an H1 chart. The chart shows that the price makes a bearish move at a moderate pace. It seems that the price finds its support. It has been having consolidation around the level of support having bounces three times. The last candle in this chart comes out as a bullish Marubozu candle. This may push the price towards the North. However, the sellers may still have the hope that they may get a bearish breakout here. Let us proceed to the next chart to find out what the price does.

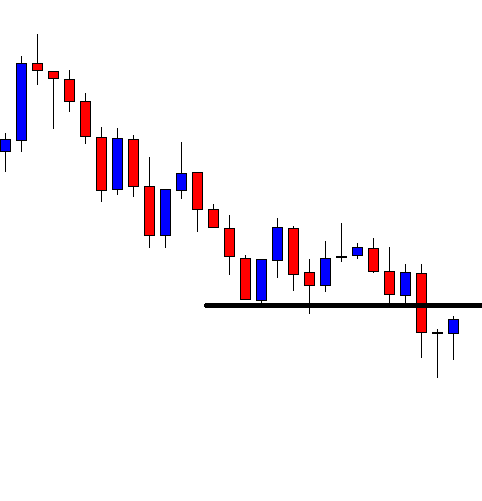
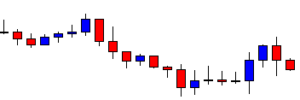
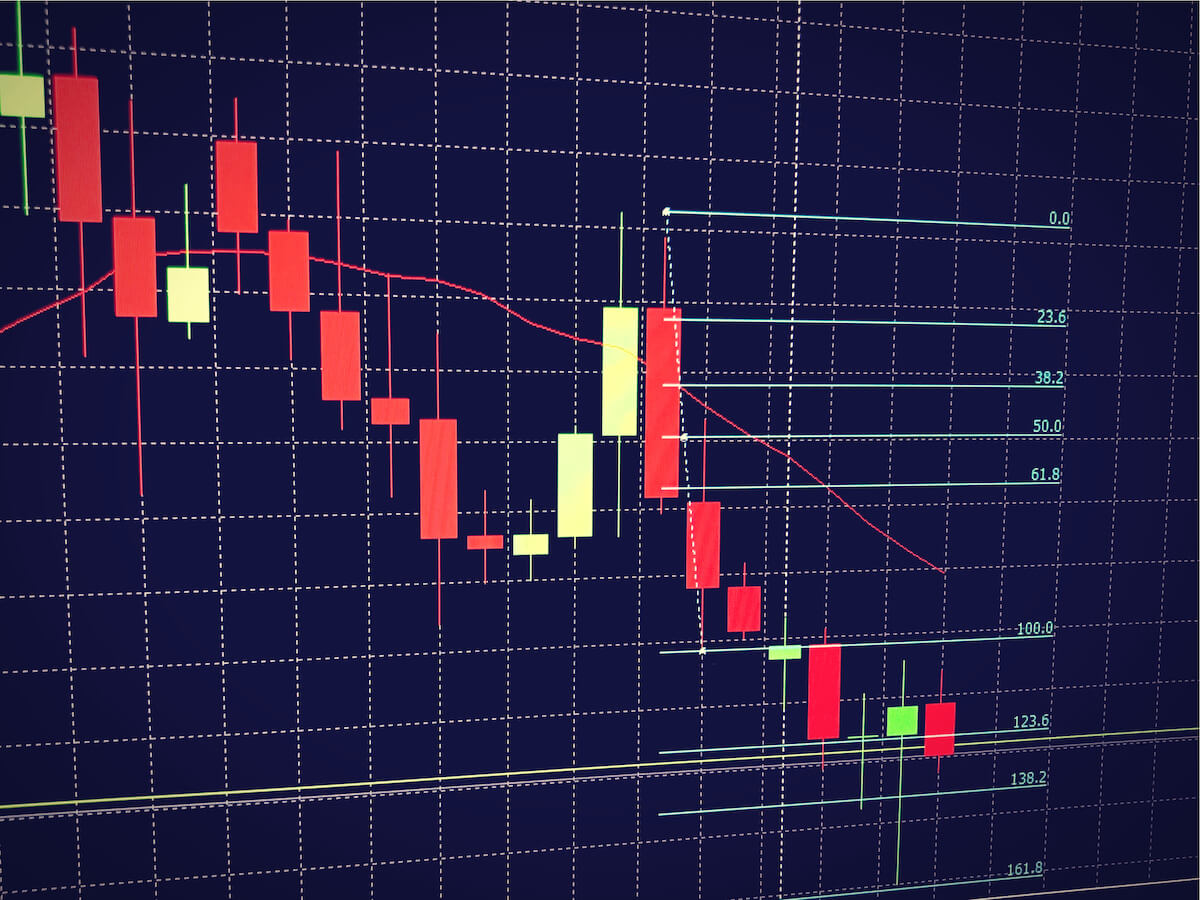
The chart produces a bearish engulfing candle breaching the level of support. The pair trades for two more candles after the breakout. An important point is to be noticed here that the price is having an upside correction after the breakout. Sometimes price keeps trending after a breakout, whereas sometimes price makes the correction. Fibonacci levels have an important role to play in this. Thus, if we use Fibonacci levels, we are able to find out whether the price trends or makes correction well ahead. Let us now find out how we take the entry. We are to flip over to the minor chart. Since this is an H1 chart, we may flip over to the 15 M chart to trigger the entry.

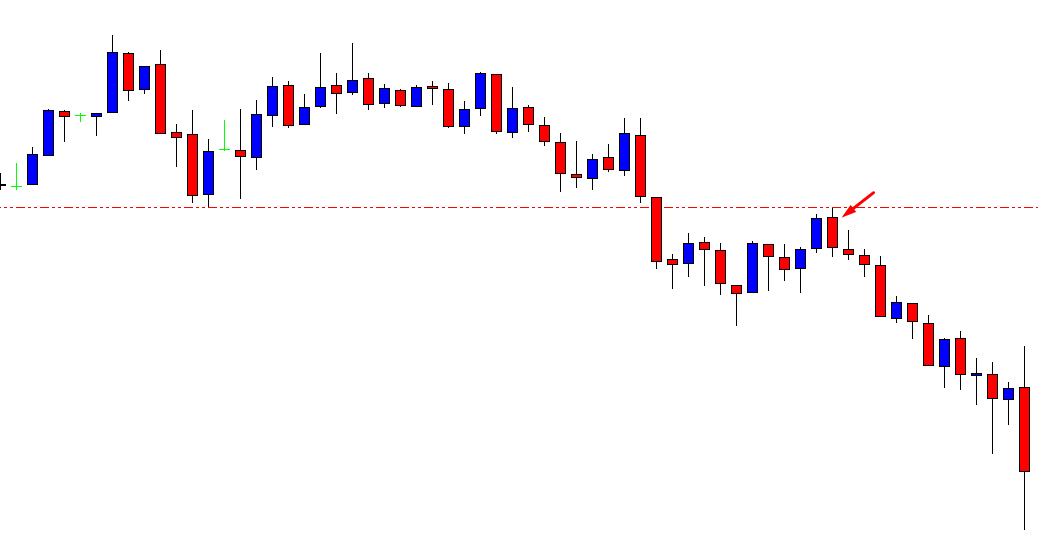
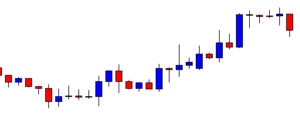
Look at the arrowed candle. The candle comes out as a bearish Marubozu candle forming track rail. The candle is formed right at a flipped resistance. A short entry may be triggered right after the arrowed candle closes. The chart also shows how the price heads towards the South after the signal candle. Let us now see the H1 chart with Fibonacci levels.

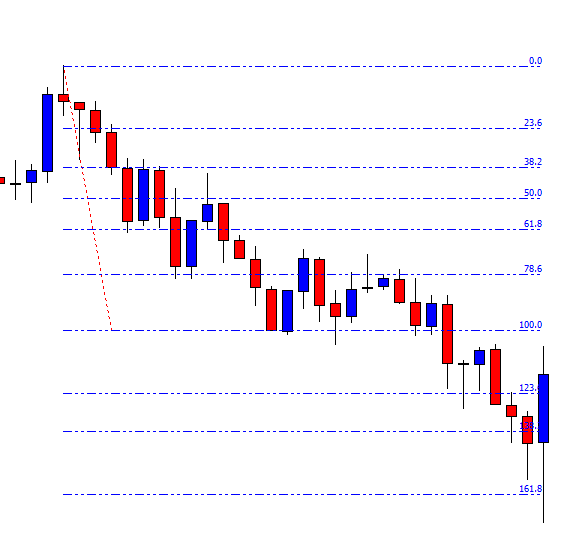
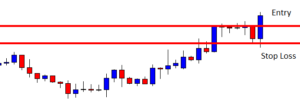
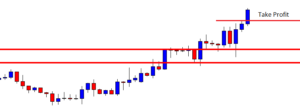
The chart shows that the price trends from 78.6% level. Thus, it may reverse at 138.2%. It hits 161.8% here. However, we may set our target at 138.2% if the price trends from 78.6% to be safe. The Stop Loss may be set here above 100.0 Fibonacci level.

These are the things we must remember when we trade a chart trending from a 78.6% level.

  1. The price may make a reversal at 138.2.
  2. If the price trends from 78.2%, it most probably makes a correction after the breakout. Otherwise, it does not give a good risk-reward as well.


Categories
Forex Daily Topic Forex Price Action

A Business of Glorious Uncertainty

Trading on the daily-H4 chart combination often brings more reward than our initial expectation. Typically, traders aim to earn 1R. However, it may even bring up to 5R. In today’s lesson, we are going to show an example of this.

This is a daily chart. The price heads down with good bearish momentum. The last candle is a spinning top. In a strong bearish daily trend, a spinning top does not suggest that the trend may change. However, the H4-daily traders’ strategy is different. They are to flip over to the H4 chart and wait for consolidation followed by a bullish breakout, to go long on the pair. Let us flip over to the H4 chart.

The H4 chart looks good. The chart produces two bearish candles consecutively. The buyers are to wait for a bullish engulfing candle closing above consolidation resistance to go long. The chart suggests that the buyers shall stick with the chart.

It consolidates more and produces a bullish engulfing candle. However, the candle closes within consolidation resistance. They are to wait for more. Look at the last candle. It seems like it is going to have a deep consolidation again.

This time the chart produces a bullish engulfing candle closing well above consolidation resistance. The buyers could trigger a long entry right after the candle closes and set the stop loss below the signal candle’s lowest low.

The trade does not go as per buyers’ expectations. It takes time to hit the target. However, the candle breaches through the take-profit level, closing as a strong bullish candle. The buyers may consider taking a partial profit and let the rest of the trade run. Let us find out what happens next.

This time the price heads towards the North with extreme bullish pressure. It travels about five times the distance of the buyers’ initial target. Assume, by taking partial profit, how much more a trader can earn. This is the beauty of trading on the daily-H4 combination. Since the daily chart is involved here, the price often heads towards daily support/resistance. This brings traders more profit if they deal with their trade accordingly. Another interesting point here to be noticed, despite producing an excellent bullish engulfing candle, the price does not head towards the North with good bullish momentum. On the other hand, once it hits the target level by producing another bullish Marubozu candle, it keeps going towards the North with extreme bullish momentum. This is why trading may be called a business of glorious uncertainty.


Categories
Forex Course

52. Trading The Single Candlestick Patterns – Part 1 (Continuous Patterns)

Introduction

In the previous article, we have discussed the basics of candlestick patterns. We also understood that there are different candlestick patterns like single, dual, and triple depending on how many candlesticks are involved. We also know that in each of these types, there are continuous and reversal patterns.

In this article, let’s discuss ‘Single Continuous Candlestick Patterns.’ As the name suggests, a single continuous candlestick pattern is formed by just one candle, and the appearance of this pattern indicates that the trend will continue in its actual direction. This means the trading signal generated by this pattern is based on a single candle’s trading action. The trades taken based on a single candlestick pattern can be extremely profitable, provided the pattern has been identified and executed correctly.

Now let’s see an example of one of the most important single continuous candlestick patterns.

The Marubozu Candlestick Pattern

Marubozu is a candlestick with no upper and lower shadow (appearing bald). Essentially, this pattern has a single candle with just the real body, as shown below.

The Marubozu candle can be both bullish and bearish, depending on the major trend. The Marubozu, in an uptrend, suggests that the buying strength of the currency pair is still prevailing in the market, and the trend is supposed to continue. The same is the case if it appears in a downtrend (Bearish Marubozu), which is a sign of trend continuation.

As always, a Red candle represents Bearish Marubozu, and a Green candle represents Bullish Marubozu.

Below is the picture of how the Marubozu pattern looks on a price chart.

A bullish Marubozu indicates that there was so much buying interest in the currency that the market participants were willing to buy the currency at every price point during the day (considering a daily time frame chart). The buying interest is so much that the pair closed near its highest point for the day. So, when such a pattern appears on the chart, it is recommended to build long positions in that Forex pair with appropriate stop-loss and take profit.

The Spinning Top Candlestick Pattern 

The Spinning Top is a very interesting candlestick pattern. Unlike other patterns, the Spinning Top is not specifically a continuous or reversal pattern. It can be indicating both depending on the market condition. A Spinning Top is a candlestick with a small real body and upper & lower wicks being identical in size.

It basically conveys the market indecision as both bulls and bears weren’t able to influence the market. When a trader encounters this pattern in a trending market, he/she needs to be prepared for two situations:

  • Either there will be another round of huge buying or selling
  • Or the markets could reverse significantly in either direction

Below is how the Spinning Top Candlestick pattern appears on a price chart.

During such uncertainty, it is recommended to trade in the options segment of the market to profit from this candlestick pattern.

This was about single candlesticks patterns and their significance. There are many more single candlestick patterns, but we hope you got the gist. We recommend you research and learn as many single patterns as you can on the internet. In the upcoming articles, we will look into some of the reversal single candlestick patterns and how they are different from the continuous patterns we discussed today. Cheers!

[wp_quiz id=”60570″]