Categories
Forex Daily Topic Forex Price Action

Spot the Chart Accordingly before Triggering for an Entry

In today’s lesson, we are going to demonstrate an example of a chart, which may entice traders to take entry more than once. Some traders may get themselves engaged in taking entry. We find out why we price action traders skip taking those entries. Let us get started.

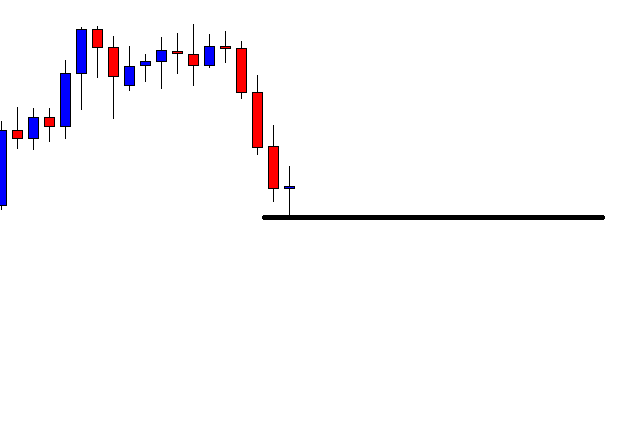
This is an H4 chart. The price makes a strong bearish move by producing three consecutive Marubozu bearish candles. The last candle comes out as a doji candle. The price may consolidate now. The sellers are to wait for a strong bearish reversal candle upon consolidation to go short in the pair. Let us proceed to the next chart.

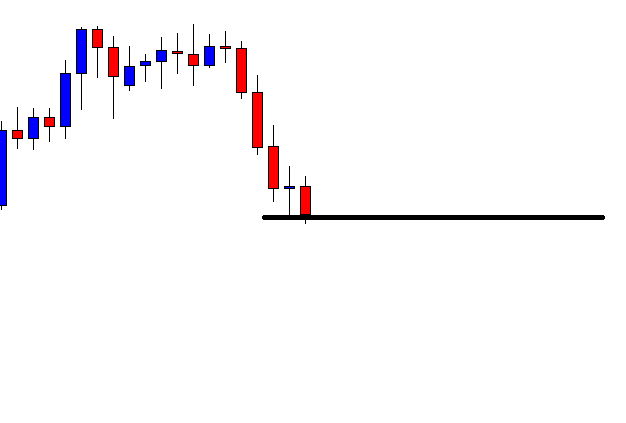
The chart produces a bearish Marubozu candle again. As a reversal candle, it is a strong one. However, the price has not consolidated well. It has produced the bearish reversal candle upon having a shallow consolidation. Moreover, the last candle does not close below the level of support. Thus, the sellers may skip taking the entry but wait for the right time to come. The chart still looks good for the sellers.

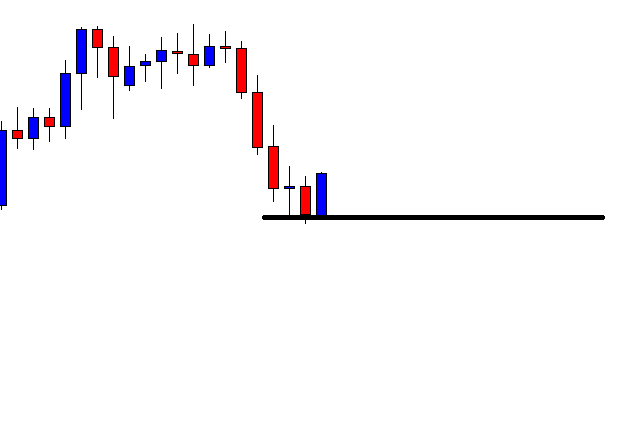
The chart produces a bullish engulfing candle. The price may make a deeper consolidation this time. The sellers may keep their eyes on the chart again to go short in the pair. Let us proceed to the next chart to find out what happens next.

The price makes a deeper consolidation. Upon finding its resistance, it makes a bearish move. It seems that the price may make a breakout here. A question may be raised here whether the sellers on the H4 chart shall take the entry or not? We find out the answer in a minute. Meanwhile, let us proceed to the next chart.

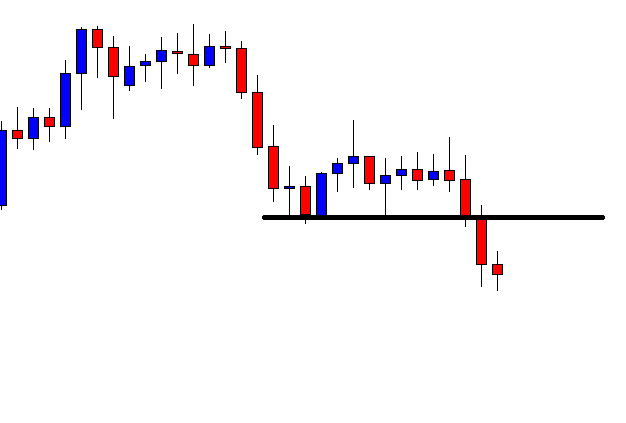
The next H4 candle closes well below the level of support. The pair trades below the breakout level for one more candle as well. However, the sellers on the H4 chart may skip taking the entry. The reason behind that is the chart takes more than six candles (a day) to make the breakout. This level of support is a daily level of support now. Thus, the sellers may take the trading decision as far as the daily chart is concerned. If they take their trading decision by observing the H4 chart, it may not be that fruitful. The risk-reward may not be a good one. It may not end up being a daily breakout, but the price may come back in. Or, the daily chart may produce a bullish corrective candle next day, which makes the price hit the H4 sellers stop loss. Thus, in such cases, they might have to take losses only because the pair belongs to the daily chart. Thus, for better trading, traders shall take a closer look before taking entry on a chart to determine whether it favors their trading chart.

Categories
Forex Course

52. Trading The Single Candlestick Patterns – Part 1 (Continuous Patterns)

Introduction

In the previous article, we have discussed the basics of candlestick patterns. We also understood that there are different candlestick patterns like single, dual, and triple depending on how many candlesticks are involved. We also know that in each of these types, there are continuous and reversal patterns.

In this article, let’s discuss ‘Single Continuous Candlestick Patterns.’ As the name suggests, a single continuous candlestick pattern is formed by just one candle, and the appearance of this pattern indicates that the trend will continue in its actual direction. This means the trading signal generated by this pattern is based on a single candle’s trading action. The trades taken based on a single candlestick pattern can be extremely profitable, provided the pattern has been identified and executed correctly.

Now let’s see an example of one of the most important single continuous candlestick patterns.

The Marubozu Candlestick Pattern

Marubozu is a candlestick with no upper and lower shadow (appearing bald). Essentially, this pattern has a single candle with just the real body, as shown below.

The Marubozu candle can be both bullish and bearish, depending on the major trend. The Marubozu, in an uptrend, suggests that the buying strength of the currency pair is still prevailing in the market, and the trend is supposed to continue. The same is the case if it appears in a downtrend (Bearish Marubozu), which is a sign of trend continuation.

As always, a Red candle represents Bearish Marubozu, and a Green candle represents Bullish Marubozu.

Below is the picture of how the Marubozu pattern looks on a price chart.

A bullish Marubozu indicates that there was so much buying interest in the currency that the market participants were willing to buy the currency at every price point during the day (considering a daily time frame chart). The buying interest is so much that the pair closed near its highest point for the day. So, when such a pattern appears on the chart, it is recommended to build long positions in that Forex pair with appropriate stop-loss and take profit.

The Spinning Top Candlestick Pattern 

The Spinning Top is a very interesting candlestick pattern. Unlike other patterns, the Spinning Top is not specifically a continuous or reversal pattern. It can be indicating both depending on the market condition. A Spinning Top is a candlestick with a small real body and upper & lower wicks being identical in size.

It basically conveys the market indecision as both bulls and bears weren’t able to influence the market. When a trader encounters this pattern in a trending market, he/she needs to be prepared for two situations:

  • Either there will be another round of huge buying or selling
  • Or the markets could reverse significantly in either direction

Below is how the Spinning Top Candlestick pattern appears on a price chart.

During such uncertainty, it is recommended to trade in the options segment of the market to profit from this candlestick pattern.

This was about single candlesticks patterns and their significance. There are many more single candlestick patterns, but we hope you got the gist. We recommend you research and learn as many single patterns as you can on the internet. In the upcoming articles, we will look into some of the reversal single candlestick patterns and how they are different from the continuous patterns we discussed today. Cheers!

[wp_quiz id=”60570″]