Categories
Forex Daily Topic Forex Price Action

Weekly High/Low Offers a Better Reward in the H4 Chart Trading

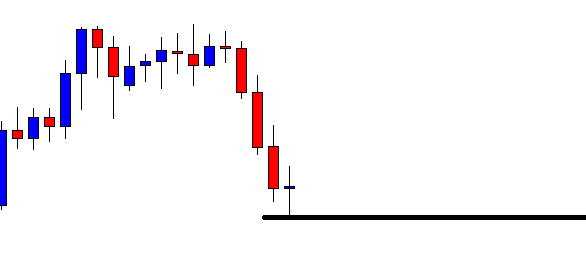
We are going to demonstrate an example of a trade setup on the H4 chart. The price, after breaches the last week’s low; it consolidates and produces a strong bearish reversal candle. It then heads towards the South with extreme bearish momentum. Let us find out how that happens.

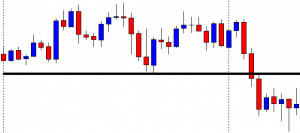
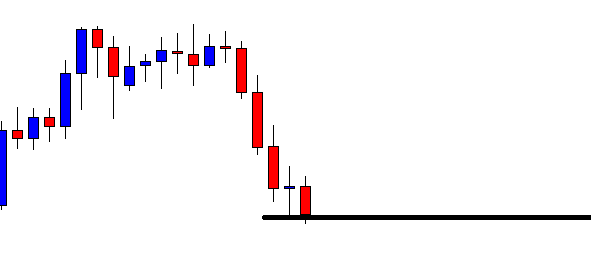
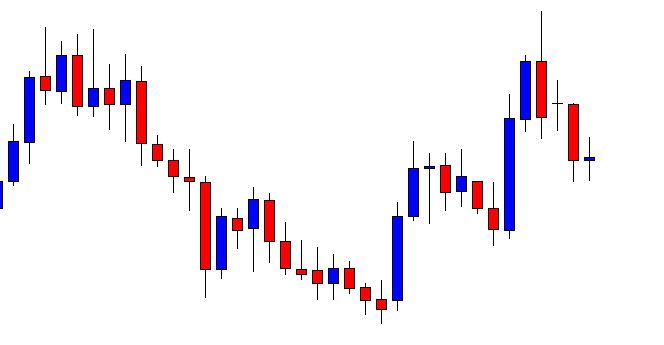
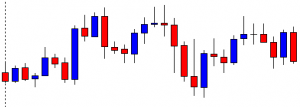
It is an H4 chart. Look at the vertical line on the left. It is the beginning of the week. The chart shows that the price gets trapped within two horizontal levels. The pair is about to finish its trading week. The chart suggests that both the sellers and the buyers are going to keep their eyes on the chart next week to get the breakout and trade.

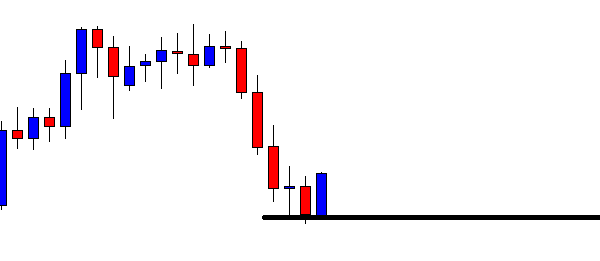
The pair produces two bullish candles consecutively to start its trading week. However, it produces a bearish engulfing candle and drives the price towards the South. Do you see anything here? Yes, the pair makes a breakout at the last week’s low. It means that the Bear may dominate on the H4 chart. Ideally, traders are to wait for the price to consolidate or make a bullish correction followed by a bearish breakout to go short in the pair.

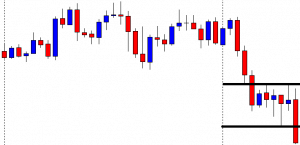
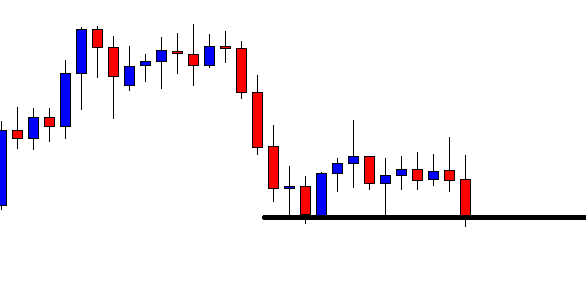
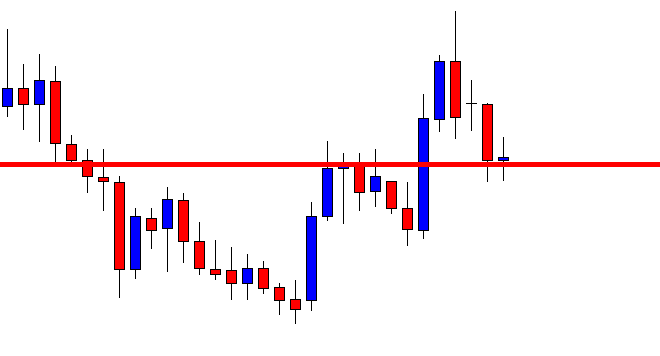
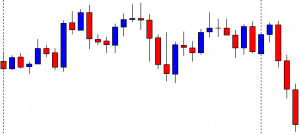
The price consolidates. It produces some bearish reversal candles such as spinning top, hammer, Doji candle. However, it does not make a breakout at the last swing low. The sellers must wait for an H4 candle to close below consolidation support. Let us wait for more and see what the price does.

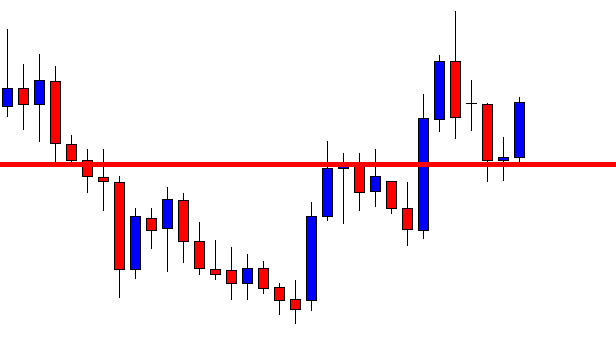
The chart produces a bearish engulfing candle closing well below consolidation support. The sellers may trigger a short entry right after the last candle closes. They may set their stop loss above consolidation resistance and set their take profit with 2R. This is the beauty of using weekly high/low and the H4 chart. It offers an excellent reward. Let us now proceed and find out how the entry goes.

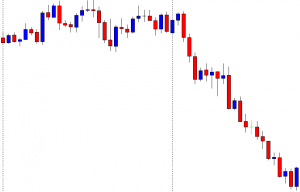
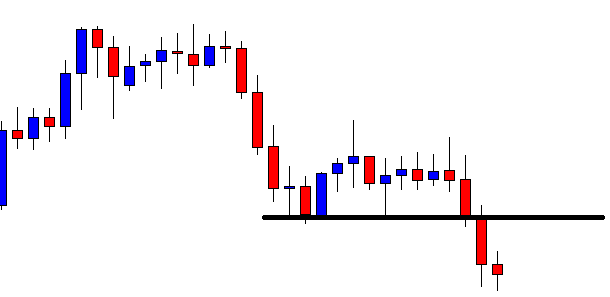
The price heads towards the South with good bearish momentum. It produces three bullish inside bars in this move. The last candle comes out as a bullish engulfing candle. The sellers may consider closing their entry and come out with the profit. If we count, we find that the entry offers more than 2R reward. This is what usually happens when the price makes an H4 breakout at the last week’s high/low. Deep consolidation and a strong reversal candle add more fuel to its journey as usual. In our fore coming lessons, we will learn to integrate Fibonacci levels in this strategy to determine our target with better accuracy. Stay tuned.

Categories
Forex Daily Topic Forex Price Action

Spot the Chart Accordingly before Triggering for an Entry

In today’s lesson, we are going to demonstrate an example of a chart, which may entice traders to take entry more than once. Some traders may get themselves engaged in taking entry. We find out why we price action traders skip taking those entries. Let us get started.

This is an H4 chart. The price makes a strong bearish move by producing three consecutive Marubozu bearish candles. The last candle comes out as a doji candle. The price may consolidate now. The sellers are to wait for a strong bearish reversal candle upon consolidation to go short in the pair. Let us proceed to the next chart.

The chart produces a bearish Marubozu candle again. As a reversal candle, it is a strong one. However, the price has not consolidated well. It has produced the bearish reversal candle upon having a shallow consolidation. Moreover, the last candle does not close below the level of support. Thus, the sellers may skip taking the entry but wait for the right time to come. The chart still looks good for the sellers.

The chart produces a bullish engulfing candle. The price may make a deeper consolidation this time. The sellers may keep their eyes on the chart again to go short in the pair. Let us proceed to the next chart to find out what happens next.

The price makes a deeper consolidation. Upon finding its resistance, it makes a bearish move. It seems that the price may make a breakout here. A question may be raised here whether the sellers on the H4 chart shall take the entry or not? We find out the answer in a minute. Meanwhile, let us proceed to the next chart.

The next H4 candle closes well below the level of support. The pair trades below the breakout level for one more candle as well. However, the sellers on the H4 chart may skip taking the entry. The reason behind that is the chart takes more than six candles (a day) to make the breakout. This level of support is a daily level of support now. Thus, the sellers may take the trading decision as far as the daily chart is concerned. If they take their trading decision by observing the H4 chart, it may not be that fruitful. The risk-reward may not be a good one. It may not end up being a daily breakout, but the price may come back in. Or, the daily chart may produce a bullish corrective candle next day, which makes the price hit the H4 sellers stop loss. Thus, in such cases, they might have to take losses only because the pair belongs to the daily chart. Thus, for better trading, traders shall take a closer look before taking entry on a chart to determine whether it favors their trading chart.

Categories
Forex Basic Strategies

Pairing The ‘Gravestone Doji’ Pattern With Significant Resistance Levels

Introduction

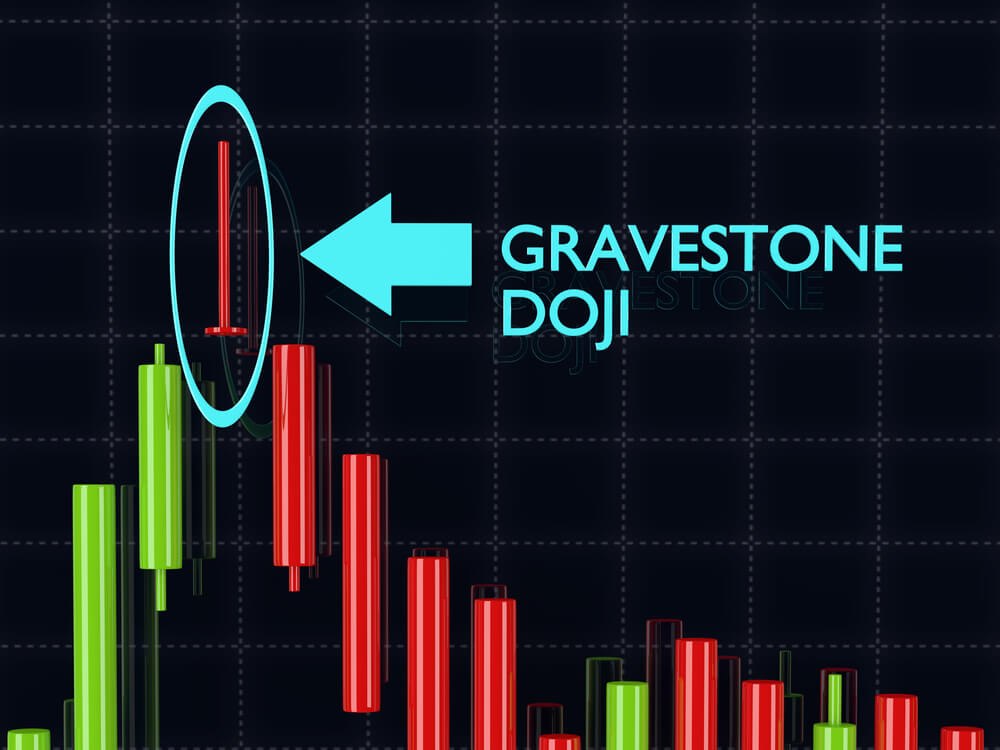
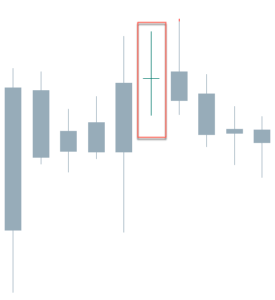
Gravestone Doji is a bearish reversal candlestick pattern that occurs at the top of an uptrend. This pattern helps the traders to visually see where the significant resistance level is located on the price chart. The most important aspect of the Gravestone Doji pattern is its long upper shadow. The candlestick’s open, close, and low are all the same in this pattern.

The psychology behind the long upper shadow is this – In an ongoing uptrend, when the price action hits the significant resistance line, buyers exit their positions, and the price action is smacked down by the sellers. In short, the appearance of this pattern represents the losing momentum of the buyers and essentially indicates a bearish reversal in the market.

Most of the traders place their trades as soon as this pattern appears on the price chart. But that’s definitely not the right approach. Instead, we must wait for the next candle to close for the confirmation and only then take the trades. The opposite of the Gravestone Doji is the Dragonfly Doji, which appears at the bottom of a downtrend or the major support area. The below image represents the Gravestone Doji Pattern.

Trading Strategies – Gravestone Doji Pattern   

The Gravestone Doji pattern indicates that the buying trend is ending, and the market is reversing to the selling side. However, this doesn’t hold true all the time. We will be finding this pattern quite often in all the types of market conditions, and if we start trading every time we find them, we will end up on the losing side. We always need to ask our self the reason why this pattern appears in certain conditions. Is it going to reverse the market or not?

Pairing the pattern with a significant resistance level

If you find this pattern at the bottom of the range, do not trade it. But if the price action prints this pattern at the top of a range, it can be considered a sign for us to go short. Similarly, find the trending markets and look for a major resistance level where the price could possibly react. So when the price action prints a Gravestone Doji at the major resistance level, it’s a strong sign for us to go short.

In the below USD/CHF Forex chart, we can see that the price action has printed the Gravestone Doji pattern at the significant resistance level. We should be going short as soon as the Doji candle closes.

In the below image, we can see that we took a sell entry when the market printed the Gravestone Doji pattern. We have placed the stop-loss just above the resistance level. It is safer to put the stop-loss above the pattern or at the resistance line because if the price goes above the pattern, the pattern gets invalidated. We know that the Gravestone pattern indicates a market reversal, and most of the time, these reversals travel quite far. That is the reason why we go for deeper Take Profits.
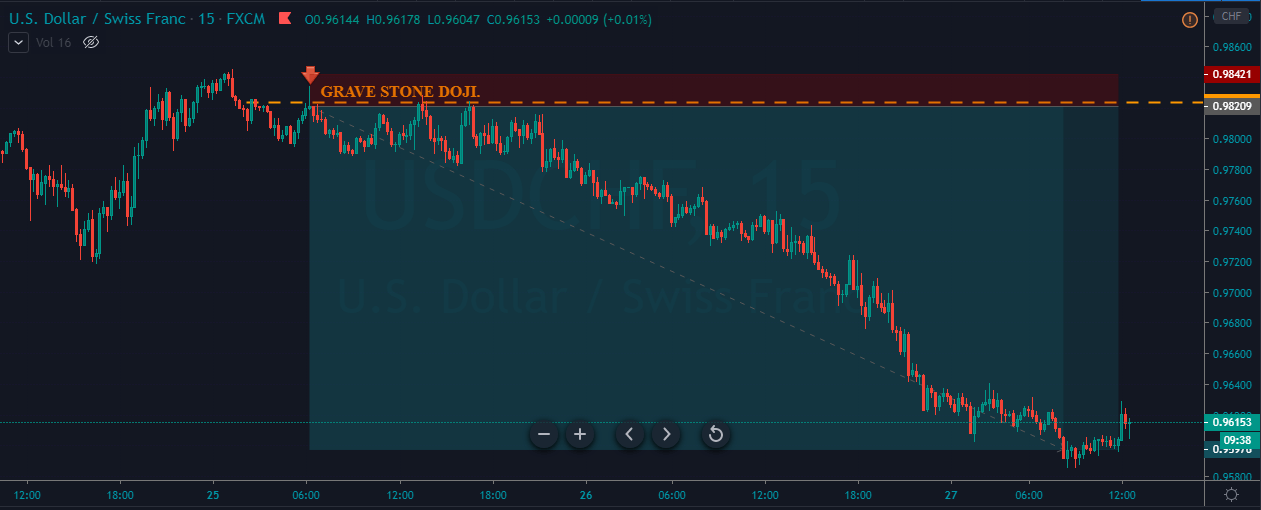
In the above chart, we can see that we had exited our full positions when strong buyers showed up. This indicates that the sellers are losing their momentum, and there is no logic to continue holding our positions.

Gravestone Doji + Stochastic Oscillator

The strategy that we shared above is for aggressive traders who like to take risks. However, if you are A type of trader who needs more confirmation to pull the trigger, we suggest you follow this strategy to trade this pattern. Most of the conservative traders do have a fear in their minds that one single candle does not have the potential to reverse the market. And it is completely okay to think like that. The truth is that sometimes even a single candle can move the market, and sometimes it doesn’t. Ultimately it is your money management system that makes all the difference.

But to filter out some poor signals and to get an additional confirmation, it is advisable to use the Stochastic oscillator to confirm the probability of our trading signal. Stochastic is a range-bound indicator that oscillates between the 0 & 100 levels. When the Stochastic goes above the 70 level, it means that the market is in an overbought condition, and we can expect a change in the trend. Likewise, when it goes below the 30 levels, it means that the market is oversold are we can expect a reversal anytime soon.

The Stochastic indicator also shows the bearish and bullish divergence, which helps the traders in trading the upcoming reversals. The divergence is when the market moves in one direction, but the indicator is signaling a different direction. Now we believe that you understand the basics of trading with the Stochastic indicator. Now let’s dive into the strategy.

The strategy here we are using is simple and straight forward. First of all, identify the Gravestone Doji pattern at a significant resistance level in an uptrend. Then, apply the Stochastic indicator to the price chart and check if the indicator is at the overbought area, indicating a downside reversal. If yes, go short and place the Stop-Loss just above the pattern.

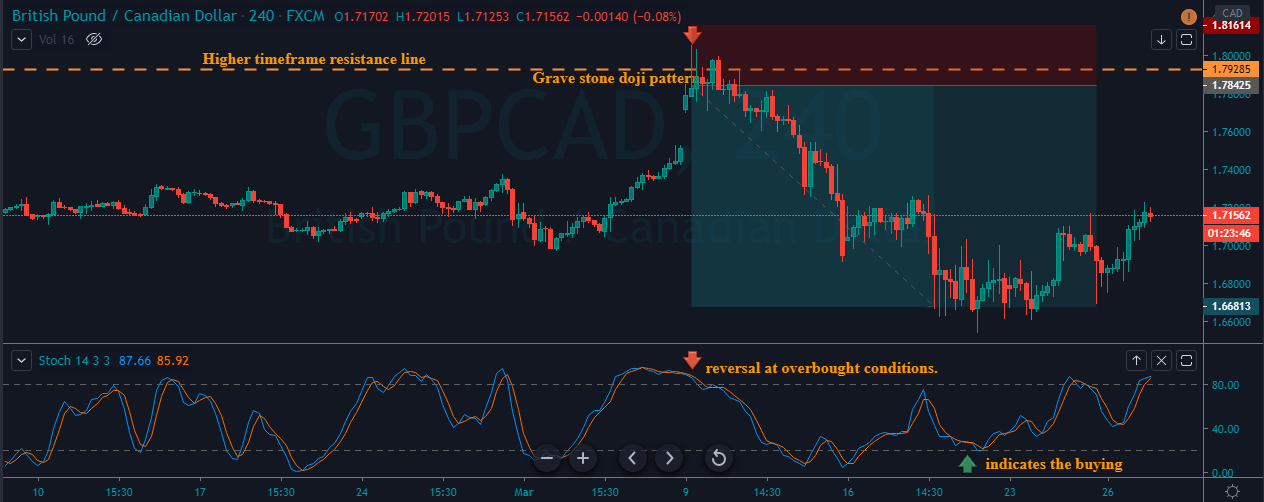
The GBP/CAD chart below indicates the appearance of the Gravestone Doji pattern in an uptrend. When the price is approaching the upper resistance level, it got smacked down immediately, and the market ended up printing the pattern. The next six candles tried very hard to break the pattern & resistance line, but nothing worked, and the price ended up rolling down. We can also observe the Stochastic indicator was at the overbought area, which is a confirmation sign for us to go short.
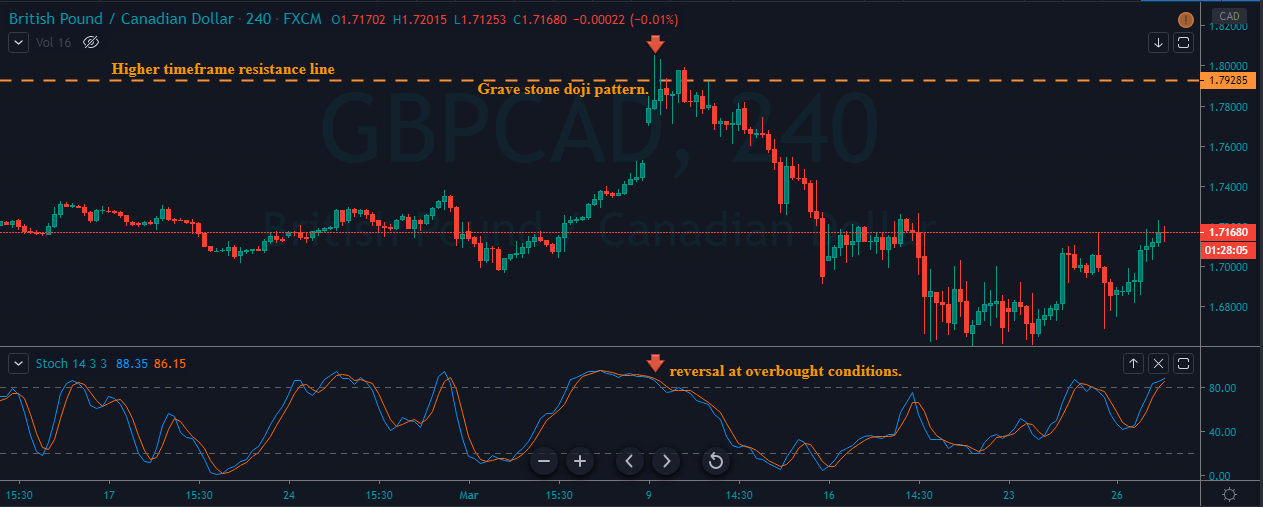
We have entered for a sell when both the conditions are met, and placed the Stop-Loss just above the pattern. For the Take-Profit, we choose to go for deeper targets. When the selling trend started to struggle, the Stochastic indicator was at the oversold selling conditions. At that point, we have closed our full positions for obvious reasons.
Conclusion

The trades taken based on the Gravestone Doji pattern are pretty reliable. But do not make the mistake of identifying the pattern everywhere on the price chart. The psychology behind this pattern says that the bulls drove the price to a peak point, and the sellers are comfortable in reversing the market. For booking profits, you can expect an equal move to that of a previous trend. If you are an intraday trader, make sure to exit your positions at any significant level. Although this pattern appears on all the timeframes, the reliability is higher on higher timeframes to that of lower timeframes.

We hope you find this article informative. Try trading this pattern on a demo account and master it before applying the above-mentioned strategies on the live market. Cheers.
Categories
Forex Course

51. Fundamentals Of Candlestick Patterns

Introduction

In the previous course lessons, we have discussed the basics of candlesticks along with the pros and cons of using them. From this lesson, we will learn the basic candlestick patterns and their usage. As discussed, the idea of candlesticks charts has started in Japan in the late 1870s. These charts were then introduced to the outside world by Steve Nison through his first book, ‘Japanese Candlestick Charting Technique.’

In this lesson, let’s discuss the primary advantage of using candlestick charts. Although a single candlestick gives us many details about the price movement of an asset, a sequential set of candlesticks is more powerful. These sets are also known as patterns in simple trading language, and using these patterns, traders across the world take trading decisions.

Expert traders have decoded many such patterns and rigorously backtested them to analyze what those patterns will eventually result in. They also examined how the market direction will change after the appearance of these patterns on the charts. Now, let’s see the different candlestick patterns one must know.

Different types of candlestick patterns

There are single, dual, and triple candlestick patterns depending on how many candlesticks are involved in them. For example, if there are the candlestick pattern is formed by three candlesticks, it is known as the triple candlestick pattern. Every single pattern has its own significance and can be found in most of the Forex charts.

The main intention of identifying any candlestick pattern is to understand the further price movement in the market. Hence these patterns are classified into two different types – Continuation Patterns & Reversal Patterns. When we identify a continuation candlestick pattern on the chart, it means that the market will continue in the same direction as the underlying trend. Contrarily, if we identify a reversal pattern on the charts, we can expect the price to change its direction. Also, these patterns are internally classified as bullish and bearish continuous/reversal patterns, which will be discussed in the upcoming lessons.

Examples of Continuation Candlestick Patterns

  • Deliberation Pattern
  • Concealing Baby Swallow Pattern
  • Rising Three Methods Pattern
  • Separating Lines Pattern
  • Doji Star Pattern

Examples of Reversal Candlestick Patterns  

Some of these are single candlestick patterns, while some are multiple candlestick patterns. We shall be discussing each of these patterns in detail in our future articles.

Psychological context of candlestick patterns

The candlestick patterns demonstrate the psychological trading that takes place during the period represented by a single or multiple candles. We need to start imagining the price movement as a battle between buyers and sellers. Typically, Buyers expect that prices will increase and drive the price up through their trades. Whereas sellers bet on falling prices and push the price down with their selling interest.
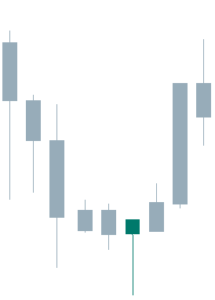
Also, the Japanese gave very visual names to these patterns so that it impacts the mentality of a trader. For instance, pattern names like Hanging Man and Dark Cloud Cover represent negativity, while the patterns like Three White Soldiers and Morning Star indicate positive market results. Hence, as soon as we hear the names of these patterns, our sub-conscious memory will know whether the forecast of the market is positive or negative.

Benefits of trading candlestick patterns

Although initially conceived for daily timeframes, Candlestick patterns can be used by swing traders, day traders, and even long term investors. Below are some of the significant advantages of these patterns.
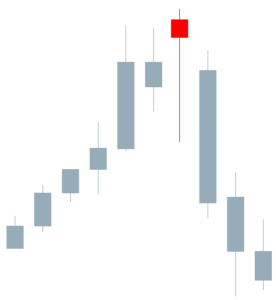
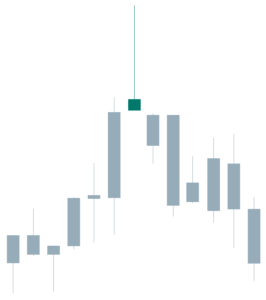
  • They are very easy to identify and comprehend. They provide a detailed description of the occurrences and happenings in the markets.
  • Interaction between the buyers and sellers can easily be understood just by reading the pattern and without having to analyze the market entirely.
  • Candlestick patterns can be used in conjunction with other indicators for extra confirmation on the trading signals generated.
  • They display reversal patterns that cannot be seen in other charts like Line & Bar charts.

That’s about the introduction to Candlestick patterns. In our upcoming lessons, we will discuss different candlestick patterns and how to generate trading signals using these patterns. So, stay tuned.

[wp_quiz id=”60271″]
Categories
Forex Price-Action Strategies

Trading the ABC Pattern

In today’s lesson, we are going to demonstrate an example of an ABC pattern trading on a daily chart. The ABC pattern is one of the most consistent trading patterns in the financial market. It offers an excellent risk-reward as well as a high winning percentage. Let us get started.

This is a daily chart. The price after being bullish makes a bearish move. The last candle comes out as a doji candle. This is a bullish reversal candle, which is not a strong one. However, look at the level where the price produces the doji candle.

It is a flipped level of support. Technically, the buyers are to wait for a bullish reversal candle to go long around this level. Since this is not a strong bullish reversal candle, the buyers might as well wait for a bullish engulfing candle to go long from here.

Here it comes. This is a bullish engulfing candle closing above the last bearish candle. This means it produces a morning star. The buyers may trigger a long entry right after the last candle closes. This point is known as point C in the ABC chart pattern. Traders shall set their stop loss below the level of support. With take profit, they are to be tricky. The last swing high (or low) often becomes a big factor. Thus, buyers may consider taking a partial profit. Have a look at the chart below.

The price often roams around and even makes a reversal at this point. This point is known as point B. If we take out the 50% profit around this level and let the rest of it run, we give ourselves a chance to win more pips without any risk. If the price produces an ABC pattern, in 70% cases, it makes a new higher high or lower low. Let us find out what happens here.

The price makes a breakout. We have taken out some of our profits. Now, we may consider using a trailing stop setting below the last candle (breakout candle). We must be patient and hold the trade until the price produces a strong bearish reversal candle.

The price heads towards the North with good bullish momentum, and then it produces a bearish reversal candle. It may still head towards the North if it makes a bullish breakout after consolidation. Meanwhile, we may come out with the rest of the trade.

The price pattern is produced in almost all the pairs and in all time frames. It is one of the most common price patterns, which is favorite among the financial traders. To be able to trade and make money out of it, we need to have a lot of back-testing and practice.

Categories
Candlestick patterns Forex Daily Topic

Candlestick Trading Patterns III – The Doji, The Most Critical Candle

The Doji

The Doji is a special candle, not only because of its striking appearance but also because it is one of the most vital signals in trading. This figure is so important that we need to understand it very well, as it is one of the safest trading signals when properly applied.

Fig 1 – A Doji on a chart

The Doji is characterized by having the open and close at the same level while standing out for its elongated upper and lower shadows. The figure of the Doji has a precise meaning. Buyers and sellers are in a state of mental indecision. The Doji is a powerful sign of trend change. The probability of a turn increases if in addition to the Doji:

  1. The next candles confirm the Doji’s signal
  2. The market is overextended
  3. The chart does not have many Doji.

The perfect Doji has the same open and close values. Nevertheless, if both levels are separated a few pips, and the candle can still be seen as a single line, it can be considered as Doji.

The Doji is a powerful signal to detect market tops. Steve Nison says that a dog is a sign of indecision by buyers, and an upward trend cannot be sustained by undecided traders. Nison also points out that, from his experience, the Doji loses some reversal potential during downtrends. That observation may apply to the stock market but is useless in pairs trading, as they are symmetric. In this case, a bullish trend of a pair is a bearish pare on the inverse pair and vice-versa. So a Doji will always have a similar meaning: The trend is compromised.  When trading commodities, indices, or stock ETFs the trader should take this into account, though.

In view that a Doji is such a powerful signal, it is better to act upon it. Better to attend a false signal than ignore a real one. Therefore, dojis are signals to close positions, since a Doji alone does not mean a price reversal.

The Northern Doji

The northern Doji is called a Doji that shows up during a rally. According to Mr. Nisson, ” The Japanese say that with a Doji after a tall white candle, or a Doji in an overbought environment, that the market is “tired.” Therefore, as said, a Doji does not mean immediate market reversal. It shows the trend is vulnerable.


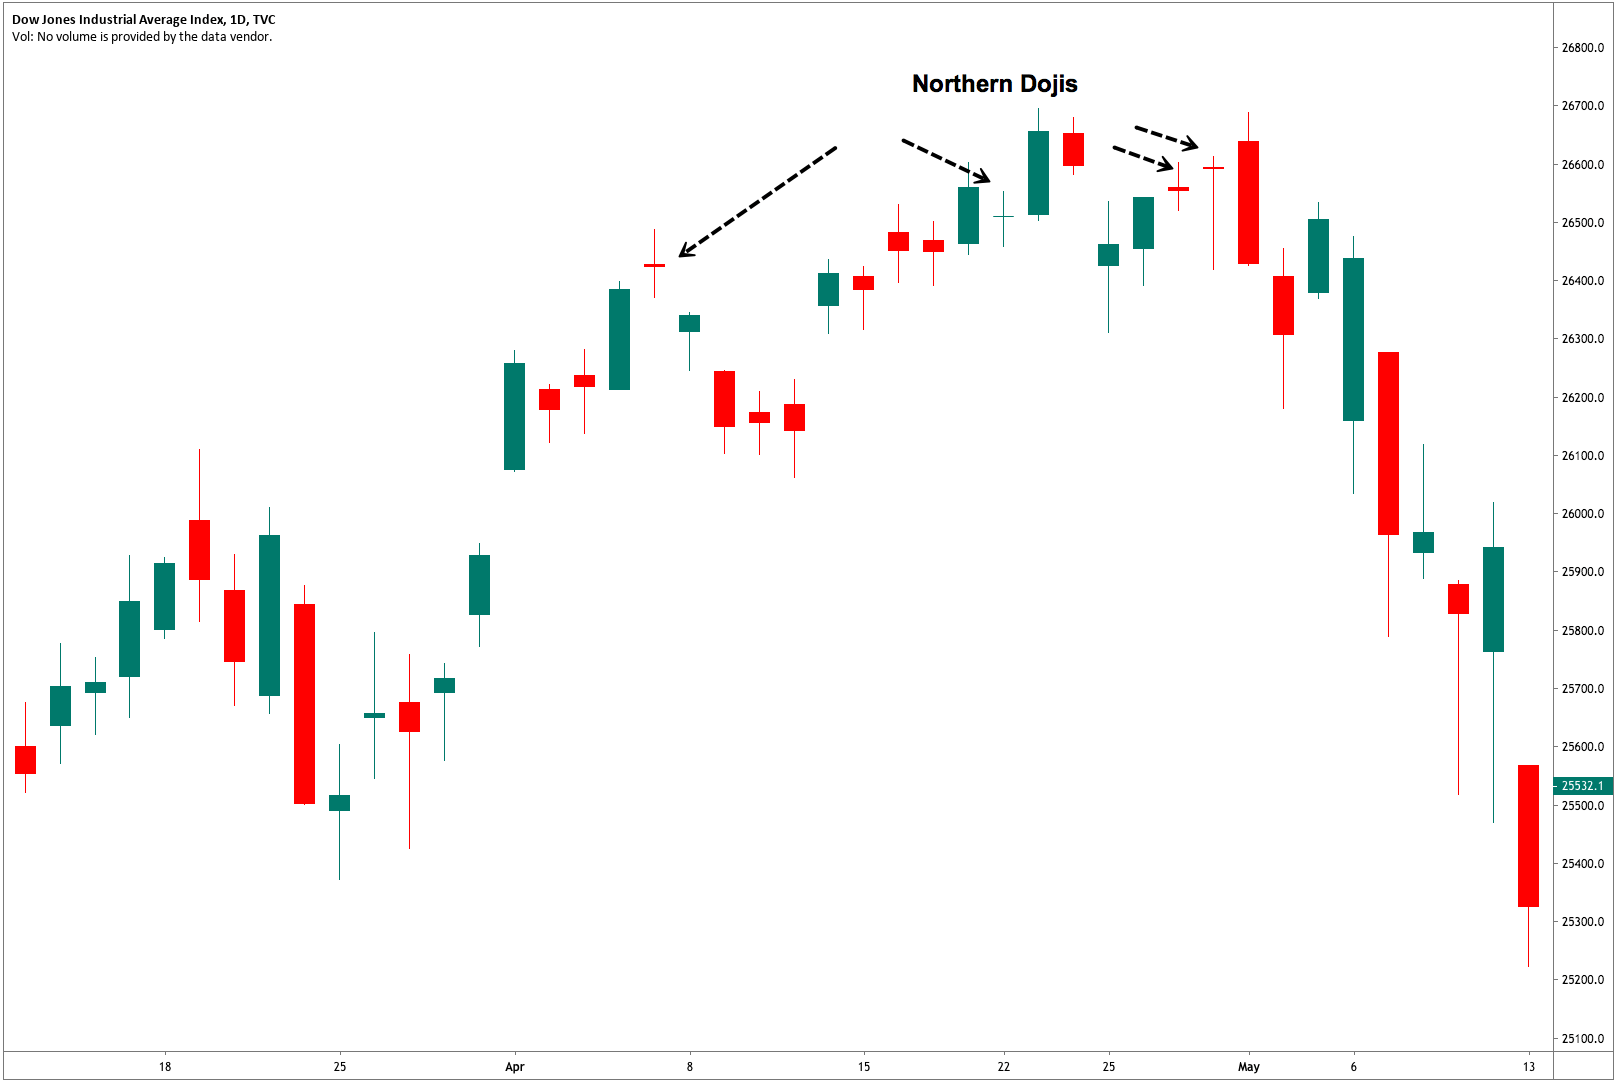
FIg 2 – Down Jones Industrial Average showing northern Doji.

As we can see in the chart above, a Doji after a large candle, as in the first case, is followed by a gap and a drop to the base of a previous candle that surged after a gap.  The next Doji we see was an inside bar that just acted as a retracement and continuation. In the third case, we can see two Dojis, the second being a kind of hanging man with no head. In this case, we notice that the third bearish candle is the right confirmation of the trend reversal. It is not uncommon to observe tops depicting several small bodies, one of which is a Doji.

The Long-legged Doji

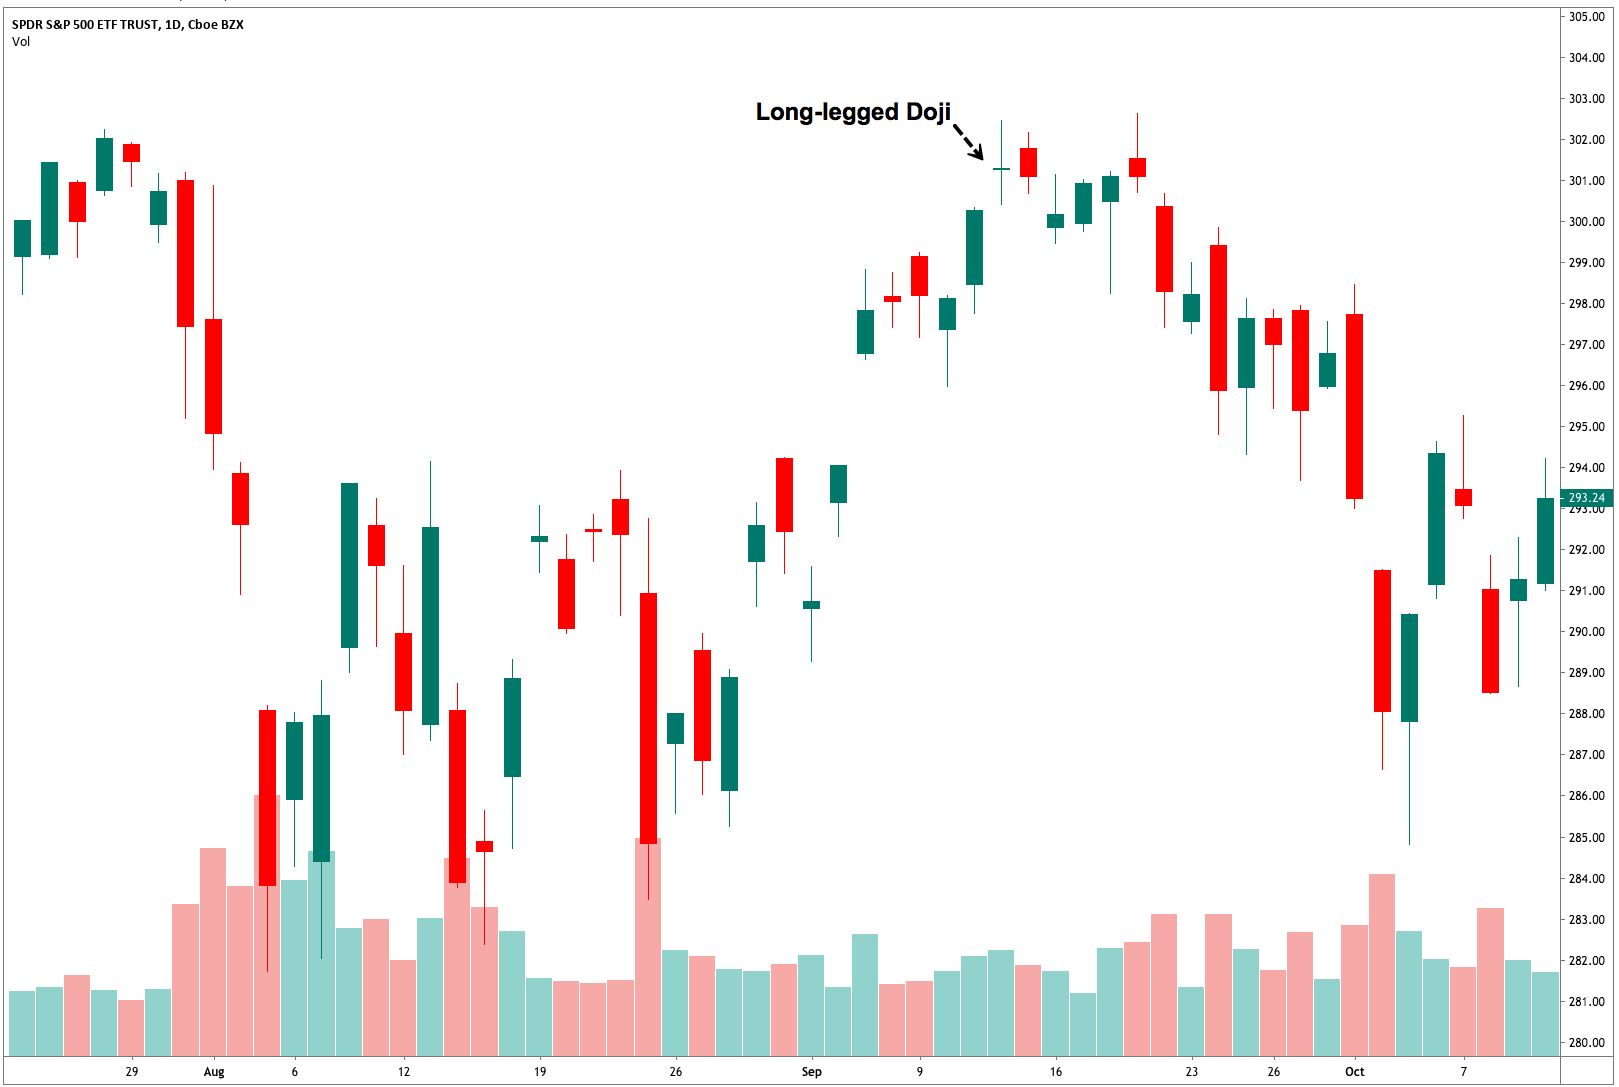
Fig 3 – Long-legged Doji in a SPY Daily chart.

We already know that a small body and long upper and lower shadows is called a high wave candle. If the figure doesn’t have a body is called “long-legged Doji,” and also called “rickshaw man.” As it happens with high-wave candles, it reflects great confusion and indecision.

Gravestone Doji

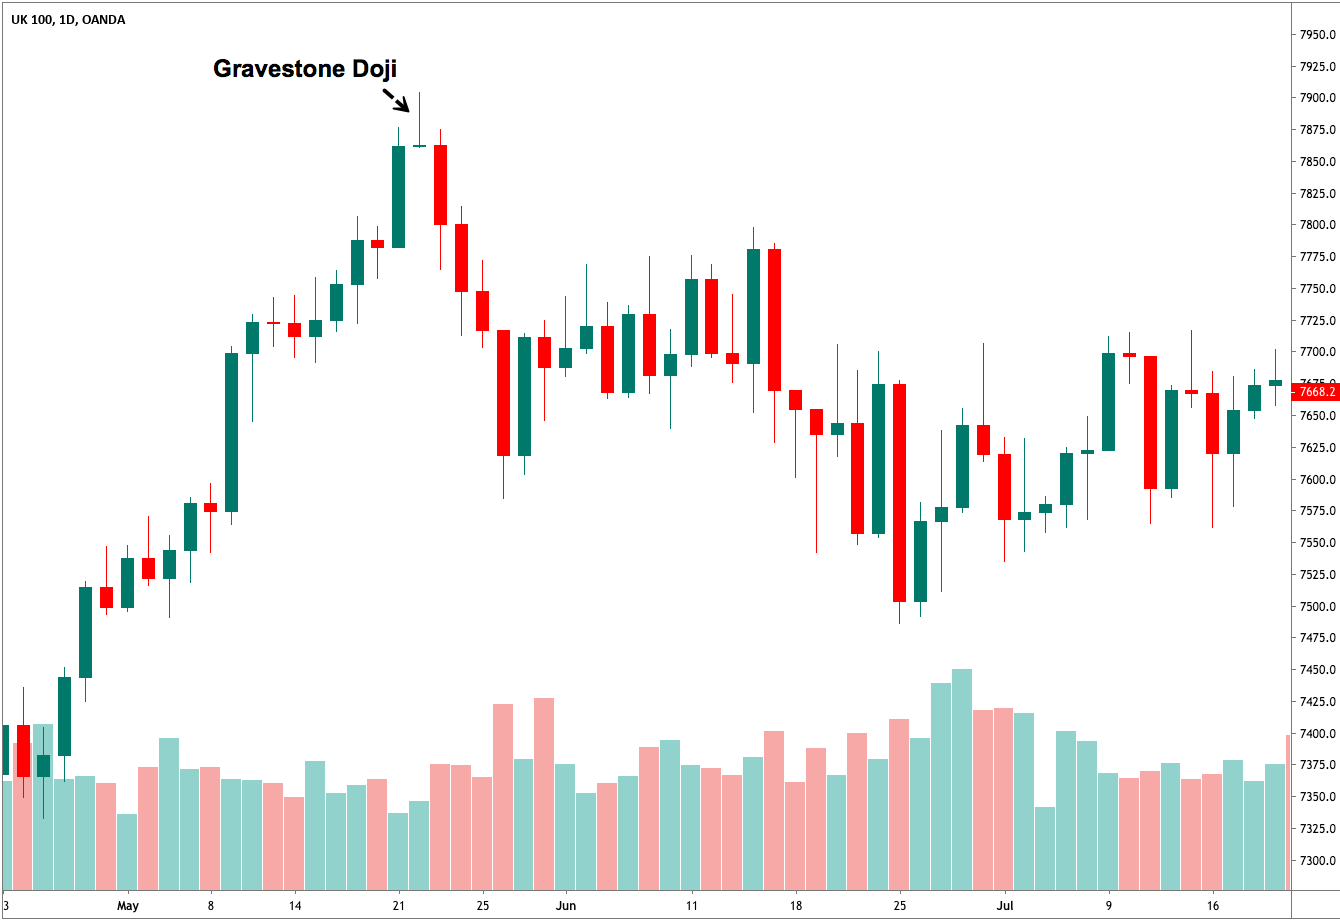
The gravestone Doji is the Doji that begins and ends at the low of the day. According to Stephen Bigalow, the Japanese name is set to represent “those who died in the battle.” Gravestone Dojis are a rarity.

Fig 4 – Long-legged Doji in the UK-100 Daily chart.


Dragonfly Doji

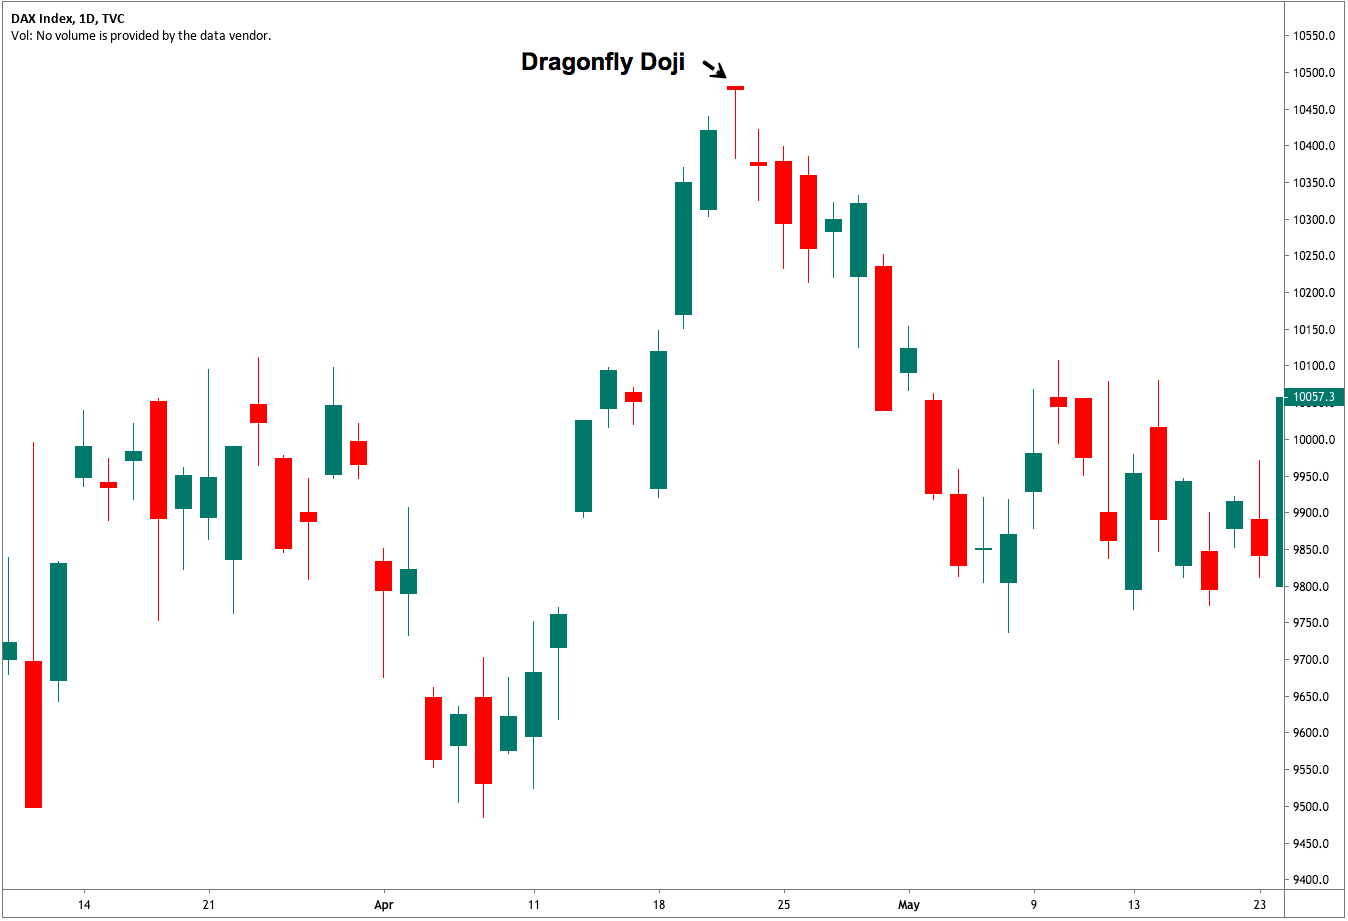
The Dragonfly Doji occurs when the price moves down since the open, and then it comes back and closes at the open. When it happens after an uptrend is a variant of a hanging man.

Fig 5 – Long-legged Doji in the DAX-30 Daily chart.

Conclusions

Dojis are important figures that warn trend reversals, especially if it happens at support or resistance levels.

Dojis need confirmation for trend reversals. When that happens, they create morning star and evening star formations. They also are followed by other small bodies, creating a flat top or bottom.

A safe precaution when encountering these figures while a trade is active is to close or reduce the position or, alternatively, tight the stops.


Sources:

Japanese Candlestick Charting Techniques, Second Edition, Steve Nison

Stephen Bigalow, Profitable Candlestick Signals


Categories
Candlestick patterns Forex Daily Topic

Candlestick Trading Patterns II – Everything you need to know about Single Candlestick Signals

This article is to be dedicated to single candlestick key figures. The majority of patterns are created by more than one candle, but some particular candlestick shapes are key figures to gauge the market sentiment and spot reversals.

In every one of them we will deal with the following aspects:

  • Identification of the candlestick
  • Marker psychology interpretation
  • Criteria and use

Key Single Candlestick Figures:

  • Doji
  • Spinning top
  • High Wave Candlestick
  • Hammer
  • Hanging man
  • Shooting star

The Japanese traders call the real body “the essence of the price action.” A scientist might call it the Signal part of the message, while the shadows are the nose of the market. The relation between the body and the shadows delivers unique insights into the sentiment of the traders. Shadows show the fight between buyers and sellers to control the price. A large body and small shadows denote that one of the sides has won the battle during that interval. A short body with large shadows after an extended trend indicates the winning herd is losing steam.

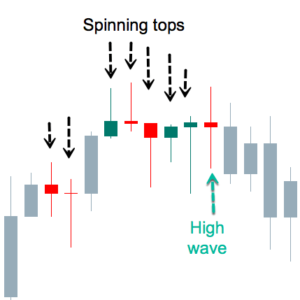
Spinning tops and high wave candles

Fig 1 – Spinning tops and High Wave candles

A spinning top is a visual clue for a candle with a tiny body. The color of the body does not matter.  A spinning top without a body is called Doji, such as the second one in the figure above. The fourth one is very close to it too.

Market sentiment in spinning tops

A the smaller the body, the larger the fight between bulls and bears. It shows that no one had control of the price during this period, as the sellers pressure the price down and buyers up, a small body means no one could outweigh the other party. The demand is counteracted by fresh supply,  and vice-versa, so the market is unable to move.

High Wave Candles

Steve Nison also mentions a close relative to the spinning top, called High Wave Candle. High Wave candles also have very small bodies, but to qualify as High Wave, the formation must also have large shadows on both sides. Shadows need not be of the same size, but they must be large.

Market sentiment in a High Wave Candle

According to Mr. Nison, If indecision is the crucial sentiment on spinning tops, High Wave candles represent “downright confusion.” That is evident because, in the same period, the market goes from the euphory of an extended high to the fear of a large drop, and then to close very near to its opening value. That means total confusion.

Trends and spinning tops

A large white body is like a green light for bulls in an uptrend. A large red body is also a green light to sell. But finding a spinning top in an uptrend means that the buyers do not have the complete control of the price. Therefore, such tops are a warning sign that the trend might be ending. Spinning tops acquire more importance when the price is overextended or close to resistance levels.

Spinning tops during ranging markets do not have any power to warn a trend change, as these stages are too noisy, and filled with lots of small bodies, anyway. Therefore, spinning tops and high waves during horizontal channels have no trading value.

Hammers, Hanging Man, and Shooting stars

Three special cases of spinning tops are the Hammer, the Hanging Man, and the Shooting Star.

Hammer

Fig 2 – Hammer

The hammer has a small real body and a large lower shadow. It is the equivalent of a reversal bar.  The price went from the open to the bottom, then it recovered and closed near or at the high of the session. The color of the body has less importance, although a close above the open has more upside implications. The signal is confirmed with a followthrough candle next to it.

Criteria:
  • The occurrence is after a lengthy downward movement, and the price is overextended.
  • The real body is at the upper top of the trading range
  • The shadow must be two times the length of the body. The longer, the better.
  • No upper or just a tiny shadow
  • Confirmation with a strong bullish candle, next
  • A large volume on the candle confirms a bottom.


Hanging Man

Fig 3 – Hanging Man

The hanging man has a similar shape of the hammer, but it shows up after an uptrend. The Japanese named that way because it is similar to the head and body of a man hanging by the neck.

Criteria:
  • The occurrence is after a significant upward move, and/or the price overextended.
  • The body is at the upper end of the trading range.
  • The lower shadow at least two times the height of the body. The color is not essential, but a bearish finish is preferred. the longer the shadow, the better
  • Tiny or no upper shadow.
  • Confirmation with a large bearish candle
  • High volume on the candlestick is indicative of a potential blowoff.
Shooting star

Fig 4 – Shooting Star

The shooting star is a top reversal candlestick and is the specular image to the hanging man.  In the case of a shooting star, it began great for buyers, but after the euphory of new highs, it came to the deception of the selling pressure with no demand to hold the price.  The close happens at the lower side of the trading range. A bear candle next confirms the trend change.

Criteria:
  • The upper shadow should be two times the height of the body. The larger, the better.
  • The real body is at the bottom of the trading range.
  • Color is less important, although a  red candle implies more bearishness.
  • Almost no lower shadow.
  • A large volume would give more credibility to the signal.
  • A  bear candle next is the confirmation of the change in the trend.


Reference: Steve Nison: The Candlestick Course

Profitable Candlestick Trading, Stephen Bigalow