Categories
Forex Price Action

Weekly High/Low Breakout Trading: Importance of Candles’ Body before Making a Breakout

In today’s lesson, we are going to demonstrate an example of an H4 chart that seems promising to make a breakout at the last week’s low. It produces a strong bearish candle as well at last, but the price does not head towards the South. We try to find out the possible reason behind that.

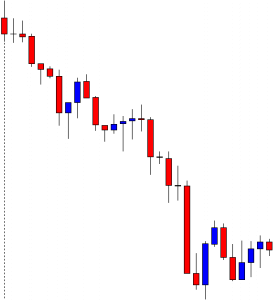
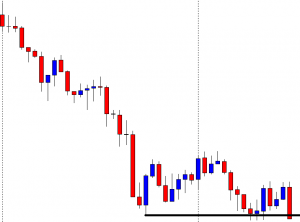
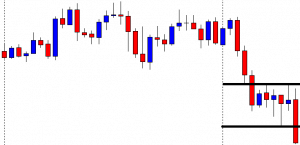
It is an H4 chart. The chart shows that the price heads towards the South with good bearish momentum. The price bounces twice at a level of support. The pair closes its trading week by producing a bearish candle.

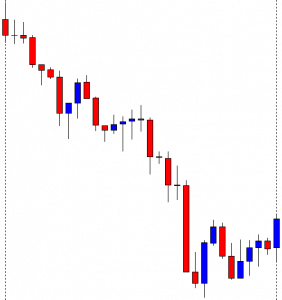
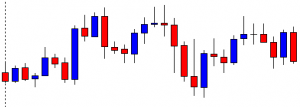
The pair starts its next week by producing a bullish engulfing candle. It means the breakout length gets bigger, which attracts the sellers more. The sellers are to wait for the price to make a bearish reversal candle followed by a breakout at the weekly low.

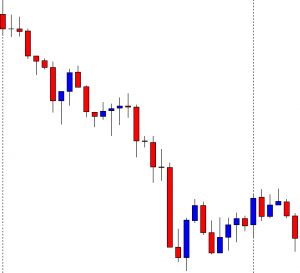
The price finds its resistance and produces two consecutive bearish candles. The sellers are to keep their eyes on the chart closely. It seems that the Bear is going to make a breakout soon. Let us proceed to the next chart to see what happens next.

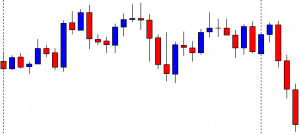
The chart continues to produce bearish candles. However, it has not made a breakout at the weekly low yet. The last candle comes out as a spinning top closing within the weekly low.

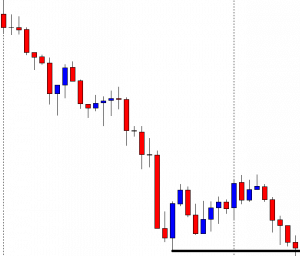
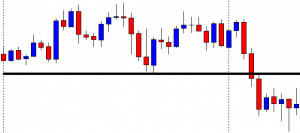
The chart produces a spinning top followed by a bullish engulfing candle. The price then consolidates within the last week’s low and a new resistance. The last candle comes out as a bearish engulfing candle closing just below the weekly low. The question is whether it should be considered as a breakout. It is a breakout, but the H4 traders should skip taking entry on this chart based on a weekly high/low breakout. The reason behind that is the chart takes too long to make the breakout. Once the price starts trending, it must make a breakout without producing any reversal candle. It means if the chart produced the last candle right after the first spinning top; it would be a hunting ground for the sellers. Since it produces four bullish reversal candles before making the breakout, the chart does not belong to the H4 traders based on the weekly low anymore. We must not forget that it must consolidate after a breakout, though. It means it must produce bullish reversal candle/candles in case of a bearish breakout, but it must make a breakout only by producing bearish candles and vice versa.

Categories
Forex Daily Topic Forex Price Action

Weekly High/Low Offers a Better Reward in the H4 Chart Trading

We are going to demonstrate an example of a trade setup on the H4 chart. The price, after breaches the last week’s low; it consolidates and produces a strong bearish reversal candle. It then heads towards the South with extreme bearish momentum. Let us find out how that happens.

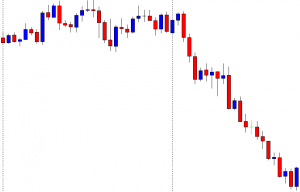
It is an H4 chart. Look at the vertical line on the left. It is the beginning of the week. The chart shows that the price gets trapped within two horizontal levels. The pair is about to finish its trading week. The chart suggests that both the sellers and the buyers are going to keep their eyes on the chart next week to get the breakout and trade.

The pair produces two bullish candles consecutively to start its trading week. However, it produces a bearish engulfing candle and drives the price towards the South. Do you see anything here? Yes, the pair makes a breakout at the last week’s low. It means that the Bear may dominate on the H4 chart. Ideally, traders are to wait for the price to consolidate or make a bullish correction followed by a bearish breakout to go short in the pair.

The price consolidates. It produces some bearish reversal candles such as spinning top, hammer, Doji candle. However, it does not make a breakout at the last swing low. The sellers must wait for an H4 candle to close below consolidation support. Let us wait for more and see what the price does.

The chart produces a bearish engulfing candle closing well below consolidation support. The sellers may trigger a short entry right after the last candle closes. They may set their stop loss above consolidation resistance and set their take profit with 2R. This is the beauty of using weekly high/low and the H4 chart. It offers an excellent reward. Let us now proceed and find out how the entry goes.

The price heads towards the South with good bearish momentum. It produces three bullish inside bars in this move. The last candle comes out as a bullish engulfing candle. The sellers may consider closing their entry and come out with the profit. If we count, we find that the entry offers more than 2R reward. This is what usually happens when the price makes an H4 breakout at the last week’s high/low. Deep consolidation and a strong reversal candle add more fuel to its journey as usual. In our fore coming lessons, we will learn to integrate Fibonacci levels in this strategy to determine our target with better accuracy. Stay tuned.

Categories
Candlestick patterns Forex Daily Topic

Test your knowledge about Candlesticks

After our discussion about short-bodied candlestick in our article

Candlestick Trading Patterns II – Everything you need to know about Single Candlestick Signals

Here you can test your newly acquired knowledge about the matter. If you haven’t read it, please do so before the quiz.


[wp_quiz id=”51631″]


Reference: The Candlestick Course – Steve Nison

Categories
Candlestick patterns Forex Daily Topic

Candlestick Trading Patterns II – Everything you need to know about Single Candlestick Signals

This article is to be dedicated to single candlestick key figures. The majority of patterns are created by more than one candle, but some particular candlestick shapes are key figures to gauge the market sentiment and spot reversals.

In every one of them we will deal with the following aspects:

  • Identification of the candlestick
  • Marker psychology interpretation
  • Criteria and use

Key Single Candlestick Figures:

  • Doji
  • Spinning top
  • High Wave Candlestick
  • Hammer
  • Hanging man
  • Shooting star

The Japanese traders call the real body “the essence of the price action.” A scientist might call it the Signal part of the message, while the shadows are the nose of the market. The relation between the body and the shadows delivers unique insights into the sentiment of the traders. Shadows show the fight between buyers and sellers to control the price. A large body and small shadows denote that one of the sides has won the battle during that interval. A short body with large shadows after an extended trend indicates the winning herd is losing steam.

Spinning tops and high wave candles
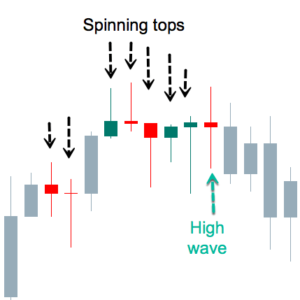
Fig 1 – Spinning tops and High Wave candles

A spinning top is a visual clue for a candle with a tiny body. The color of the body does not matter.  A spinning top without a body is called Doji, such as the second one in the figure above. The fourth one is very close to it too.

Market sentiment in spinning tops

A the smaller the body, the larger the fight between bulls and bears. It shows that no one had control of the price during this period, as the sellers pressure the price down and buyers up, a small body means no one could outweigh the other party. The demand is counteracted by fresh supply,  and vice-versa, so the market is unable to move.

High Wave Candles

Steve Nison also mentions a close relative to the spinning top, called High Wave Candle. High Wave candles also have very small bodies, but to qualify as High Wave, the formation must also have large shadows on both sides. Shadows need not be of the same size, but they must be large.

Market sentiment in a High Wave Candle

According to Mr. Nison, If indecision is the crucial sentiment on spinning tops, High Wave candles represent “downright confusion.” That is evident because, in the same period, the market goes from the euphory of an extended high to the fear of a large drop, and then to close very near to its opening value. That means total confusion.

Trends and spinning tops

A large white body is like a green light for bulls in an uptrend. A large red body is also a green light to sell. But finding a spinning top in an uptrend means that the buyers do not have the complete control of the price. Therefore, such tops are a warning sign that the trend might be ending. Spinning tops acquire more importance when the price is overextended or close to resistance levels.

Spinning tops during ranging markets do not have any power to warn a trend change, as these stages are too noisy, and filled with lots of small bodies, anyway. Therefore, spinning tops and high waves during horizontal channels have no trading value.

Hammers, Hanging Man, and Shooting stars

Three special cases of spinning tops are the Hammer, the Hanging Man, and the Shooting Star.

Hammer
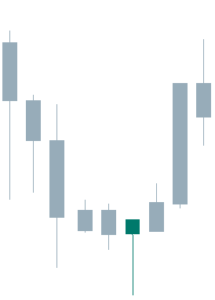
Fig 2 – Hammer

The hammer has a small real body and a large lower shadow. It is the equivalent of a reversal bar.  The price went from the open to the bottom, then it recovered and closed near or at the high of the session. The color of the body has less importance, although a close above the open has more upside implications. The signal is confirmed with a followthrough candle next to it.

Criteria:
  • The occurrence is after a lengthy downward movement, and the price is overextended.
  • The real body is at the upper top of the trading range
  • The shadow must be two times the length of the body. The longer, the better.
  • No upper or just a tiny shadow
  • Confirmation with a strong bullish candle, next
  • A large volume on the candle confirms a bottom.


Hanging Man
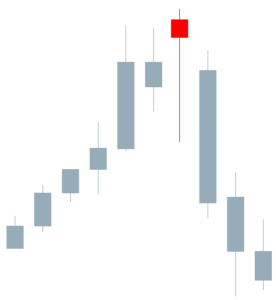
Fig 3 – Hanging Man

The hanging man has a similar shape of the hammer, but it shows up after an uptrend. The Japanese named that way because it is similar to the head and body of a man hanging by the neck.

Criteria:
  • The occurrence is after a significant upward move, and/or the price overextended.
  • The body is at the upper end of the trading range.
  • The lower shadow at least two times the height of the body. The color is not essential, but a bearish finish is preferred. the longer the shadow, the better
  • Tiny or no upper shadow.
  • Confirmation with a large bearish candle
  • High volume on the candlestick is indicative of a potential blowoff.
Shooting star
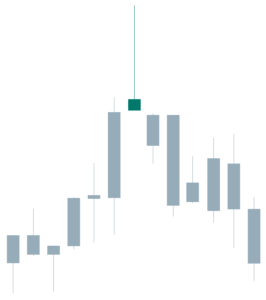
Fig 4 – Shooting Star

The shooting star is a top reversal candlestick and is the specular image to the hanging man.  In the case of a shooting star, it began great for buyers, but after the euphory of new highs, it came to the deception of the selling pressure with no demand to hold the price.  The close happens at the lower side of the trading range. A bear candle next confirms the trend change.

Criteria:
  • The upper shadow should be two times the height of the body. The larger, the better.
  • The real body is at the bottom of the trading range.
  • Color is less important, although a  red candle implies more bearishness.
  • Almost no lower shadow.
  • A large volume would give more credibility to the signal.
  • A  bear candle next is the confirmation of the change in the trend.


Reference: Steve Nison: The Candlestick Course

Profitable Candlestick Trading, Stephen Bigalow