Categories
Forex Basic Strategies

Best Way To Trade The ‘Pin Bar’ Forex Chart Pattern – The Pin Bar Reversal Strategy!

Introduction

Price action or Candlestick analysis combined with some of the factors and confirmations is more reliable as they work out even without using too many indicators on the price chart. Using many indicators on the charts makes it difficult for traders to see the bigger picture (opportunities) in the market. We have numerous candlestick patterns in trading, but there are few on which many traders have their eyes on. One of those is the Pin bar candlestick pattern.

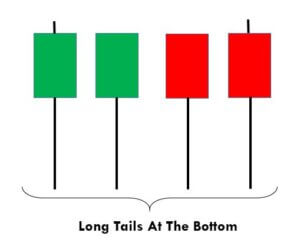
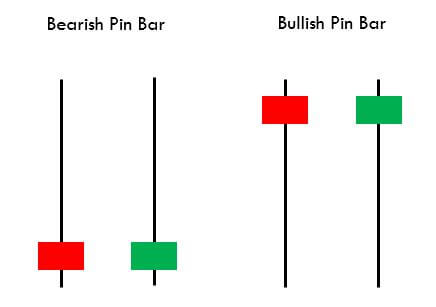
The pin bar candle is mostly used as a reversal pattern. A pin bar typically consists of a price bar with a long wick or shadow. The region between the open and close of the pin bar is called its real body, and a long tail is known as the wick. Pin bars generally have small real bodies in comparison to their long wick. The body of the pin bar is one-third of the total size of the candle. The long wicks of the candle show the area of the price that was rejected and signifies that the price will now move in the opposite direction of the wick.

The psychology behind trading a pin bar candle is that when a price is moving in one direction and reaches significant support or resistance level, it gets rejections. Rejection in a downtrend signifies that the seller pressure (supply) in the market is decreasing, and the buyer pressure (demand) has started increasing and vice versa. The pin bar, either bullish or bearish, signifies that the price does not want to go more down or up and want to reverse from that strong support or resistance level.
Understanding The Bullish & Bearish Pin Bars

Every time a pin bar candle occurring at a strong level does not always mean that the market is going to reverse from that level. To make this valuable, we must see that the overall picture and not just a single candle. In this trading strategy, we will see how we can analyze the overall market near that confluence level. Before that, let’s understand the two types of pin bar candlestick patterns.

Bullish Pin Bar Reversal Pattern

The bullish pin bar candle occurs when the price comes near a strong support level; this leads to the formation of a long wick of the pin bar and shows rejection from that level. This candle usually forms at the end of a downtrend and signifies that there can be either a short-term uptrend or a full reversal forming a strong uptrend.

Bearish Pin Bar Reversal Pattern

The bearish pin bar candle occurs when the price comes near a strong resistance level; this leads to the formation of a long wick of the pin bar and shows rejection from that level. This candle usually forms at the end of an uptrend and signifies that there can be either a short-term downtrend or a full reversal forming a strong downtrend.

Trading Strategies

Pairing The Pin Bar candles With Support & Resistance Levels

As already mentioned, just finding a pin bar candle at the support and resistance level is just not sufficient to trade. We have to figure out what the market is exactly trying to show us. When we see the candles approaching a strong support or resistance level, we have to analyze all the previous candles carefully. If the candles are very big and the momentum is very high, it is less likely to bounce back from that particular level. So, what we have to do is carefully track the candles with wicks. Candles with wicks show that the particular trend momentum is getting weak, and the pressure is reducing as the level is approaching.

After we see candles with wicks and some weaker candles, we will wait for our pin bar candle. As soon as we see the pin bar candle, we have to wait for the next candle to close above the pin bar’s high. We can then buy or sell in the market and place our stop loss 2-3 pips below the pin bar’s low.

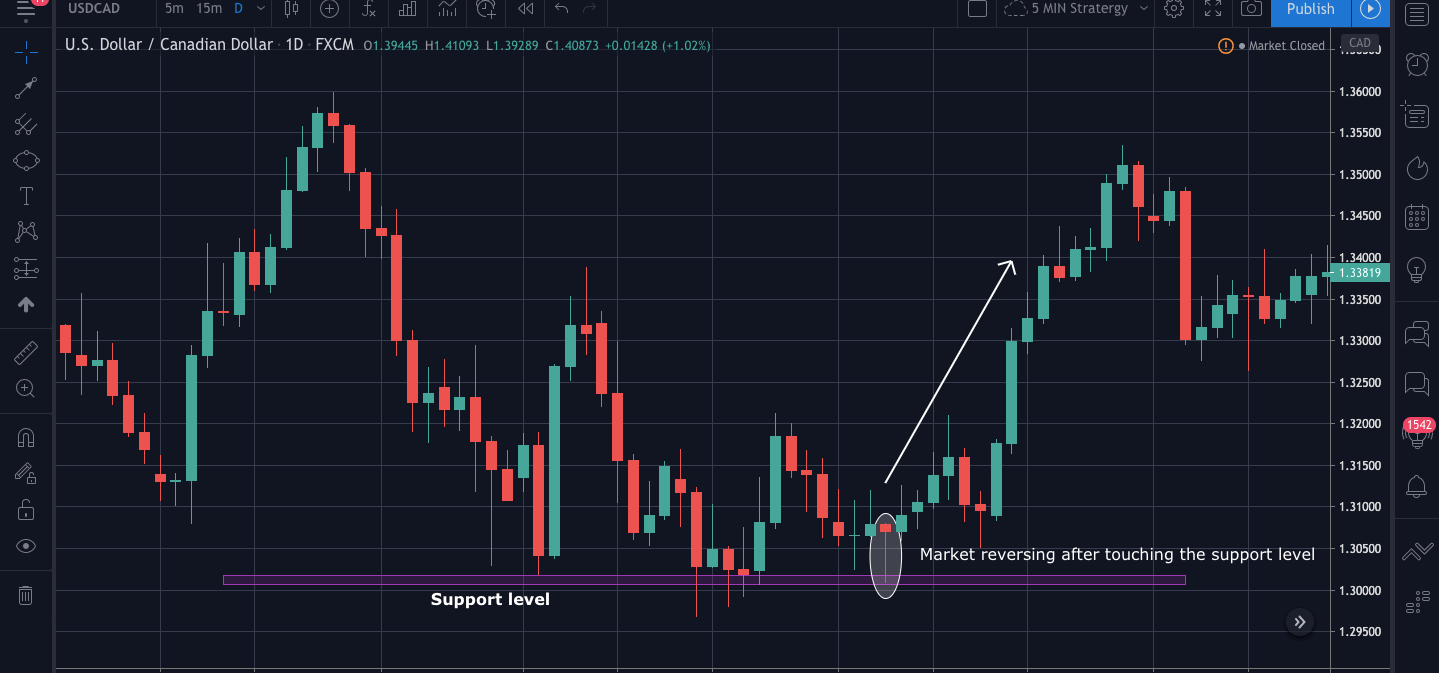
In the below USDCAD 1Hr chart, we can see that the market touches the support level 3 times, the first time the candle was a long and strong bearish candle, and so we must take trades as the picture is still not clear. The second time when the market reaches the support, we see the candles have small bodies and more wicks. This tells us that the seller pressure is decreasing. Finally, for the third time, the market started getting rejections even before touching the support level, and we can also see so many long wicks in the candles. Finally, we see a pin bar candle touching the support level and getting the rejection, and then we see so good bullish momentum.

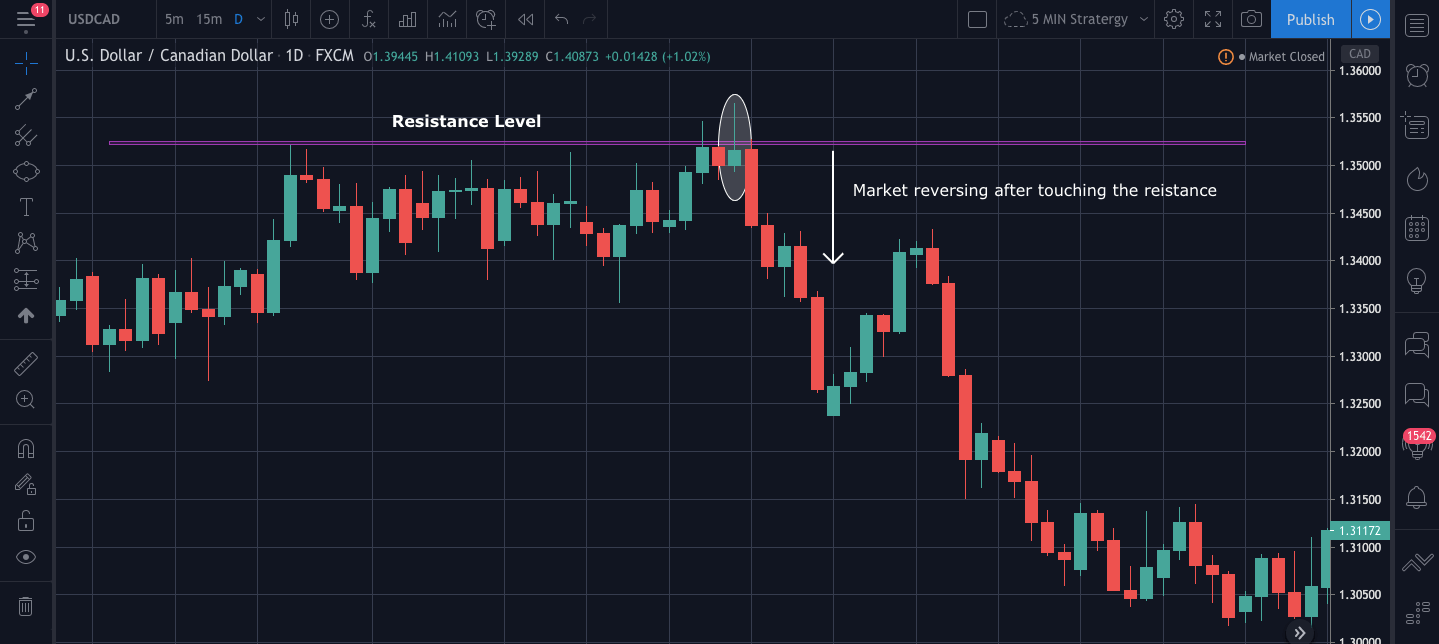
Below is the chart of USDCAD 1hr, market getting a rejection from the resistance level.

Pin Bar Pattern + Bollinger Bands

We are already familiar with one of the famous indicator called the Bollinger band that is used to measure the volatility of the market. We will now use a pin bar with the Bollinger band and understand how we can find some good trades opportunities.

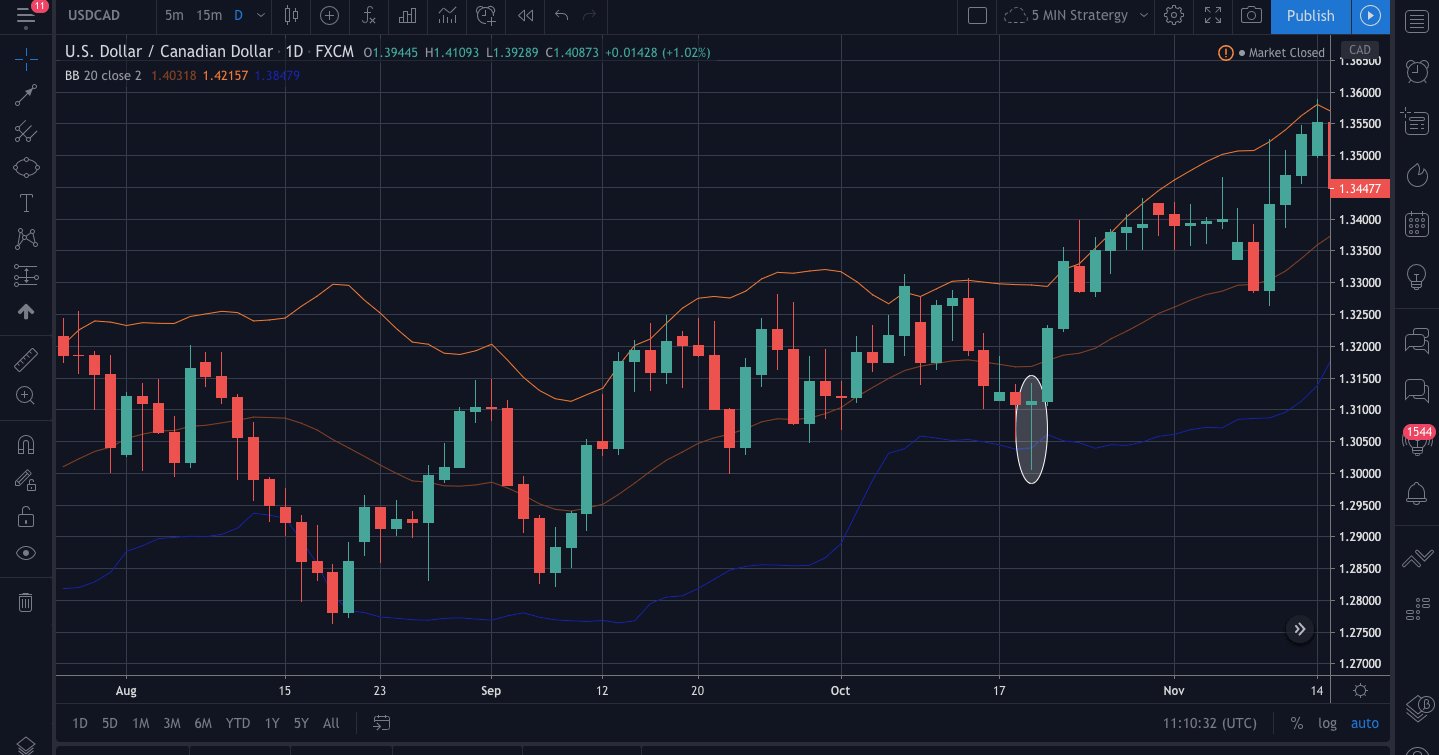
The below chart is USDCAD 1Hr time frame over here. We can see that the market has not pierced the lower band since a long time as mostly the price is between the upper and the lower band. Moving forward, when the candles come close to the lower band, we see a pin bar occurring after the market gets rejection. After the formation of a pin bar candle, we can see the market getting the buying momentum, and it becomes bullish.

Trading With The Confluence Level

As from the above strategies, we are clear how the market behaves when a pin bar occurs at strong support and resistance level and the extreme level of Bollinger band. Now we will see what happens when a pin bar occurs at confluence level. A confluence level is an area that is on the radar of many traders, and many technical indicators generate the same signal. This trading concept is used by price action traders to filter their entry points and spot high probability signals in the market.

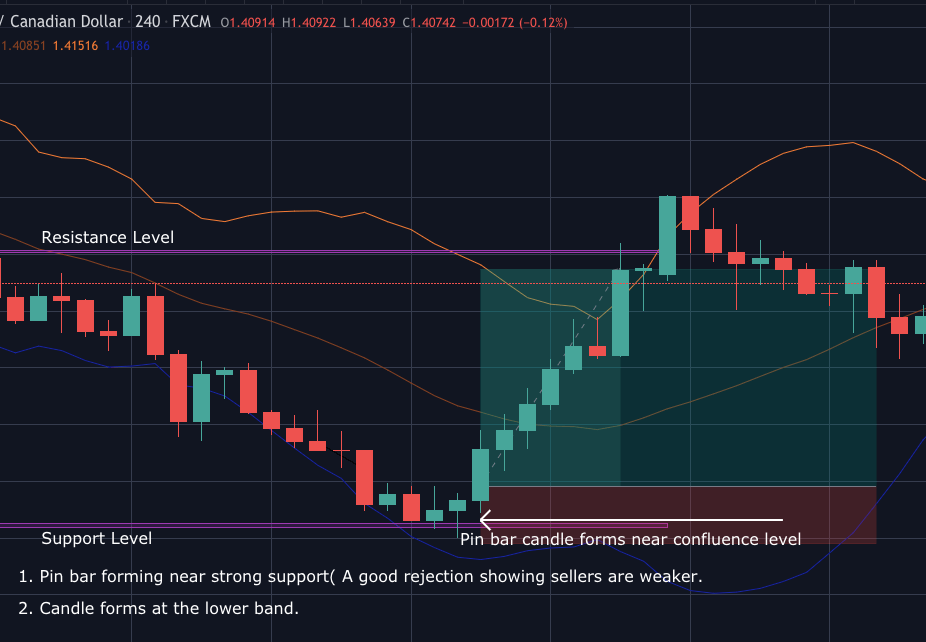
The below example is the pin bar forming at the extreme lower band and a strong support level. We can see that as the market reaches the support level, the bodies of the candles get weaker and smaller, forming longer wicks. Also, the pin bar pierces the lower band near that support level giving us a better signal for a buy.

Talking about the entry and exit points, our entry will be the point when the next candle crosses the high of the pin bar candle. As we see, it is a bullish pin bar; we can be sure that our entry is good if it crosses the high with good momentum. Our exit here will be the next strong resistance level. If you use a trailing stop loss, then we can move the stop loss to breakeven and be in the trade as long as you see the higher high higher low as, after a trend reversal, the candles move very fast and gives more profit and risk to reward ratio.

Conclusion

Trading with a pin bar candle has been proven to be one of the most effective trading strategies. As we saw, we must have a watch on all the candles when it approaches a confluence level because a single candlestick will not give us much information about what market is going to do next. The reliability of these candles is more with the higher time frame as it omits the noises on the chart, and we can have a clear picture. If you are a day trader, then you can 30min or 1hr time frame for executing the trade. Cheers!

Categories
Forex Course

53. Trading The Single Candlestick Patterns – Part 2

Introduction

In the previous lesson, we discussed some basic single candlestick patterns, which gave us trend continuation signals. In this lesson, we will look at reversal patterns that are formed by a single candlestick and how traders should perceive them.

These patterns are very important to learn as they indicate clear market reversals. So essentially, when we find these patterns on the charts, we should anticipate a reversal and take our trades accordingly.

The Hanging Man Candlestick Pattern

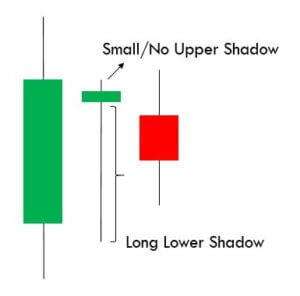
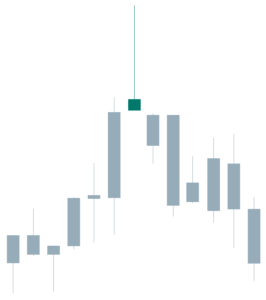
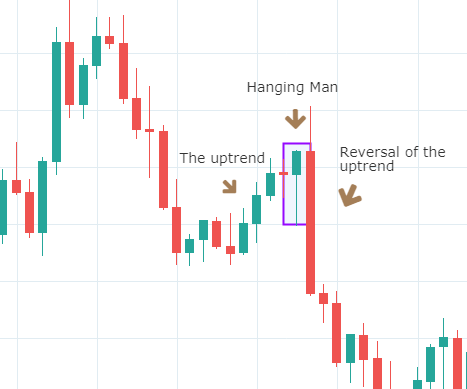
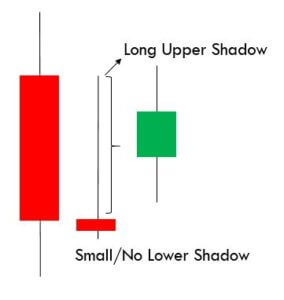
A Hanging Man is a single candlestick pattern that occurs during an uptrend. They give warning signals that markets are going to fall. This candlestick pattern is composed of a small body, a long lower shadow, and no upper shadow. Since it is a reversal pattern that reverses the current uptrend, The Hanging Man indicates the selling pressure that is starting to increase. Below is how the Hanging Man candlestick would look like.

Below is a picture of how this pattern would like on the chart and how the trend reversal takes place.
Pattern Confirmation Criteria

  • Hanging Man is a single candlestick pattern that forms after a small rally in the price. The price rally can also be big, but it should at least be composed of few candles moving higher overall.
  • The candle must have a small body and a lower shadow at least twice the size of the real body.
  • This pattern is only a warning and a bearish candle after the formation of this pattern is highly desired. This is necessary for the Hanging Man pattern to prove to be a valid reversal. This is called confirmation.

The Hanging Man pattern is used by traders to exit long positions or enter into new short positions. After entering for a short position, stop loss can be placed above the high of the Hanging Man candle.

The Shooting Star Candlestick Pattern 

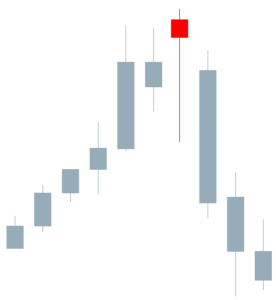
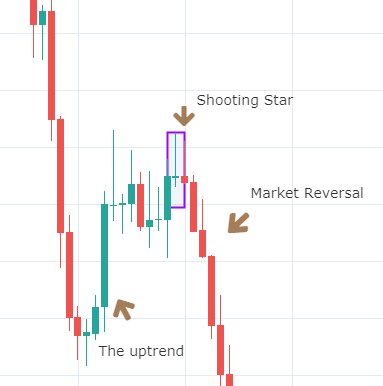
A Shooting Star is a bearish single candlestick pattern which also indicates a market reversal. It has a long upper shadow with little or no lower shadow and a small body.

This pattern typically occurs after an uptrend and forms near the lowest price of the day. The Shooting Star pattern can be seen as the market creating potential resistance around the price range. It implies that the sellers stepped in, erasing all the gains, and pushed the price near the open. Basically, at the appearance of this pattern, buyers are losing control, and sellers are taking over.

Below is a picture of how the pattern would look like on a chart

Pattern Confirmation Criteria

  • The pattern must appear after an advance in price. The price must rally in at least alternate green and red candles if not in all green candles.
  • The distance between the highest price of the candle and the opening price must be twice the length of the body of the candle.
  • It is best if there is no shadow below the body of the candle.

Traders should not take immediate action after the formation of this pattern. They should wait to see what the next candle does following the Shooting Star. If they see a further price decline, they may sell or short that currency pair. However, if the price continues to rise, it means the uptrend is still intact. So traders must favor long positions over shorting.

The difference between the Hanging Man and the Shooting Star is in the length of upper and lower shadows along with the context. By now, we have understood how continuous and reversal single candlestick patterns work. In the upcoming lessons, we will be learning dual candlestick patterns and their implication. Cheers!

[wp_quiz id=”60770″]
Categories
Candlestick patterns Forex Basic Strategies Forex Trading Strategies

Pairing The Hanging Man Candlestick Pattern With MACD Indicator

Introduction

The Hanging Man is a visual candlestick pattern which is used by traders and chartists in all type of markets. The term ‘Hanging Man’ refers to the shape of the candlestick. Visually the hanging man looks like a ‘T,’ and it appears in an uptrend. The formation of this candlestick is an indication that the uptrend is losing its strength. Meaning, sellers started showing interest, and the current trend of an asset is going to get reversed. Anyone can easily predict from the name of this pattern that it is viewed as a bearish sign.

The Hanging Man candle composes of a small body and a long lower shadow with little or no upper shadow. The vital point to remember is that the hanging man pattern is a warning of the upcoming price change, so do not take it as a signal to go short. Also, trading solely based on one pattern is risky. To confirm the sign given by the Hanging Man pattern, traders must pair it with support resistance or any other trading indicator.

This pattern is not confirmed unless the price falls shortly after the Hanging Man. If the next candle closes above the high of the Hanging Man, this pattern is not valid. After the pattern, if the very next candlestick falls, then it’s a clear indication of the reversal. Now, if you see a Hanging Man candlestick and the above-discussed rules apply, you can go ahead and take the trade. But since it is crucial to have an extra confirmation, let’s pair this pattern with a technical indicator.

Pairing the Hanging Man Pattern With MACD Indicator

In this strategy, we have paired the Hanging Man pattern with the MACD indicator so that we can filter out the low probability trades. MACD stands for Moving Average Convergence and Divergence, and it is one of the most popular indicators in the market. It is essentially an oscillator that is used for trading ranges, trend pullbacks, etc. Also, this indicator identifies the overbought and oversold market conditions. In this strategy, we are using the default setting of the MACD indicator to identify the trades.

Step 1 – Confirm the uptrend first on your trading timeframe

We can’t use the Hanging Man pattern to take the buy trades. Since it is a reversal pattern, it only signals the selling trades. So first of all, find out the uptrend in any currency pair. One more primary thing to remember when trading this pattern is this – After finding a clear uptrend, if you see the market printing the Hanging Man, then try not to trade that pair. Because, in a strong trend, it’s not easy for a single candle to change the direction of the entire trend. But if you find this pattern when the uptrend is a bit choppy, it has higher chances to perform. As we can see in the image below, the uptrend in USD/CHF was not strong enough.

Step 2 - Find out the Hanging Man pattern on your trading timeframe

Some traders use two or three timeframes to trade patterns. But that’s not the right way of pattern trading. If you are an intraday trader, use only lower timeframes to identify the pattern. So the next step here is to find out the Hanging Man in this chart. Also, apply the MACD indicator. For us to go short, the MACD indicator must be in the overbought area.

As you can see in the image below, the USD/CHF Forex pair prints a Hanging Man pattern. This is the first clue for us that the buyers aren’t able to push the market higher. Soon after the crossover happened on the MACD indicator, we can say that this forex pair is in the overbought condition. So now, two forces are aligned, and they are indicating us to go short. Within a few hours, the pair rolls over, and it prints brand new lower low.

Step 3 – Entry, Take Profit & Stop Loss

We go short as soon as we see the Hanging Man candlesticks and MACD indicator at the overbought area, we can go short. In this pair, buyers were quite weak, and this is an indication for us to place deeper targets. As we suggest in every strategy, often close your position at significant support/resistance area, or when the market starts to print the opposite pattern. In this pair, we closed our full trade at 0.9844. Overall it was 7R trade, and we made nearly 140+ pips.

Placing the stop loss depends on what kind of trader you are. Some advanced traders use their intuition to close their positions, while some use logical ways such as checking the power of the opposite party. In this trade, we know that the buyers are not strong enough, so there is no need to use the spacious stop loss.

Difference Between Hanging Man and Hammer Patterns

The Hanging Man and Hammer both look the same terms of size and shape. Both of these patterns have long, lower shadows and small bodies. But the Hanging Man forms in an uptrend, and it is a bearish reversal pattern. Whereas the Hammer forms in a downtrend, and it is a bullish reversal pattern. These two patterns appear in both short and long term trends. Do not use these patterns alone to trade the market. Always use them in conjunction with some other reliable indicators or any other trading tool.

Bottom Line

Most of the professional traders never see this pattern alone as a predictor of a potential trend reversal. Because there will be times when the price action continues to move upward even after the appearance of the Hanging Man. Hence technical indicator support is required to confirm the reversal of the trend. Make sure to stick to the rules of the pattern so that you can use it to your advantage. This pattern forms in all the timeframes, but we suggest you master it on a single timeframe first. Cheers!

Categories
Candlestick patterns Forex Daily Topic

Candlestick Trading Patterns II – Everything you need to know about Single Candlestick Signals

This article is to be dedicated to single candlestick key figures. The majority of patterns are created by more than one candle, but some particular candlestick shapes are key figures to gauge the market sentiment and spot reversals.

In every one of them we will deal with the following aspects:

  • Identification of the candlestick
  • Marker psychology interpretation
  • Criteria and use

Key Single Candlestick Figures:

  • Doji
  • Spinning top
  • High Wave Candlestick
  • Hammer
  • Hanging man
  • Shooting star

The Japanese traders call the real body “the essence of the price action.” A scientist might call it the Signal part of the message, while the shadows are the nose of the market. The relation between the body and the shadows delivers unique insights into the sentiment of the traders. Shadows show the fight between buyers and sellers to control the price. A large body and small shadows denote that one of the sides has won the battle during that interval. A short body with large shadows after an extended trend indicates the winning herd is losing steam.

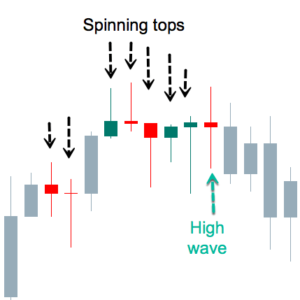
Spinning tops and high wave candles

Fig 1 – Spinning tops and High Wave candles

A spinning top is a visual clue for a candle with a tiny body. The color of the body does not matter.  A spinning top without a body is called Doji, such as the second one in the figure above. The fourth one is very close to it too.

Market sentiment in spinning tops

A the smaller the body, the larger the fight between bulls and bears. It shows that no one had control of the price during this period, as the sellers pressure the price down and buyers up, a small body means no one could outweigh the other party. The demand is counteracted by fresh supply,  and vice-versa, so the market is unable to move.

High Wave Candles

Steve Nison also mentions a close relative to the spinning top, called High Wave Candle. High Wave candles also have very small bodies, but to qualify as High Wave, the formation must also have large shadows on both sides. Shadows need not be of the same size, but they must be large.

Market sentiment in a High Wave Candle

According to Mr. Nison, If indecision is the crucial sentiment on spinning tops, High Wave candles represent “downright confusion.” That is evident because, in the same period, the market goes from the euphory of an extended high to the fear of a large drop, and then to close very near to its opening value. That means total confusion.

Trends and spinning tops

A large white body is like a green light for bulls in an uptrend. A large red body is also a green light to sell. But finding a spinning top in an uptrend means that the buyers do not have the complete control of the price. Therefore, such tops are a warning sign that the trend might be ending. Spinning tops acquire more importance when the price is overextended or close to resistance levels.

Spinning tops during ranging markets do not have any power to warn a trend change, as these stages are too noisy, and filled with lots of small bodies, anyway. Therefore, spinning tops and high waves during horizontal channels have no trading value.

Hammers, Hanging Man, and Shooting stars

Three special cases of spinning tops are the Hammer, the Hanging Man, and the Shooting Star.

Hammer

Fig 2 – Hammer

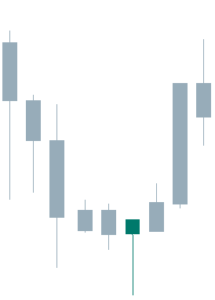
The hammer has a small real body and a large lower shadow. It is the equivalent of a reversal bar.  The price went from the open to the bottom, then it recovered and closed near or at the high of the session. The color of the body has less importance, although a close above the open has more upside implications. The signal is confirmed with a followthrough candle next to it.

Criteria:
  • The occurrence is after a lengthy downward movement, and the price is overextended.
  • The real body is at the upper top of the trading range
  • The shadow must be two times the length of the body. The longer, the better.
  • No upper or just a tiny shadow
  • Confirmation with a strong bullish candle, next
  • A large volume on the candle confirms a bottom.


Hanging Man

Fig 3 – Hanging Man

The hanging man has a similar shape of the hammer, but it shows up after an uptrend. The Japanese named that way because it is similar to the head and body of a man hanging by the neck.

Criteria:
  • The occurrence is after a significant upward move, and/or the price overextended.
  • The body is at the upper end of the trading range.
  • The lower shadow at least two times the height of the body. The color is not essential, but a bearish finish is preferred. the longer the shadow, the better
  • Tiny or no upper shadow.
  • Confirmation with a large bearish candle
  • High volume on the candlestick is indicative of a potential blowoff.
Shooting star

Fig 4 – Shooting Star

The shooting star is a top reversal candlestick and is the specular image to the hanging man.  In the case of a shooting star, it began great for buyers, but after the euphory of new highs, it came to the deception of the selling pressure with no demand to hold the price.  The close happens at the lower side of the trading range. A bear candle next confirms the trend change.

Criteria:
  • The upper shadow should be two times the height of the body. The larger, the better.
  • The real body is at the bottom of the trading range.
  • Color is less important, although a  red candle implies more bearishness.
  • Almost no lower shadow.
  • A large volume would give more credibility to the signal.
  • A  bear candle next is the confirmation of the change in the trend.


Reference: Steve Nison: The Candlestick Course

Profitable Candlestick Trading, Stephen Bigalow