Categories
Forex Basic Strategies

Learning To Trade The ‘Make Your Wish’ Forex Trading Strategy

Introduction

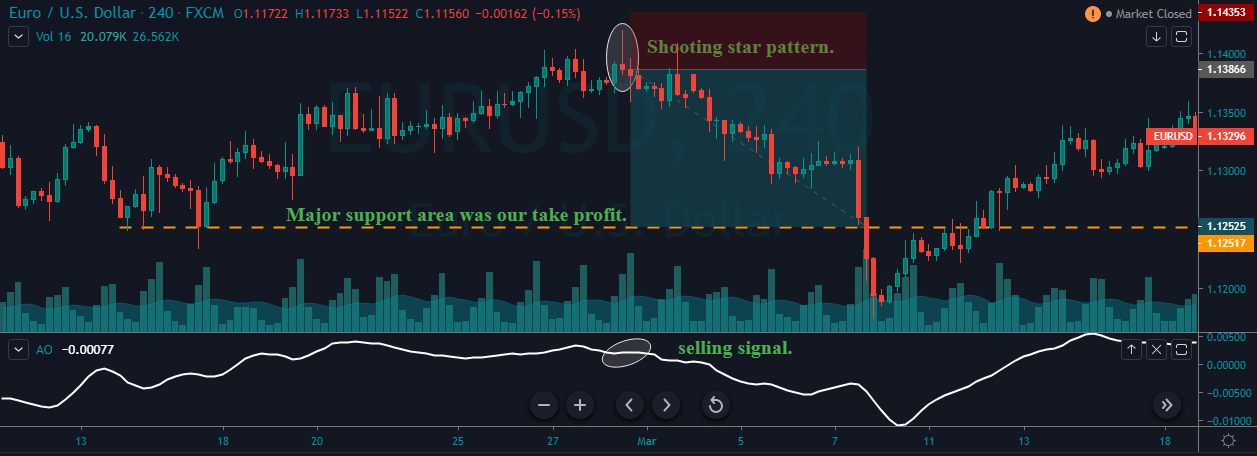
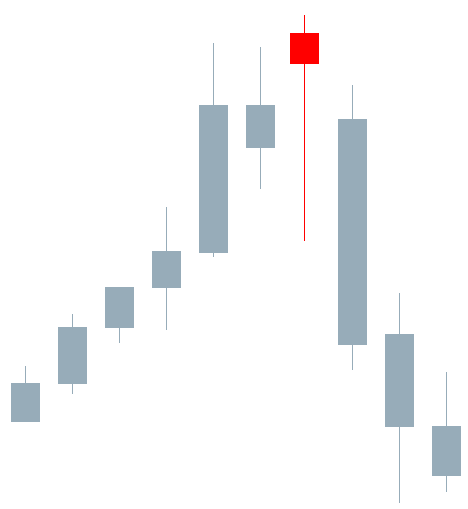
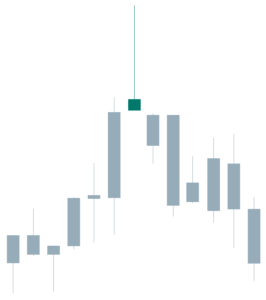
The ‘make your wish’ strategy is based on one of the most popular candlestick patterns, i.e., the Shooting Star. As we all are aware that it looks similar to an inverted hammer, we try to develop a strategy that gives us the ability to capture small bearish reversal in the market. This pattern can prove to be a very “dangerous” pattern if developed at the right location.

Once we comprehend the importance of shooting stars, we discover that one candle pattern has such a power that it can signal the reversal of a strong bullish trend. Very few people take the risk of trading reversal, as this type of trading has badly hurt the trading accounts of many.

Today’s strategy will address this issue and will show how we can catch a falling knife without cutting off our fingers. The ‘make your wish’ can help us spot the top of the market and how to trade it properly. As Shooting stars are believed to make our wishes come true, we have named this strategy as ‘Make Your Wish,’ hoping that the strategy makes our wish of winning come true.

Time Frame

This strategy can only be traded on very short-term price charts such as 5 minutes or 1 minute. Hence, this is a perfect, intraday trading strategy.

Indicators

We make use of just one technical indicator in this strategy, and that is the Chaikin Oscillator.

Currency Pairs

The most suitable currency pairs are EURUSD, USD/JPY, GBP/USD, AUD/USD, GBP/AUD, USD/CAD, GBP/JPY, and CAD/JPY. Minor and exotic pairs should completely be avoided.

Strategy Concept

The ‘make your wish’ strategy is a very simple and effective technique to use in the forex market. Since most traders are interested in day trading and scalping, there isn’t a better strategy to use for that. The strategy is based on the simple concept that when the market moves sharply in one direction, it needs to ‘pullback’ at some of the time that will lead to a decent retracement in the price to the next technical level. The ‘shooting star’ helps us identifying the time when retracement will start.

Here, we take advantage of this retracement and try to particulate in the short-term reversal of the market. As this can involve high risk, we cannot solely rely on a candlestick pattern and use a technical indicator to give us the extra confirmation. We use the ‘Chaikin Oscillator, ’ which is designed to anticipate directional changes in the market by measuring the momentum behind the movements. Anticipating change in direction is the first step to identifying a change in the trend. But this also isn’t enough for forecasting a reversal, which we shall in detail in the future course of the detail.

The risk-to-reward (RR) of the trades will not be high as we are trading against the trend of the market, which may not be suitable for high ‘RR’ seekers. But at the same time, the probability of success is high for trades executed using this strategy.

Trade Setup

In order to execute the strategy, we have considered the 5-minute chart of where we will be illustrating a ‘long’ trade. Here are the steps to execute the strategy.

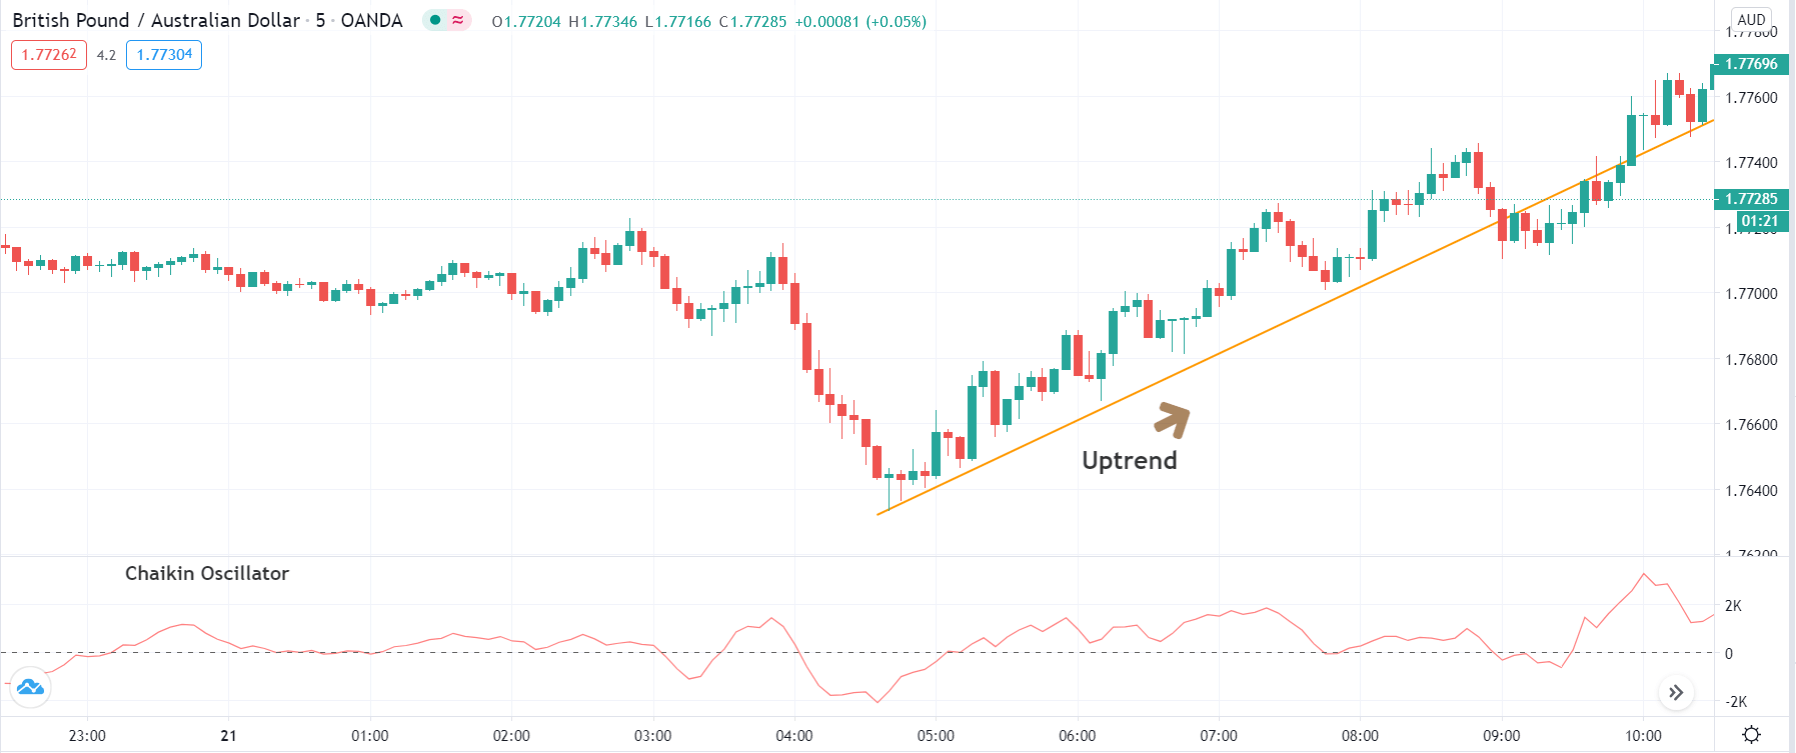
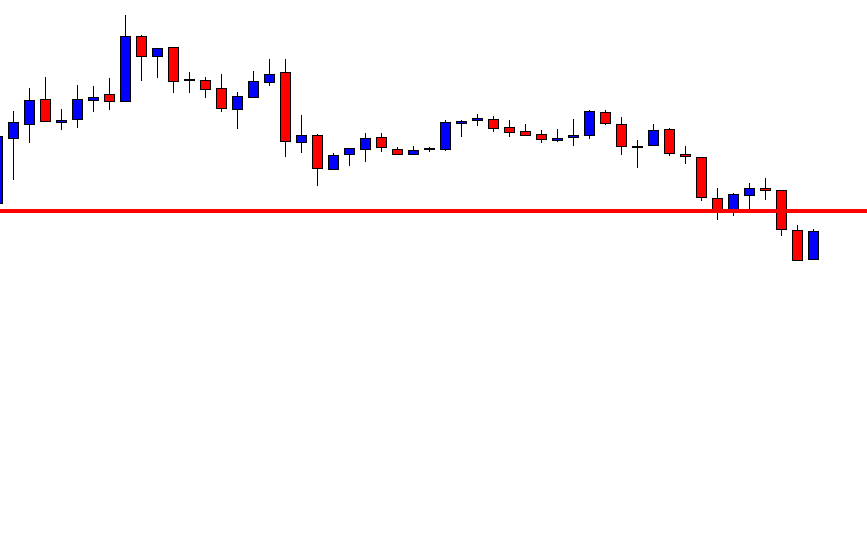
Step 1: Firstly, we identify the trend of the market by plotting a trendline. If the price bounces off from the trendline, each time it comes close to it, we can say that the market is trending. Here we should make sure that the price is not violating the trendline multiple times. This also means that there are no deeper retracements in the trend, which is desired for the strategy. The trendline is plotted by connecting the ‘highs’ and ‘lows’ of the market.

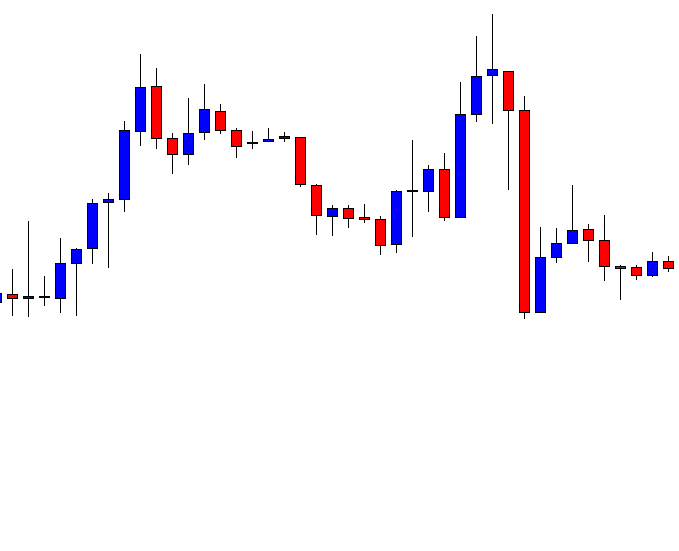
The below image shows that GBP/AUD is in a strong uptrend.

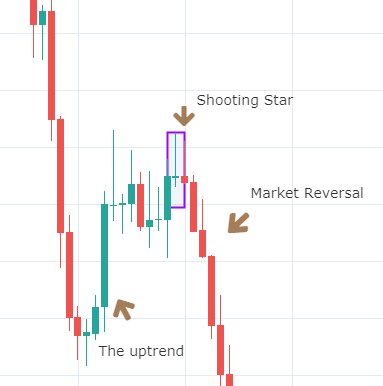
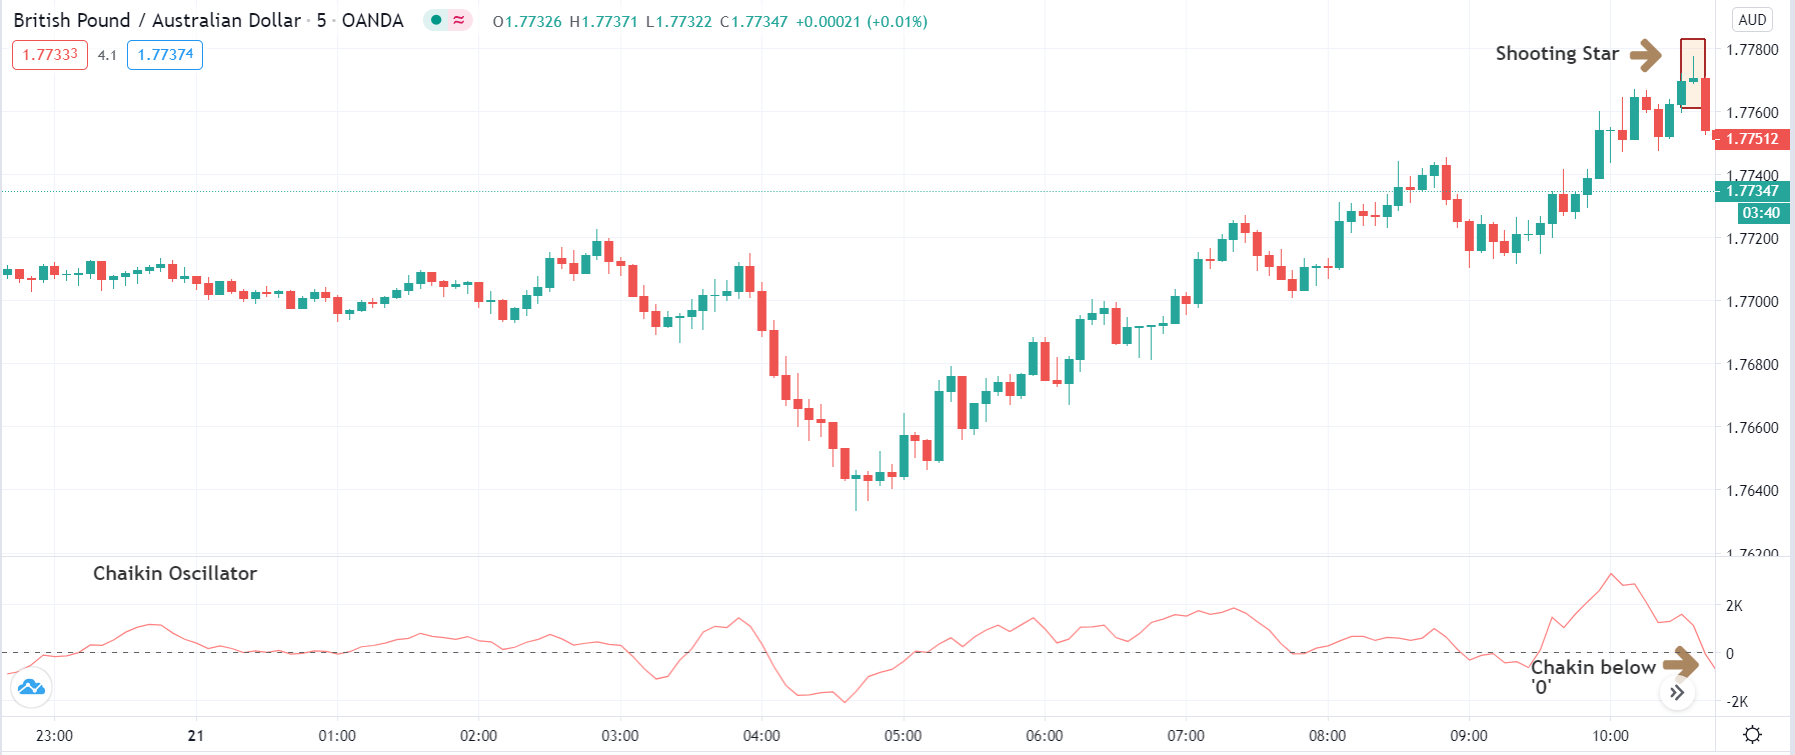
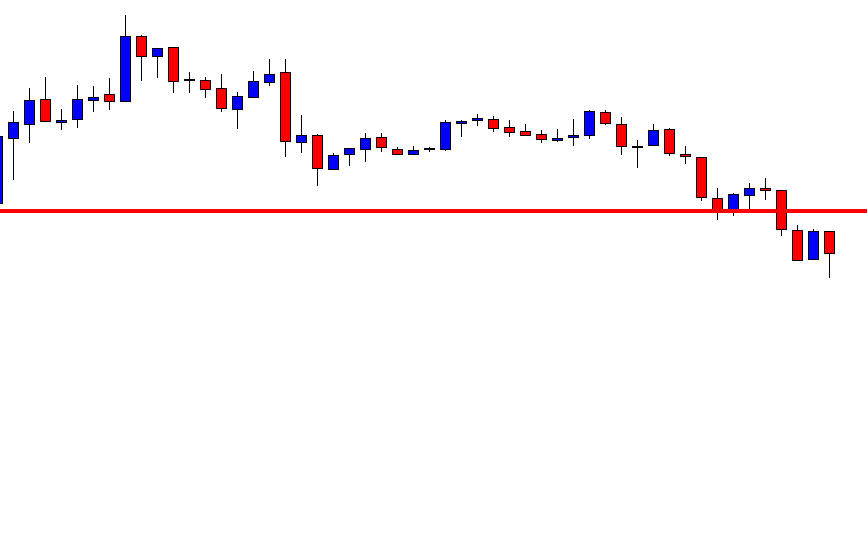
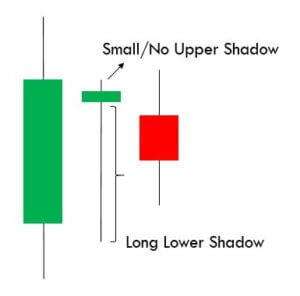
Step 2: Next, we wait for the ‘Shooting star’ candlestick pattern to appear in the trend. Once the pattern shows up on the chart, we look at the Chaikin oscillator and make a note of its reading. When this ‘rejection’ pattern appears in an uptrend, it indicates a reversal of the trend if the Chaikin oscillator starts moving lower and slips below the ‘0’ level.

When this ‘rejection’ pattern appears in a downtrend, it indicates a reversal of the trend if the Chaikin oscillator starts moving upwards and moves from negative to positive territory. When both these criteria are fulfilled, reversal is imminent in the market. But we cannot enter the market as yet.

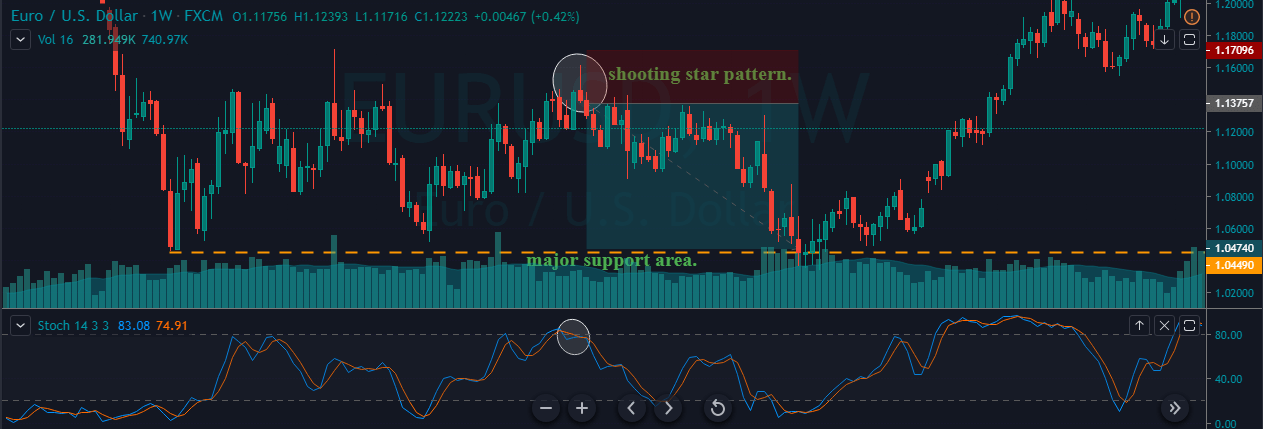
The below image shows how the pattern emerges on the chart along with a falling Chaikin oscillator.

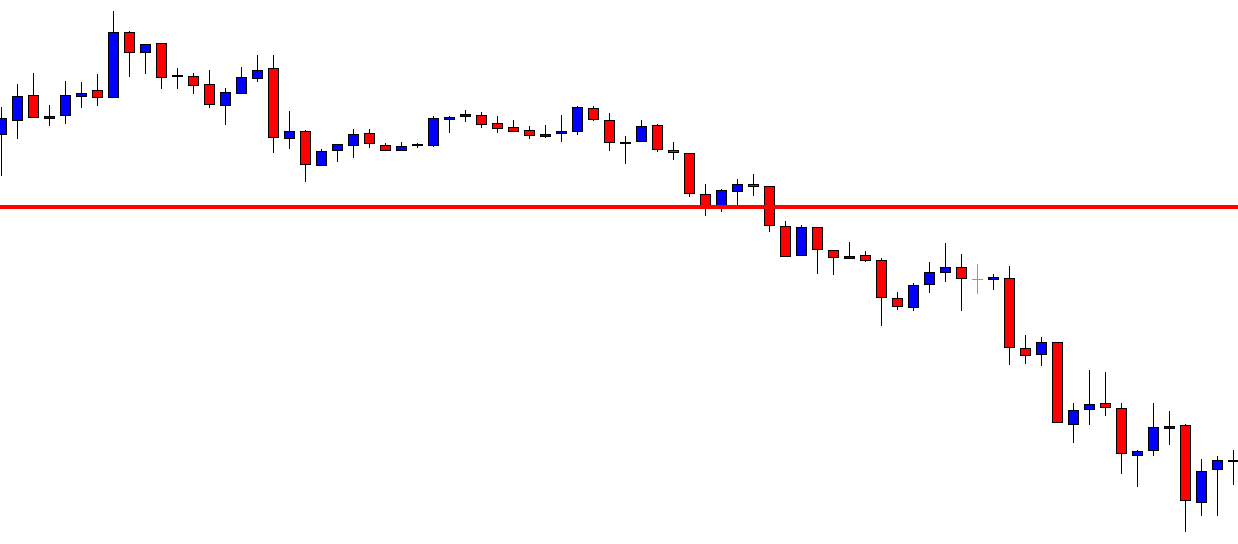
Step 3: It is important to note that we enter the market soon after the appearance of the pattern. After the formation of the pattern, it is necessary to wait for a ‘lower high’ in case of an uptrend reversal and a ‘higher low’ in a downtrend reversal.

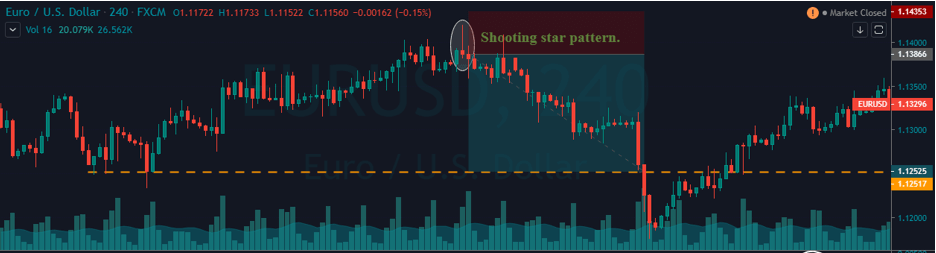
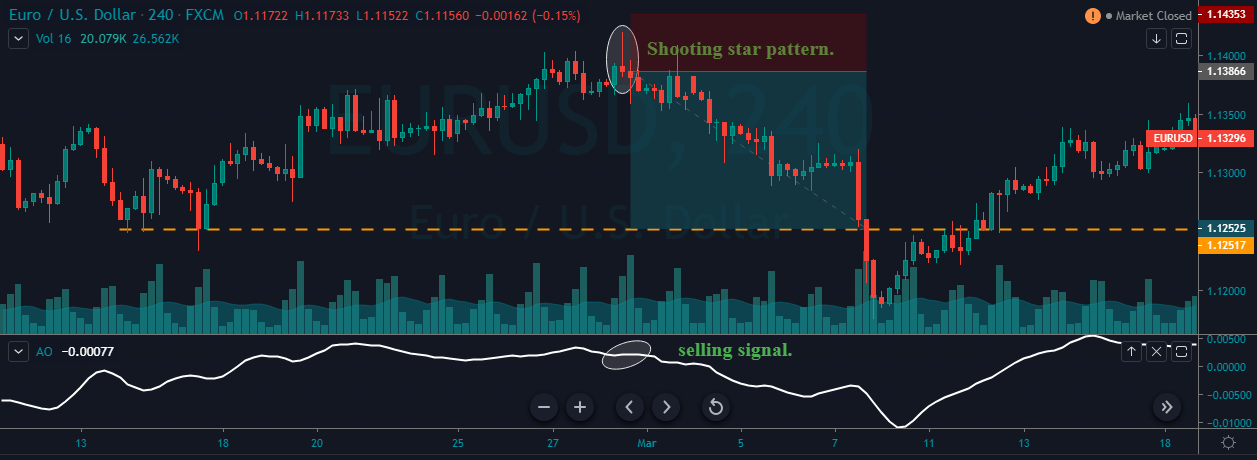
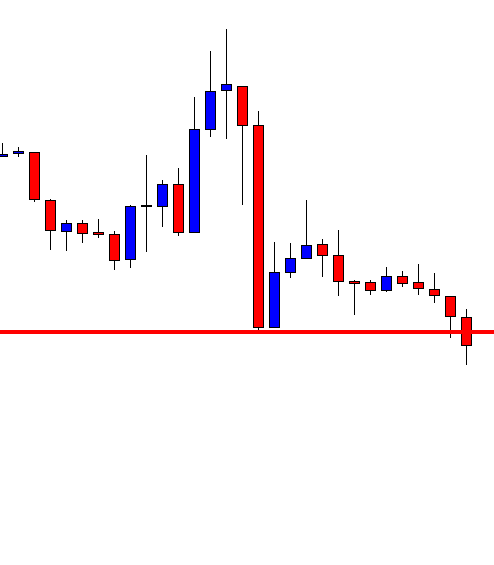
The below image shows the formation of  ‘lower high’ after the appearance of the ‘shooting star’ pattern, which is the final confirmation for entering the trade.

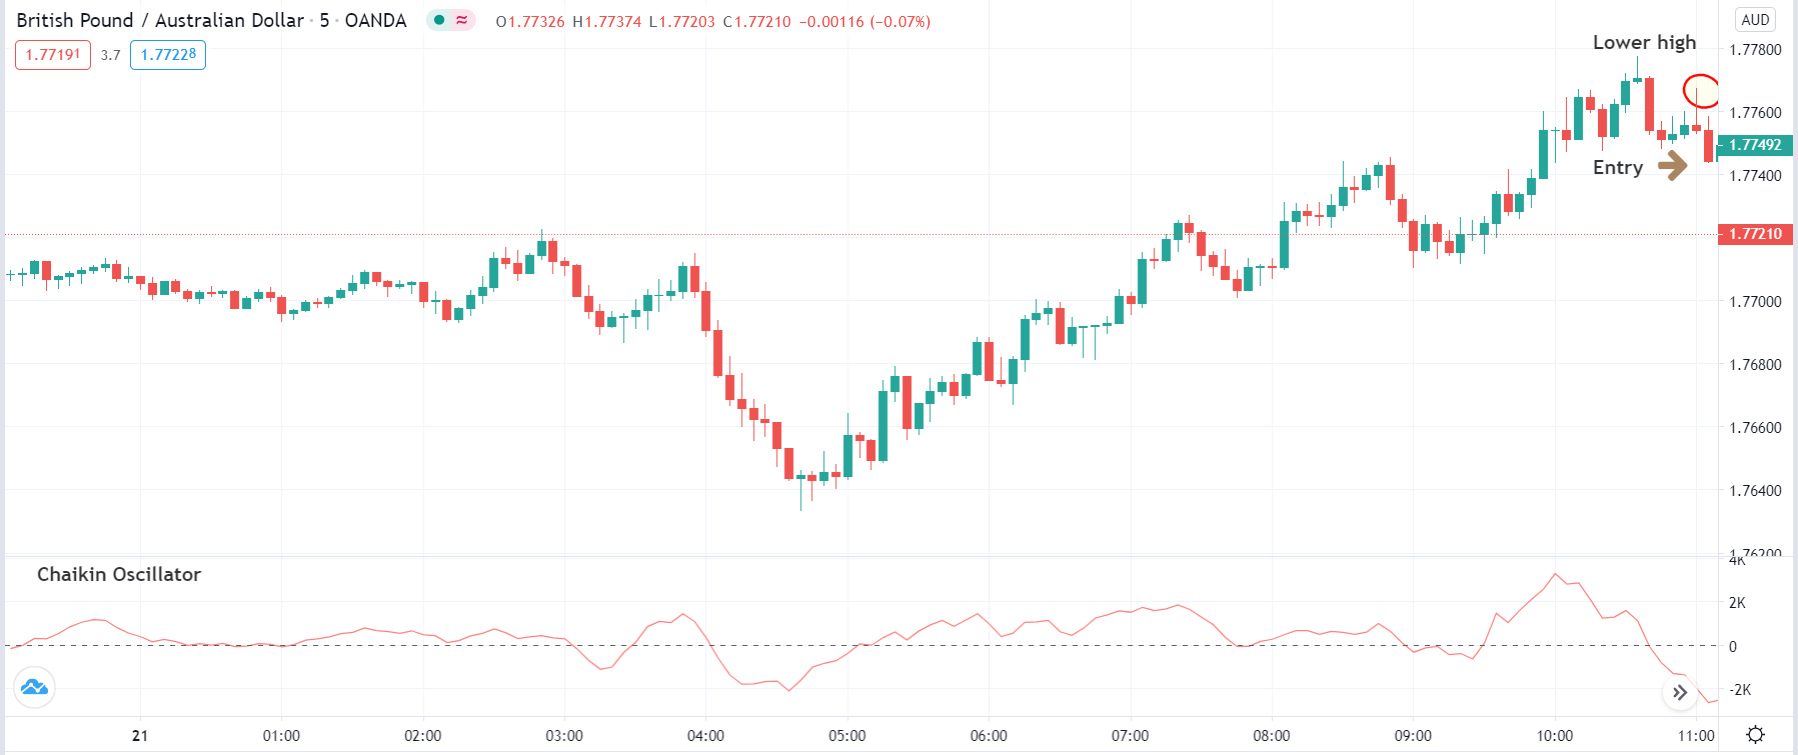
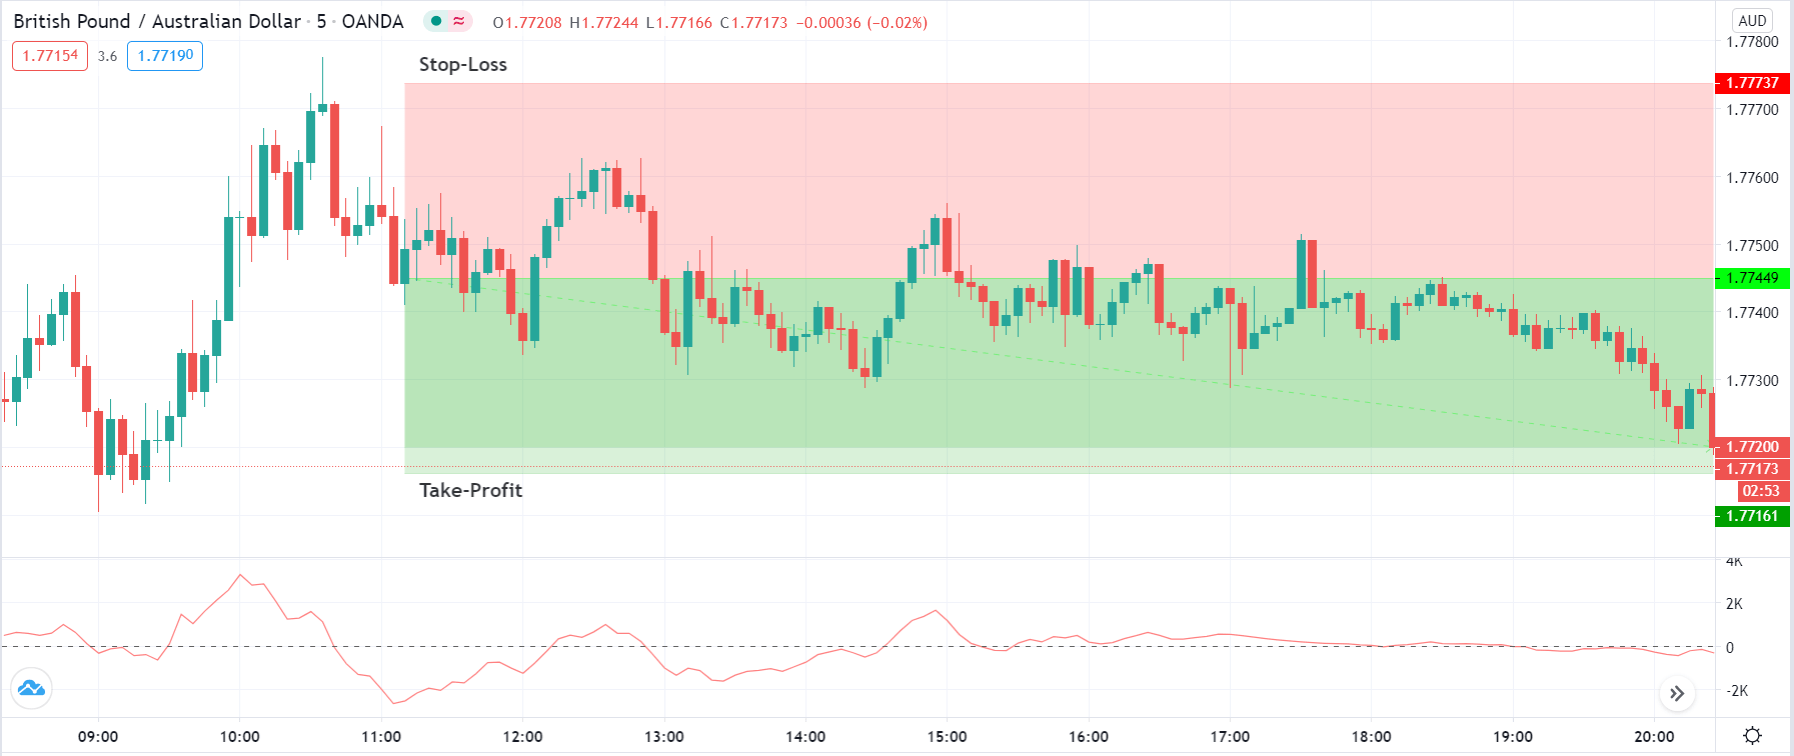
Step 4: Now, let us determine the stop-loss and take-profit levels for the strategy. Setting the stop-loss is pretty simple, where it is placed above the ‘lower high’ in a ‘long’ trade and below the ‘higher low’ in a ‘short’ trade. The take-profit is set at a price where the distance of take-profit from the point of ‘entry’ is equal to the distance of ‘stop-loss.’ That means the risk-to-reward (RR) of trades executed using this strategy is not more than 1:1. The reason for low RR is because we are trading against the trend of the market. Hence there is a possibility that the market might start moving in its major direction.

Strategy Roundup

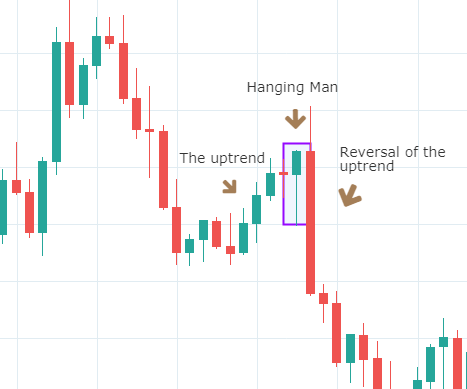
A lot of traders warn against reversal trading, but finding top and bottom in the market and trading reversal can be done successfully if we have a proven methodology like the ‘make your wish’ strategy. We need to take into consideration all the rules outlined in this strategy guide other than just looking for the ‘shooting star’ pattern.

Categories
Forex Fibonacci

How to Use Fibonacci Levels in the H1-15M Combination Trading

In today’s lesson, we are going to demonstrate an example of an H1 chart offering an entry. We find out how Fibonacci levels and 15-min chart help us take the entry. Let us get started.

This is an H1 chart. The chart shows that the price after making a strong bearish move has been making an upward correction. The chart produces a Shooting Star and creates a bearish momentum. However, the sellers are to wait for the chart to make a breakout at the lowest low of the wave. Let us proceed to the next chart to find out what the price does next.

The price keeps driving towards the South and makes a breakout at the lowest low. The breakout candle has a long lower shadow, but it closes well below the level of support. The H1-15M combination traders may flip over to the 15M chart now.

This is how the 15M chart looks. The last candle comes out as a bullish candle. The sellers are to wait for a bearish reversal candle to go short in the pair. They must concentrate hard on the chart. It is waiting time for the sellers.

The 15M chart produces a bearish reversal candle. The candle has a long lower shadow but has a thick bearish body. Moreover, the H1 chart makes a breakout, so a 15M bearish reversal candle means a lot to the sellers. The sellers may trigger a short entry right after the last candle closes. There is another equation, which we will reveal in a minute. Let’s now find out how the trade goes.

The price heads towards the South with good bearish momentum. The 15M chart shows that it consolidates now and then. The H1 chart should look much more bearish than this. Ok, here is the equation we have pointed out a bit earlier. Let us draw Fibonacci levels and find out how it may help us set our stop-loss and take-profit levels.

The Fibonacci levels show that the price trends from the level of 61.8%. It makes a breakout at the level of 100.0 and heads towards the level of 161.8. When the price trends from 61.8%, it creates an extra momentum. This is what this example shows, as well. With Fibonacci, we know where to set the take-profit level. Yes, it is to be at 161.8%. With stop-loss, you may set it above 61.8% if you are too defensive a trader. If you want to be too tight with your stop loss, you may set it between 78.6% to 100.0%. The first one offers less risk-reward, but it has a higher winning percentage. On the other hand, the second one offers excellent risk-reward but has less winning percentage. The choice is yours.

Categories
Forex Course

53. Trading The Single Candlestick Patterns – Part 2

Introduction

In the previous lesson, we discussed some basic single candlestick patterns, which gave us trend continuation signals. In this lesson, we will look at reversal patterns that are formed by a single candlestick and how traders should perceive them.

These patterns are very important to learn as they indicate clear market reversals. So essentially, when we find these patterns on the charts, we should anticipate a reversal and take our trades accordingly.

The Hanging Man Candlestick Pattern

A Hanging Man is a single candlestick pattern that occurs during an uptrend. They give warning signals that markets are going to fall. This candlestick pattern is composed of a small body, a long lower shadow, and no upper shadow. Since it is a reversal pattern that reverses the current uptrend, The Hanging Man indicates the selling pressure that is starting to increase. Below is how the Hanging Man candlestick would look like.

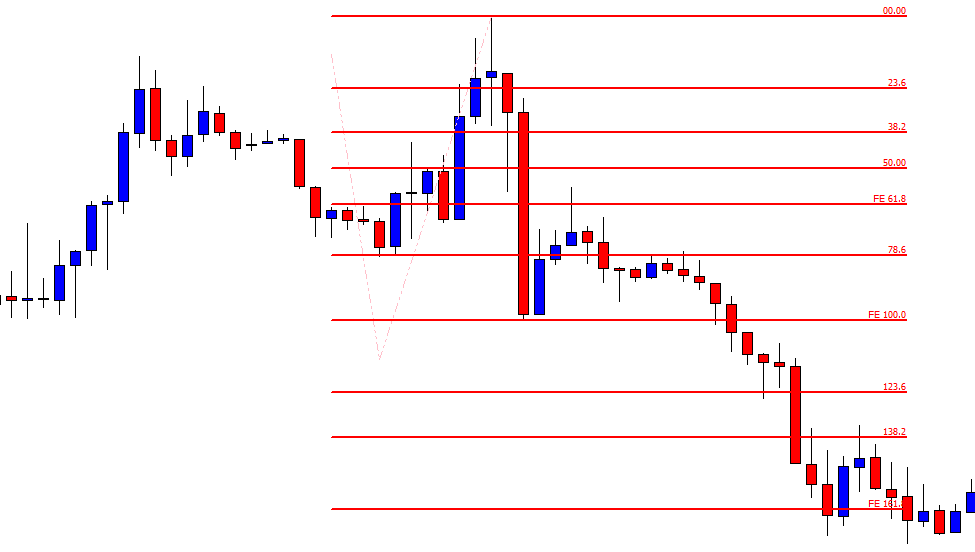
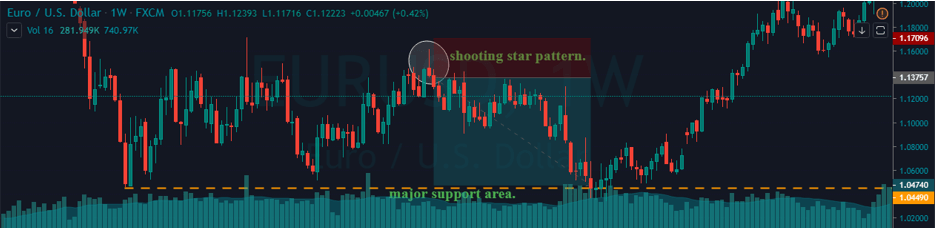
Below is a picture of how this pattern would like on the chart and how the trend reversal takes place.

Pattern Confirmation Criteria

  • Hanging Man is a single candlestick pattern that forms after a small rally in the price. The price rally can also be big, but it should at least be composed of few candles moving higher overall.
  • The candle must have a small body and a lower shadow at least twice the size of the real body.
  • This pattern is only a warning and a bearish candle after the formation of this pattern is highly desired. This is necessary for the Hanging Man pattern to prove to be a valid reversal. This is called confirmation.

The Hanging Man pattern is used by traders to exit long positions or enter into new short positions. After entering for a short position, stop loss can be placed above the high of the Hanging Man candle.

The Shooting Star Candlestick Pattern 

A Shooting Star is a bearish single candlestick pattern which also indicates a market reversal. It has a long upper shadow with little or no lower shadow and a small body.

This pattern typically occurs after an uptrend and forms near the lowest price of the day. The Shooting Star pattern can be seen as the market creating potential resistance around the price range. It implies that the sellers stepped in, erasing all the gains, and pushed the price near the open. Basically, at the appearance of this pattern, buyers are losing control, and sellers are taking over.

Below is a picture of how the pattern would look like on a chart

Pattern Confirmation Criteria

  • The pattern must appear after an advance in price. The price must rally in at least alternate green and red candles if not in all green candles.
  • The distance between the highest price of the candle and the opening price must be twice the length of the body of the candle.
  • It is best if there is no shadow below the body of the candle.

Traders should not take immediate action after the formation of this pattern. They should wait to see what the next candle does following the Shooting Star. If they see a further price decline, they may sell or short that currency pair. However, if the price continues to rise, it means the uptrend is still intact. So traders must favor long positions over shorting.

The difference between the Hanging Man and the Shooting Star is in the length of upper and lower shadows along with the context. By now, we have understood how continuous and reversal single candlestick patterns work. In the upcoming lessons, we will be learning dual candlestick patterns and their implication. Cheers!

[wp_quiz id=”60770″]
Categories
Forex Basic Strategies

Pairing The Shooting Star With Stochastic & Awesome Oscillators

Introduction

The Shooting Star is one of the most popular bearish candlestick patterns in the industry. This pattern appears in an uptrend most of the time, and it indicates bearish reversals in the price action of any underlying currency. So basically, when this pattern appears on the charts, it implies that the buyers are exhausted, and its sellers turn to lead the market. Once we have identified the Shooting Star pattern in an uptrend and confirm the trend reversal with any other credible indicator, we should look to open a short position.

This pattern has a unique structure as it consists of a small body and a high upper wick, as shown in the image below. This image accurately represents the trend reversal because we can clearly see the buyers losing momentum and sellers taking over the market.

Trading strategies with the Shooting Star pattern

Shooting Star + Stochastic Indicator

In this strategy, we have paired the Shooting Star pattern with the Stochastic Indicator to identify the trading opportunities. Just like RSI and MACD, the Stochastic Indicator also belongs to the oscillator group. It is developed in the 1950s, and it is still widely used by the traders. The Stochastic indicator oscillates between 0 & 100 levels. When the indicator goes below 20, it means that the currency pair is oversold. Similarly, when the indicator goes above the 100 level, it indicates that the currency pair is overbought.

STEP 1 – First of all, find the Shooting Star pattern in an uptrend.

STEP 2 – Check the Stochastic indicator

Once you find the Shooting Star pattern, the next step is to check the Stochastic Indicator. If the indicator is giving a reversal at the oversold area, it indicates the overbought market conditions.

The image below represents the EUR/USD weekly Forex chart. In this pair, price action was held at a significant resistance area, and it prints the Shooting Star pattern. Also, the Stochastic indicates the overbought conditions. These three clues clearly say that this pair is all set to change its direction. The Stochastic pattern on a higher timeframe has very higher chances to perform. So whenever you find this pattern, and if it supports the rules of this strategy, always trade big.

Step 3 – Stop-loss and Take Profit

A stop loss is specially designed to limit the loss of the trader. So before activating your trade, it is essential to decide where you are going to place the stop loss. In the example above, we put the stop loss just above the Shooting Star candle.

Shooting Star pattern indicates the reversal in price action. This means that we are catching the top of the trend. As the end goal of every trader is to maximize their profits and minimize losses, always try to hold the positions for more extended targets.

In the example, we have closed our position at a higher timeframe support area. We can use the higher timeframe support or look for the Stochastic Indicator to reach the oversold area. Another way to close the position is when the market reaches the major support area while the Stochastic is in the oversold area.

As we can see in the image below, we closed our full position at a significant support area. You can use the Stochastic or any other trading tool to exit your position, but we always suggest to use the considerable support/resistance area to book profits.

Shooting Star Pattern + Awesome Oscillator

In this strategy, we have paired the Shooting Star pattern with the Awesome Oscillator to identify the trading opportunities. The Awesome Oscillator is a boundless indicator. When the Awesome Oscillator reverses below the zero-level, it indicates the buying pressure. When it reverses above the zero-level, it means sellers are ready to lead the market. Furthermore, some traders use this indicator to confirm the strength of the trend. When the indicator goes above zero-level, it means the buying trend is quite strong, and when it goes below the zero-level, it shows the sellers dominating the market.

Step 1 – First of all, find the Shooting Star pattern in an uptrend.

Step 2 – Look for the Awesome oscillator reversal

Once we find the Shooting Star pattern, the next step is to take a sell-entry when the Awesome Oscillator reverses at overbought market conditions.

The image below is the EURUSD 240 chart. On this pair, at first, the buyers were quite weak, and they started holding at the resistance area. Furthermore, in that small range, price action turned sideways, and it printed the Shooting Star pattern. The Awesome Oscillator even reversed at the overbought conditions. Both of the trading tools are indicating the exhaustion of the buyers. And sellers are ready to take over the market.

Step 3 – Take Profit and Stop loss

Every trader has different expectations from the market, some like to trade short term trends, and some like to trade longer-term moves. If you are an intraday trader, then we suggest you close your position when the Awesome Oscillator reverses at the oversold area. But, if you are a swing trader or investor, wait for the opposite pattern (Hammer Pattern) to appear to close all of your positions. We can even use the higher timeframe support/resistance area to close our positions.

We advise you to place the stop-loss order above the Shooting Star pattern. As you can see in the image below, we booked full profits at the major support area. After that, the price action dropped a bit more but reversed immediately to follow the buy direction. It is important not to ignore the higher timeframe support/resistance areas.

The psychology behind the Shooting Star Pattern

At first, we see the buyers enjoying the uptrend as the price of the currency keeps printing brand new higher high. As this euphoric moment begins to set in, the sellers start to sell their positions at higher prices. Now the buyers get panicked, and even they start to sell their positions. Now that the buyers and sellers are both selling their positions, panic is created in the market, which leads to a sharp reversal in price action. Thus a long wicked small body candle appears on the trading charts.

Keep in mind that the Shooting Star pattern is more reliable when it is formed after the three consecutive bullish candles. It creates strong bullish pressure on the price chart, and in such cases, the upper wick of Shooting Star is even longer. It indicates that the price is about to reverse with even more strength.

Bottom line

The Shooting Star is a single candle pattern, and it is the most popular trend reversal pattern in the industry. There is a strong psychological pattern that exists beyond the Shooting Star pattern. When the market is in an uptrend, and when buyers gain exponential strength, most of the traders book the profit, and as a result, the bullish trend loses its strength. This results in sellers sending the price down. Most of the time, the Shooting Star pattern provides the 3:1 risk-reward ratio trades.

We hope you find this article informative. Please let us know if you have any questions regarding the same in the comments below. Cheers!

Categories
Candlestick patterns Forex Daily Topic

Candlestick Trading Patterns II – Everything you need to know about Single Candlestick Signals

This article is to be dedicated to single candlestick key figures. The majority of patterns are created by more than one candle, but some particular candlestick shapes are key figures to gauge the market sentiment and spot reversals.

In every one of them we will deal with the following aspects:

  • Identification of the candlestick
  • Marker psychology interpretation
  • Criteria and use

Key Single Candlestick Figures:

  • Doji
  • Spinning top
  • High Wave Candlestick
  • Hammer
  • Hanging man
  • Shooting star

The Japanese traders call the real body “the essence of the price action.” A scientist might call it the Signal part of the message, while the shadows are the nose of the market. The relation between the body and the shadows delivers unique insights into the sentiment of the traders. Shadows show the fight between buyers and sellers to control the price. A large body and small shadows denote that one of the sides has won the battle during that interval. A short body with large shadows after an extended trend indicates the winning herd is losing steam.

Spinning tops and high wave candles

Fig 1 – Spinning tops and High Wave candles

A spinning top is a visual clue for a candle with a tiny body. The color of the body does not matter.  A spinning top without a body is called Doji, such as the second one in the figure above. The fourth one is very close to it too.

Market sentiment in spinning tops

A the smaller the body, the larger the fight between bulls and bears. It shows that no one had control of the price during this period, as the sellers pressure the price down and buyers up, a small body means no one could outweigh the other party. The demand is counteracted by fresh supply,  and vice-versa, so the market is unable to move.

High Wave Candles

Steve Nison also mentions a close relative to the spinning top, called High Wave Candle. High Wave candles also have very small bodies, but to qualify as High Wave, the formation must also have large shadows on both sides. Shadows need not be of the same size, but they must be large.

Market sentiment in a High Wave Candle

According to Mr. Nison, If indecision is the crucial sentiment on spinning tops, High Wave candles represent “downright confusion.” That is evident because, in the same period, the market goes from the euphory of an extended high to the fear of a large drop, and then to close very near to its opening value. That means total confusion.

Trends and spinning tops

A large white body is like a green light for bulls in an uptrend. A large red body is also a green light to sell. But finding a spinning top in an uptrend means that the buyers do not have the complete control of the price. Therefore, such tops are a warning sign that the trend might be ending. Spinning tops acquire more importance when the price is overextended or close to resistance levels.

Spinning tops during ranging markets do not have any power to warn a trend change, as these stages are too noisy, and filled with lots of small bodies, anyway. Therefore, spinning tops and high waves during horizontal channels have no trading value.

Hammers, Hanging Man, and Shooting stars

Three special cases of spinning tops are the Hammer, the Hanging Man, and the Shooting Star.

Hammer

Fig 2 – Hammer

The hammer has a small real body and a large lower shadow. It is the equivalent of a reversal bar.  The price went from the open to the bottom, then it recovered and closed near or at the high of the session. The color of the body has less importance, although a close above the open has more upside implications. The signal is confirmed with a followthrough candle next to it.

Criteria:
  • The occurrence is after a lengthy downward movement, and the price is overextended.
  • The real body is at the upper top of the trading range
  • The shadow must be two times the length of the body. The longer, the better.
  • No upper or just a tiny shadow
  • Confirmation with a strong bullish candle, next
  • A large volume on the candle confirms a bottom.


Hanging Man

Fig 3 – Hanging Man

The hanging man has a similar shape of the hammer, but it shows up after an uptrend. The Japanese named that way because it is similar to the head and body of a man hanging by the neck.

Criteria:
  • The occurrence is after a significant upward move, and/or the price overextended.
  • The body is at the upper end of the trading range.
  • The lower shadow at least two times the height of the body. The color is not essential, but a bearish finish is preferred. the longer the shadow, the better
  • Tiny or no upper shadow.
  • Confirmation with a large bearish candle
  • High volume on the candlestick is indicative of a potential blowoff.
Shooting star

Fig 4 – Shooting Star

The shooting star is a top reversal candlestick and is the specular image to the hanging man.  In the case of a shooting star, it began great for buyers, but after the euphory of new highs, it came to the deception of the selling pressure with no demand to hold the price.  The close happens at the lower side of the trading range. A bear candle next confirms the trend change.

Criteria:
  • The upper shadow should be two times the height of the body. The larger, the better.
  • The real body is at the bottom of the trading range.
  • Color is less important, although a  red candle implies more bearishness.
  • Almost no lower shadow.
  • A large volume would give more credibility to the signal.
  • A  bear candle next is the confirmation of the change in the trend.


Reference: Steve Nison: The Candlestick Course

Profitable Candlestick Trading, Stephen Bigalow