Categories
Forex Daily Topic Forex Price Action

Weekly High/Low Offers a Better Reward in the H4 Chart Trading

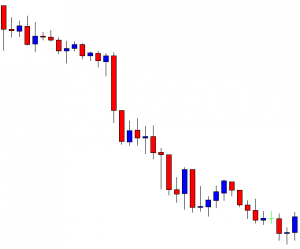
We are going to demonstrate an example of a trade setup on the H4 chart. The price, after breaches the last week’s low; it consolidates and produces a strong bearish reversal candle. It then heads towards the South with extreme bearish momentum. Let us find out how that happens.

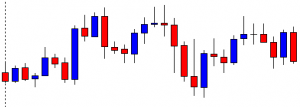
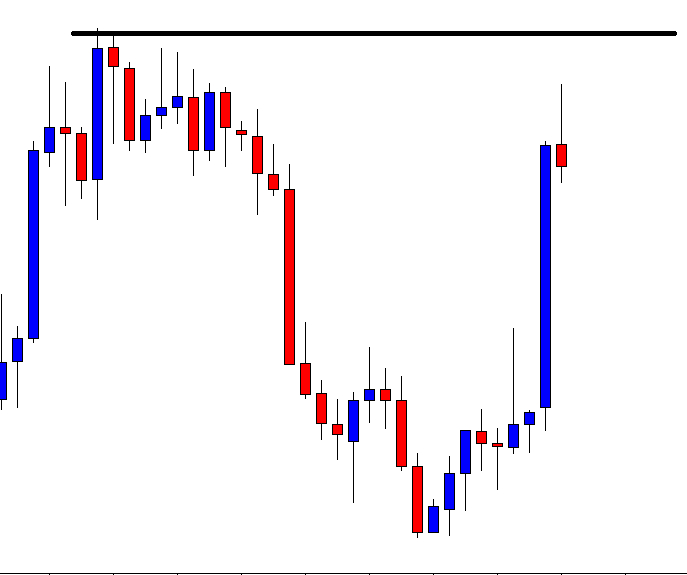
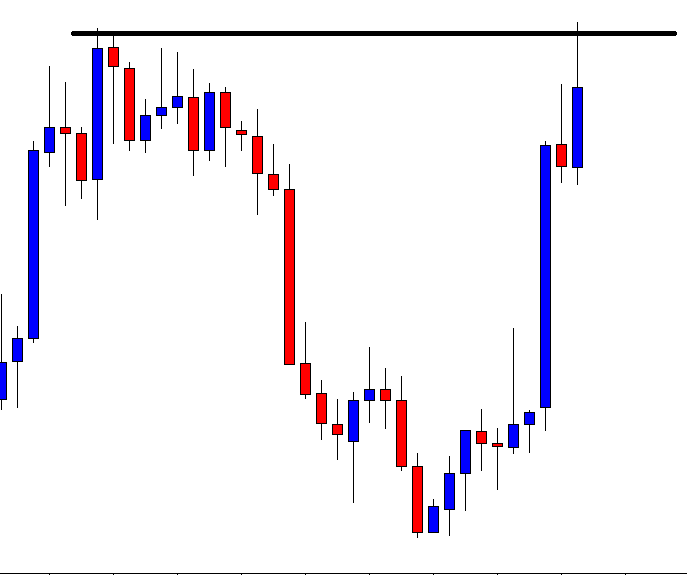
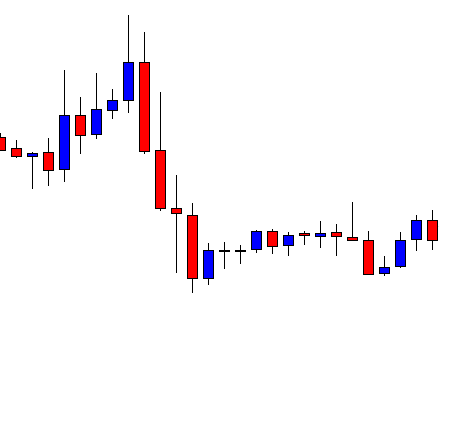
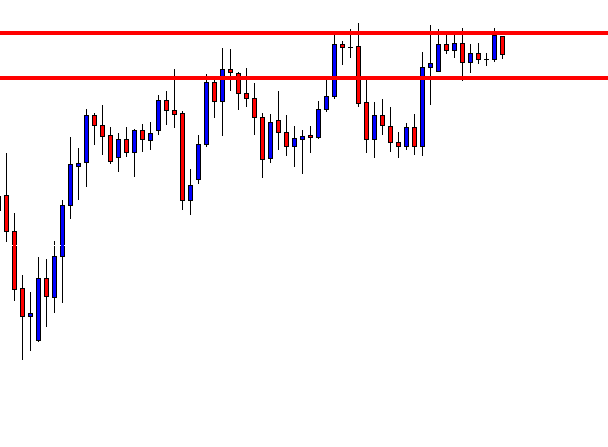
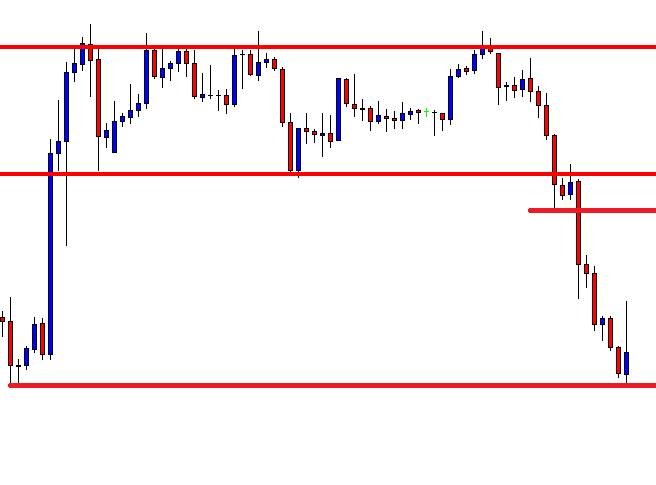
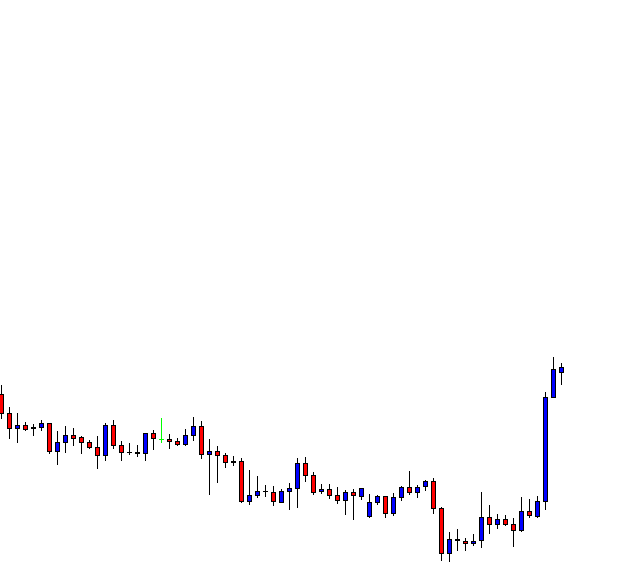
It is an H4 chart. Look at the vertical line on the left. It is the beginning of the week. The chart shows that the price gets trapped within two horizontal levels. The pair is about to finish its trading week. The chart suggests that both the sellers and the buyers are going to keep their eyes on the chart next week to get the breakout and trade.

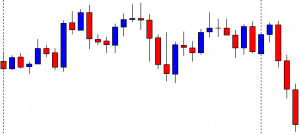
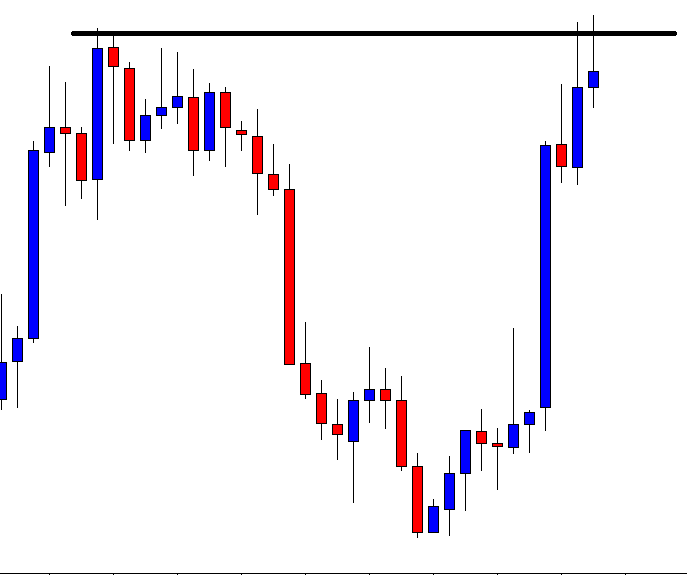
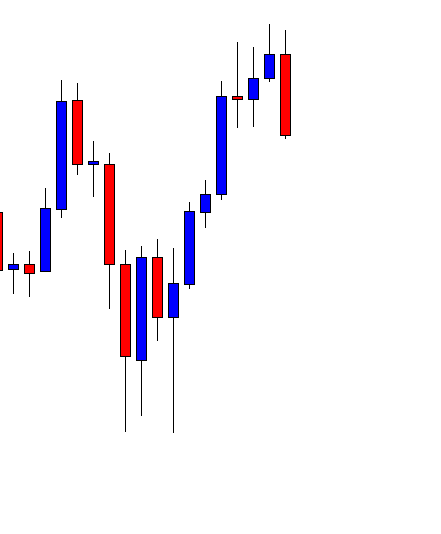
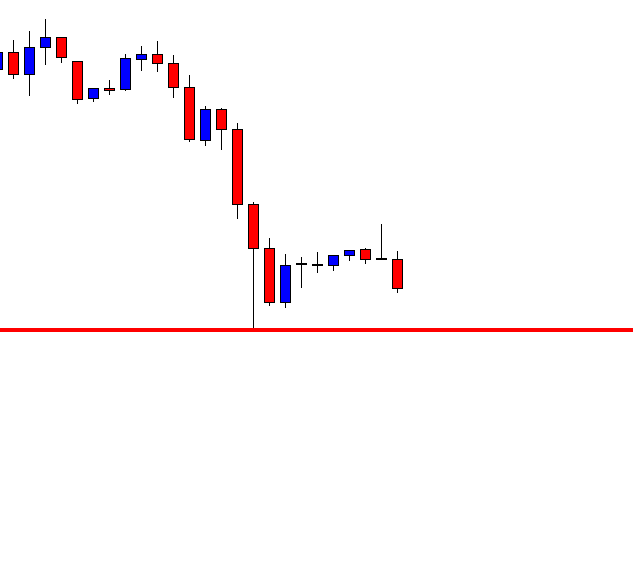
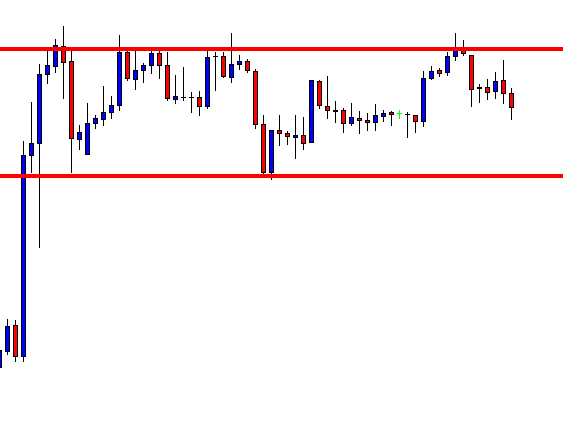
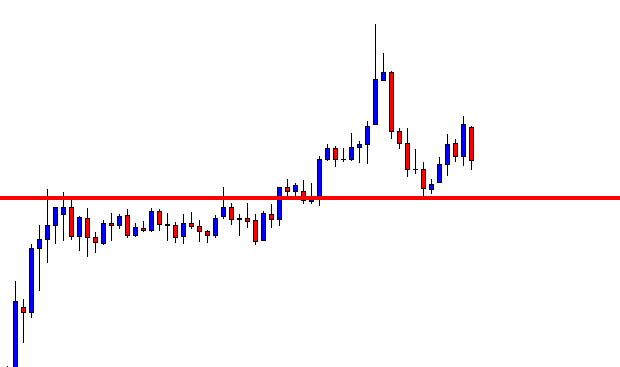
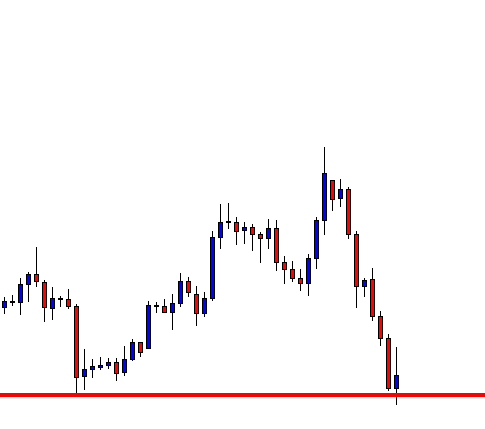
The pair produces two bullish candles consecutively to start its trading week. However, it produces a bearish engulfing candle and drives the price towards the South. Do you see anything here? Yes, the pair makes a breakout at the last week’s low. It means that the Bear may dominate on the H4 chart. Ideally, traders are to wait for the price to consolidate or make a bullish correction followed by a bearish breakout to go short in the pair.

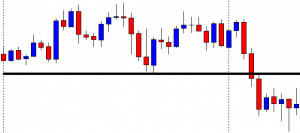
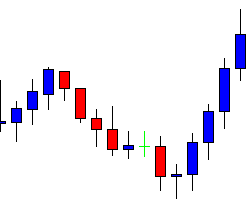
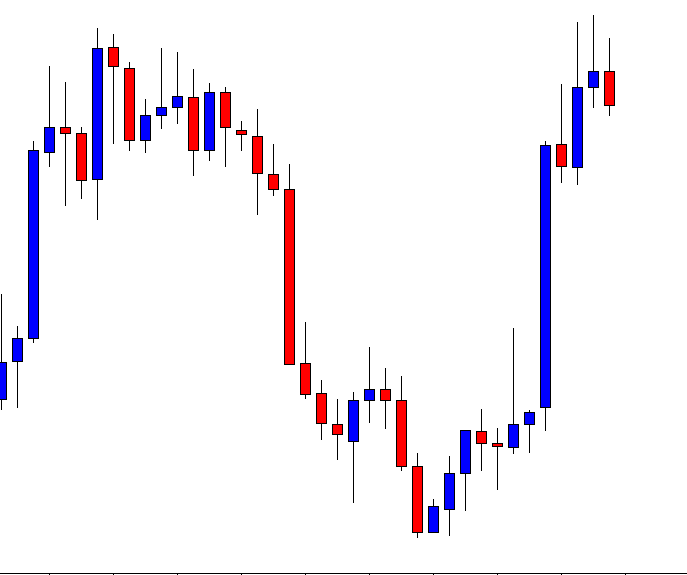
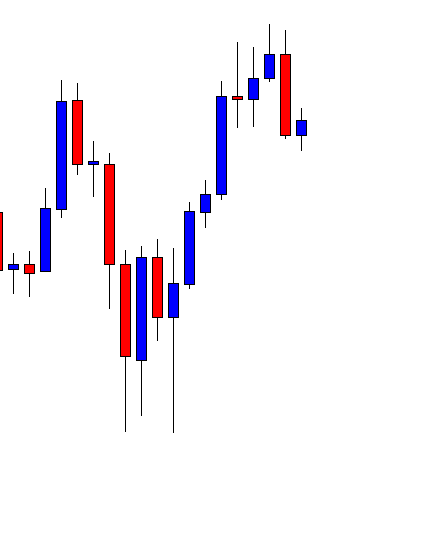
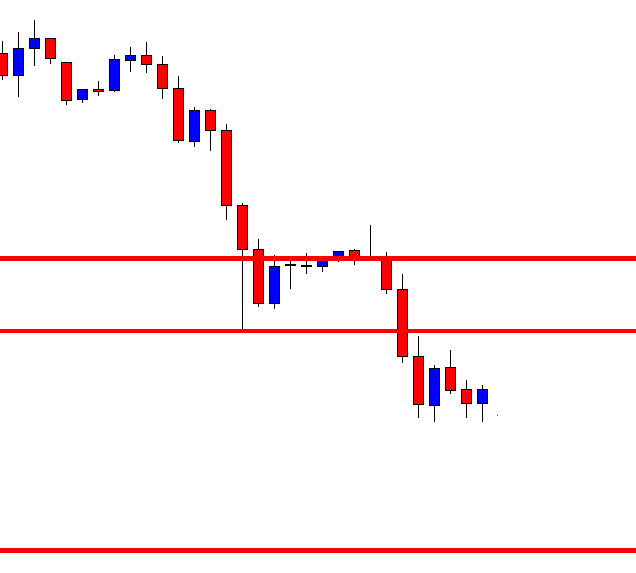
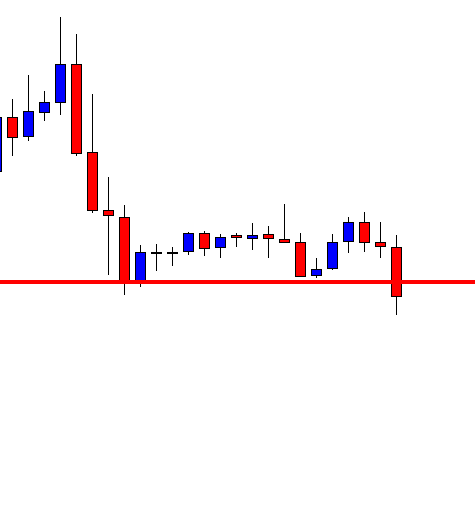
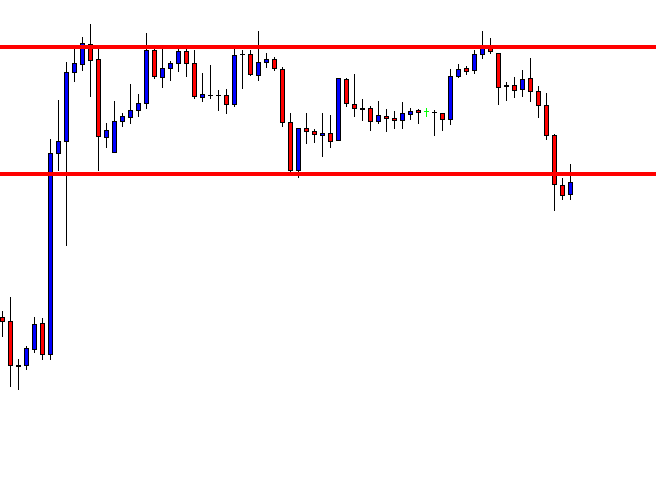
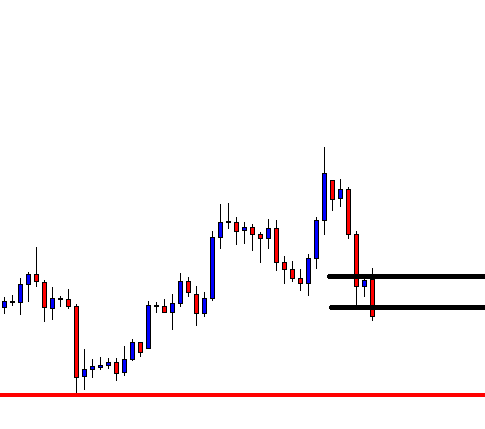
The price consolidates. It produces some bearish reversal candles such as spinning top, hammer, Doji candle. However, it does not make a breakout at the last swing low. The sellers must wait for an H4 candle to close below consolidation support. Let us wait for more and see what the price does.

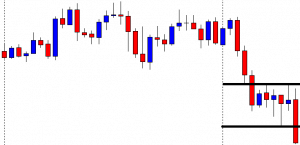
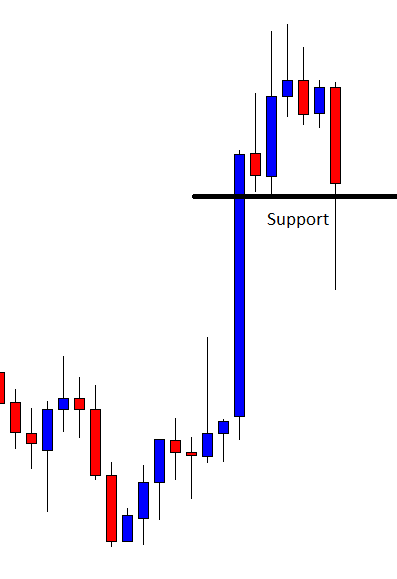
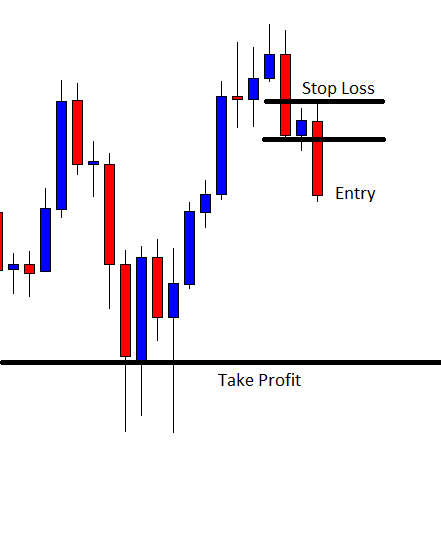
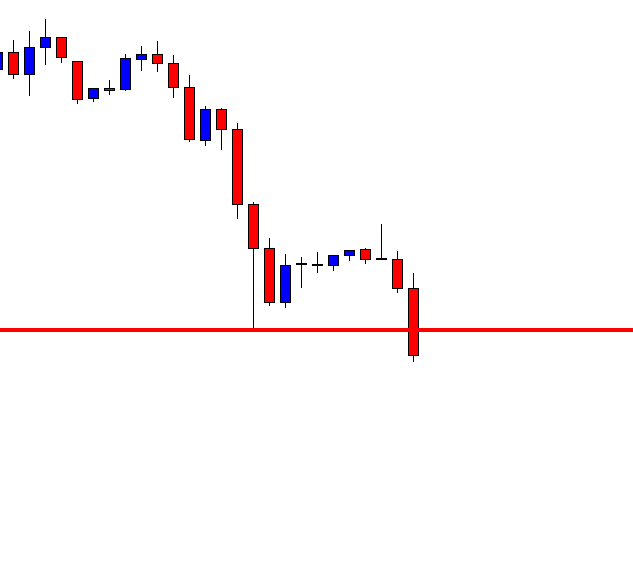
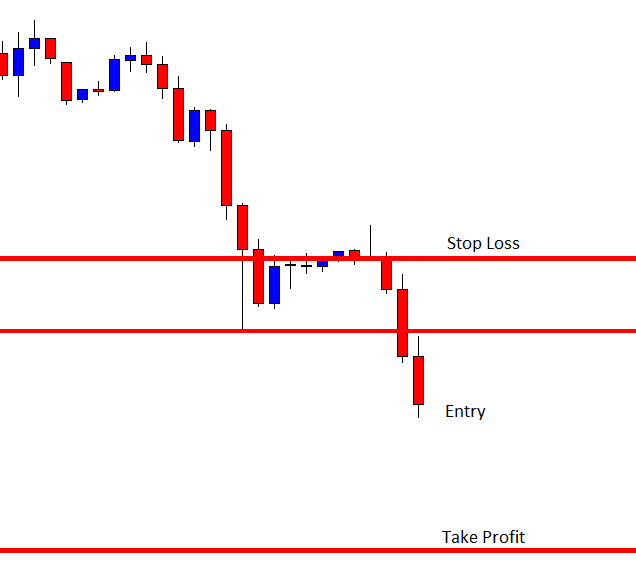
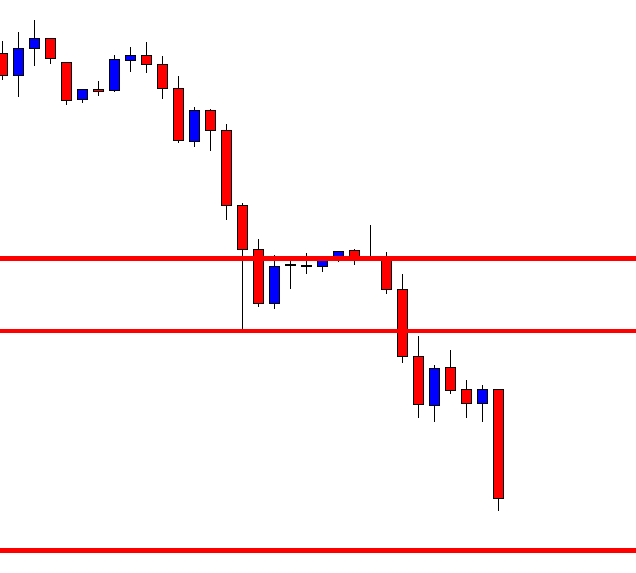
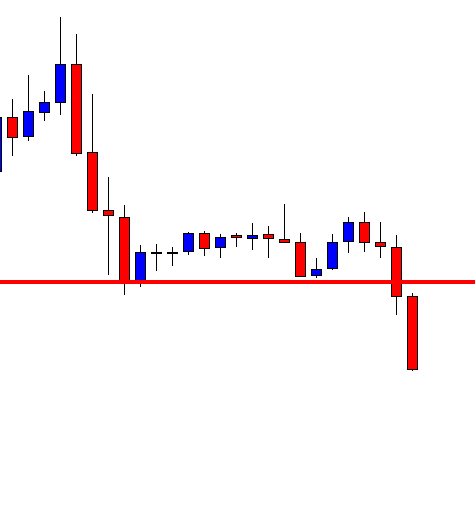
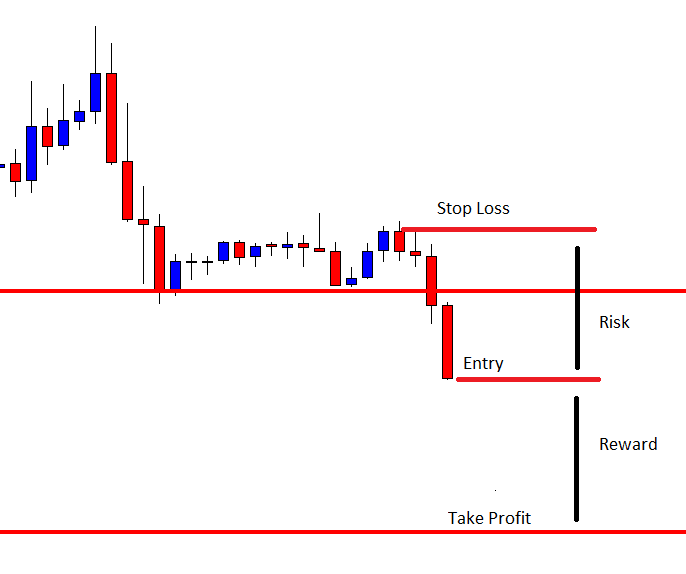
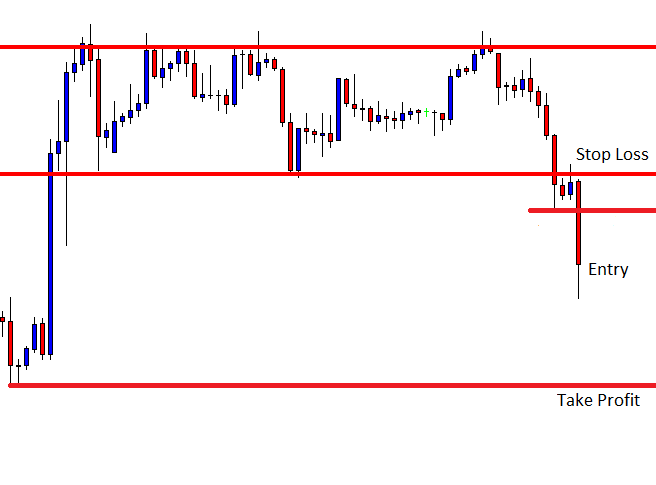
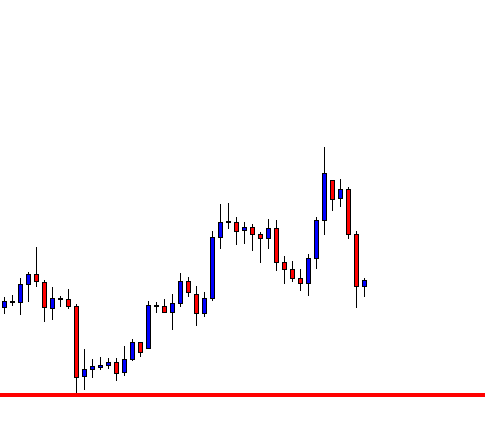
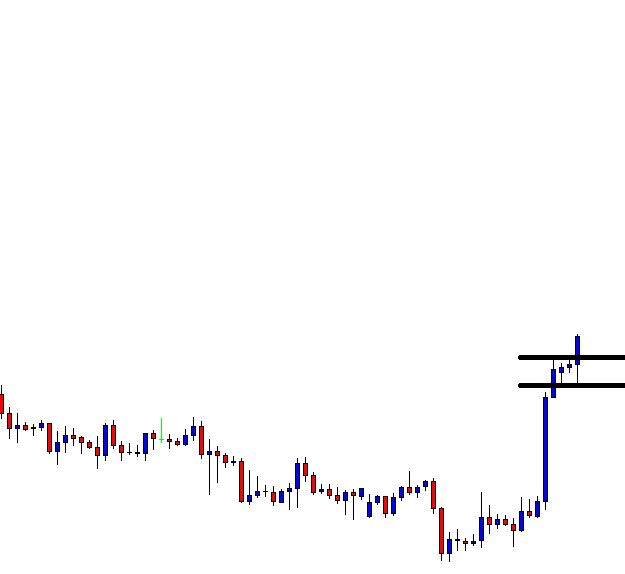
The chart produces a bearish engulfing candle closing well below consolidation support. The sellers may trigger a short entry right after the last candle closes. They may set their stop loss above consolidation resistance and set their take profit with 2R. This is the beauty of using weekly high/low and the H4 chart. It offers an excellent reward. Let us now proceed and find out how the entry goes.

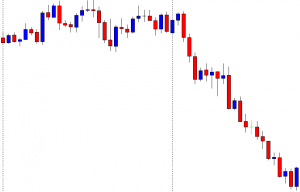
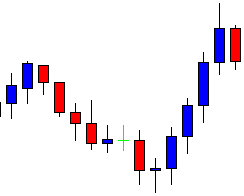
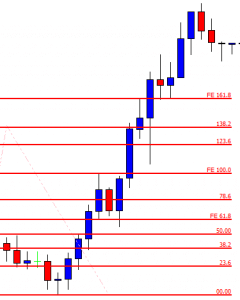
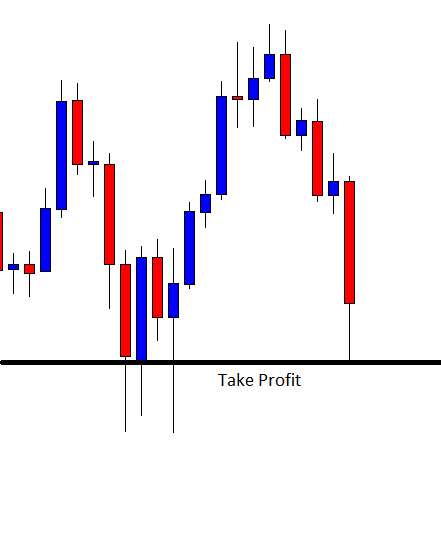
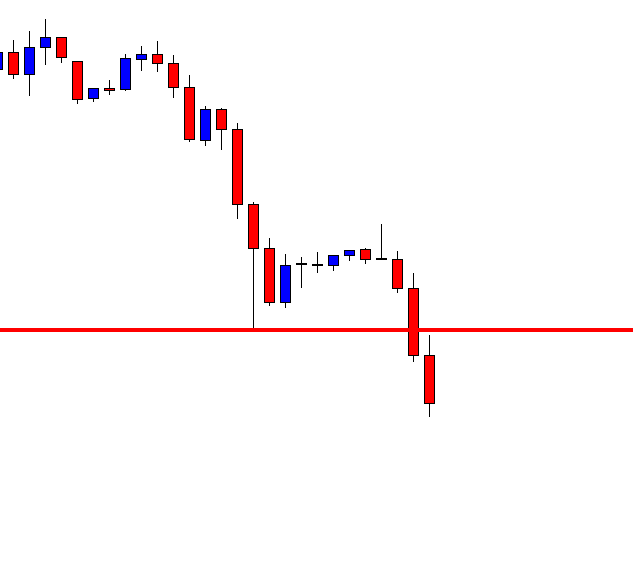
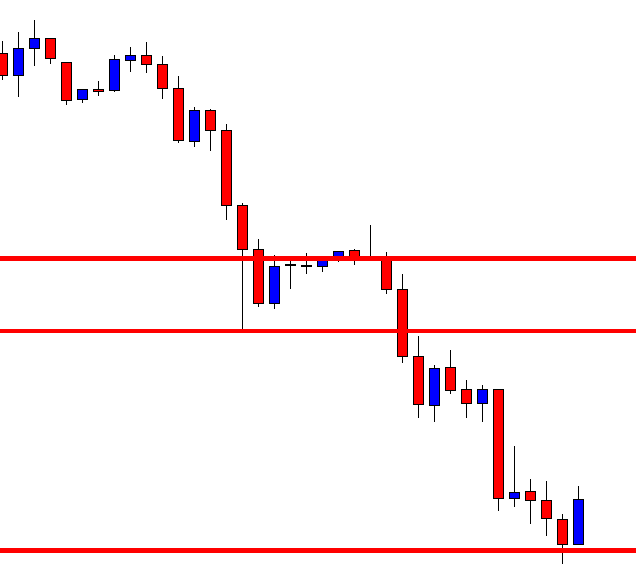
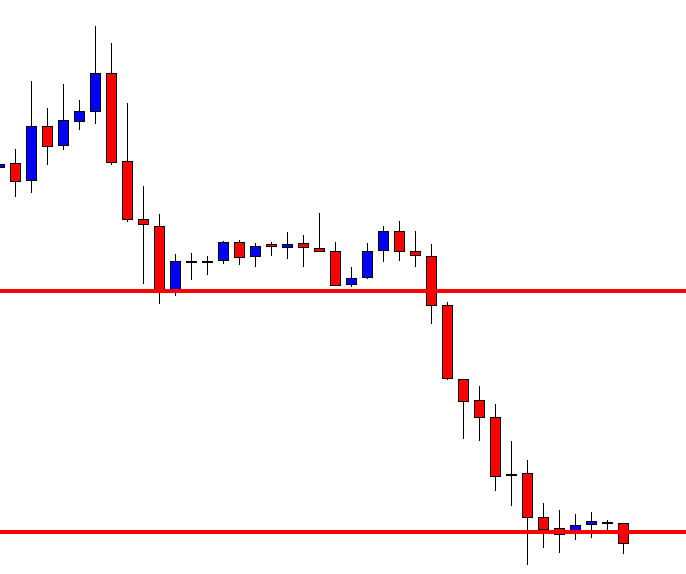
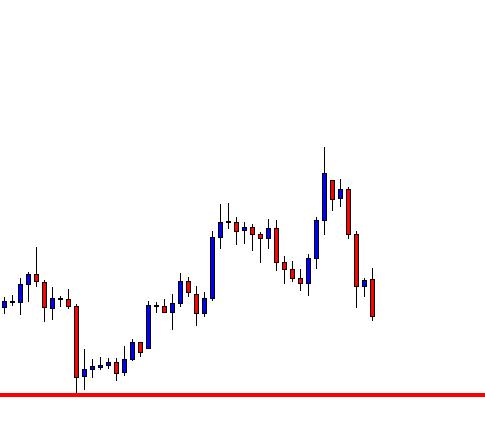
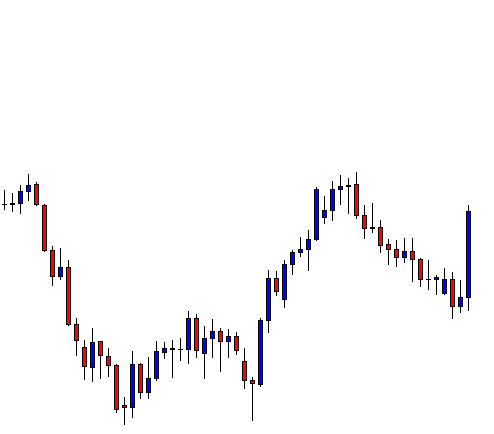
The price heads towards the South with good bearish momentum. It produces three bullish inside bars in this move. The last candle comes out as a bullish engulfing candle. The sellers may consider closing their entry and come out with the profit. If we count, we find that the entry offers more than 2R reward. This is what usually happens when the price makes an H4 breakout at the last week’s high/low. Deep consolidation and a strong reversal candle add more fuel to its journey as usual. In our fore coming lessons, we will learn to integrate Fibonacci levels in this strategy to determine our target with better accuracy. Stay tuned.

Categories
Forex Price Action

When Key Fibonacci Level Produces an Engulfing Candle

In today’s lesson, we are going to demonstrate an example of a chart that makes a strong bullish move upon producing a bullish engulfing candle at a key Fibonacci level. We know an engulfing candle creates good momentum. If it is created at a significant Fibonacci level, it often pushes the price towards the trend further than traders’ expectations. Let us see and find out what and how that happens.

It is an H1 chart. The chart shows that the price heads towards the South. It keeps making new lower lows. At the last bounce, the chart produces a Morning Star. It may make a bullish reversal now. Let us wait and see whether it makes a breakout at the last swing high or not.

The chart produces four consecutive bullish candles. The price breaches the last swing high. The buyers may wait for the price to consolidate around the breakout level and get a bullish reversal candle to go long in the pair.

It produces a bearish candle closing within the breakout level. The buyers may keep their eyes sharp to see how the next candle comes out. A bullish reversal candle followed by a breakout at the highest high is the signal to trigger a long entry. If the reversal candle comes out as a bullish engulfing candle closing above the resistance, the buyers may trigger a long entry right after the candle closes.

The candle comes out as a bullish engulfing candle closing well above the resistance. The buyers may trigger a long entry right after the candle closes. Since it is an H1 chart, Fibonacci levels come extremely handy to determine the take profit level. We find out that in a minute. At first, let us find out what the price does.

The price heads towards the North with extreme bullish momentum. It produces only one bearish candle and resumes its bullish journey. With naked eyes, we can tell that the price travels about 4R. It means as far as risk-reward is concerned, it is an excellent deal. Let us draw Fibonacci and see price trends from where to where.

The price makes the bullish reversal at 61.8% and heads towards the level of 161.8% in a hurry. It makes a breakout at 161.8% consolidates and resumes its bullish move. Ideally, the buyers should set their take profit at 161.8%. It would allow them to take 1:2 risk-reward. However, we have seen here that the price travels towards the North even further than that. It often happens when the reversal candle comes out as a bullish engulfing candle, and it is produced at the key Fibonacci level at 61.8%. We may not be too greedy but set our take profit at 161.8% in such cases. However, back in our mind, we know that we are dealing with an excellent trade setup.

Categories
Forex Daily Topic Forex Price-Action Strategies

Never Forget to Calculate Risk-Reward

Risk-Reward is an extremely important factor in Forex trading. The price often makes a reversal at a significant level of swing high/swing low. Thus, price action traders must emphasize those levels before taking any entry. By calculating risk-reward, they should only take entry once a trade setup is found lucrative as far as the risk-reward ratio is concerned. In today’s article, we are going to demonstrate an example of a trade setup, which looks good with candlestick patterns and price action. However, things do not go as it usually goes. We try to find out the reason behind it.

After being bearish for quite a while, the chart heads towards the North by producing a bullish inside bar. The chart presents a strong bullish candle followed by a corrective candle. This is what price action traders wait for. Ideally, they are to wait for a bullish engulfing candle closing above the consolidation resistance to go long on the pair. Do not miss the drawn level, which is the last significant swing high.

Here it comes. The chart produces a bullish engulfing candle closing well above the consolidation resistance. Some traders may think that they shall trigger a long entry right after the last candle closes. We must not forget that it is not only about candlestick and breakout. There is another factor, which is risk-reward. The reward does not look good comparing to the risk.

The next candle does not disappoint the buyers (if there are some). However, it gives a strong message that the level of resistance has gone stronger. The price may make a reversal. Let us find out what the price does next.

The next candle comes out as a bearish engulfing candle. This is one of the strongest bearish reversal candles. Since a significant level of resistance produces the candle, the sellers are getting ready to go short on the pair upon a bearish breakout. Those who took a long entry earlier, their trade is in great danger.

The next candle comes out as a bearish candle having a strong bounce at the level of last support. It must have swept away buyers’ stop loss. The last candle does not make a bearish breakout and has a long lower shadow, which is not a good sign for the sellers as well.  However, the buyers have not been able to take advantage of such nice bullish price action. The Forex market could take any direction since there are technical as well as fundamental aspects. Nevertheless, if we are to find one valid reason for the bearish reversal, it most probably is risk-reward.

Categories
Forex Daily Topic Forex Price-Action Strategies

Trading on the Daily Chart More Rewarding Than It Looks

Trading on the daily chart is very rewarding as well as hassle-free comparing to intraday trading. Trade management is different since it allows enough time for the traders to make a decision about their positions. This often allows the traders to earn more pips. In today’s article, we are going to demonstrate an example of price action trading on the daily chart, which allows the traders to hunt some extra pips. We find out how traders do it.

This is a daily chart. It shows that after being bullish for seven trading days, it produces a bearish engulfing candle. The Bearish engulfing pattern is one of the strongest bearish reversal patterns. The sellers are to wait for the price to consolidate and give them a level of resistance where they set Stop Loss above to ensure better risk-reward.

This is what the sellers want to see. The chart produces a bullish inside bar, which states that the sellers may take over the control upon getting another bearish engulfing candle closing below the level of support.

Look at the last candle. It comes out as a bearish engulfing candle closing below the level of consolidation support. The sellers may trigger a short entry right after the candle closes by setting the stop loss above the highest high of the signal candle. To set take profit, some traders may close the trade manually upon getting a bullish reversal candle; some may set at 1:1 risk-reward; some may set at the last significant lowest low. It depends on traders’ psychology and with the strategy (in terms of taking profit) they feel comfortable with.

The price consolidates with one more candle after triggering the entry. However, the price hits the target, which is set at the level of the significant lowest low. As mentioned, some traders may keep holding the position since the price is still with the bear. Let us proceed to the next chart and find out what the price does in the next candle.

It makes a breakout as well. The sellers holding the position may dream big. It seems the price may keep heading towards the South further. This is the good thing about trading on the daily chart. Traders get enough time to decide about their positions. They get 1:1 risk-reward in almost every trade. If they understand daily price action well and get well acquainted with daily trading, it usually gets them very lucrative risk-reward. Imagine, if traders want to manage trade like this on the H4 or the H1 chart, how painful it could be. Moreover, the H4 or the H1 chart is not as consistent as the daily chart. In our fore coming articles, we will demonstrate more examples of how we can maximize our profit by trading on the daily chart. Stay tuned.

Categories
Forex Daily Topic Forex Price-Action Strategies

Remember the Rule ‘Set and Forget’

In today’s lesson, we are going to demonstrate an example of H1 breakout trading. Usually, in this strategy, the price goes towards the direction with good momentum if things go accordingly. In this example, the breakout candle, breakout confirmation candle are immaculate, but it takes a long pause before it hits the target. It has a lesson to give us. Let us dig into this.

The price after being bearish finds its support. It consolidates for a while and produces a bearish pin bar followed by a bearish engulfing candle. Traders are to wait for a breakout at the level of support to get them prepared to go short on the pair.

The last candle breaches the level of support and closes well below the level. The candle is having a tiny lower spike. Ideally, H1 breakout strategy traders wait for such a breakout candle.  They are to wait for the next H1 candle to close below the breakout candle. If that happens, the game is on. Let us proceed to the following chart.

As expected, the next candle closes below the breakout candle. The candle looks very bearish, being an ideal candle to confirm the breakout. The sellers may trigger a short entry right after the last candle closes. Let us have a look at the same chart with some calculations in it.

The sellers may set the level of stop-loss above the level where the trend is initiated. They may set the take-profit level with 1:1 risk-reward. It means

Entry- Stop Loss= Take Profit-Entry.

The price consolidates after the signal candle. It bounces at the level, where it bounced some hours earlier. This is the first sign of a double bottom. It looks the buyers may take over the control, which may make the price hit the stop loss. You may remember, in one of our lessons, it has been recommended that a trader may have to close his entry manually. It was an example of the Friday market. Today’s market is not the Friday market. Thus, we must not close it manually, as it may get us a loss, but we must let it run. Let us wait and see how it ends.

It looks much better now. The price heads towards the South with good bearish momentum. It may not take much time to hit the target.

It does not go according to your calculation. It takes much longer than our expectations. However, it hits the target at last. The lesson that we have learned here is we must let a trade run to do its bit. Once we take entry after measuring the risk-reward, we must be patient. In a word, we must remember the rule ‘set and forget.’

Categories
Forex Price-Action Strategies

When Things Go Like This

In today’s lesson, we are going to demonstrate an example of H1 breakout trading. We have come to know that it is an excellent trading strategy. It offers 1:1 risk-reward but maintains a tremendous winning consistency. However, the H1 chart is to maintain some attributes to offer us entry with the strategy. Today’s example is one of the ideal charts with those attributes. Let us have a look.

The chart shows that the price gets caught within two horizontal lines. The last candle comes out as a bearish Marubozu candle. Thus, It may be the beginning of a new bearish trend. Traders must wait for the price to continue its bearish move and make a breakout at the level of support.

The price continues its bearish move. The last candle comes out as a strong bearish candle closing below the level of support. It is an explicit breakout. Here comes the trickiest part of this strategy. Traders must wait for the next candle to close below the breakout candle. Let us find out what the price does in the next chart.

Look at the confirmation candle. This is one good-looking bearish candle. Traders shall look for such candle for the breakout and breakout confirmation to trade with H1 breakout trading. A short entry may be triggered right after the last candle closes. Let us find out the level of Stop Loss and Take Profit.

Measure the difference between Stop Loss to Entry and set the Take Profit at the level with the same distance. In a word, it gives us 1:1 risk-reward. It often travels more, but usually, the price consolidates after hitting the target with 1:1 risk-reward. Let us proceed and find out how the trade goes.

The price heads towards the Take Profit level with extreme bearish momentum. The level where we set Take Profit, the price seems to be making another breakout. It looks the sellers still have the controls. However, as far as H1 breakout trading is concerned, the sellers are out with the profit.

You might have noticed that after the breakout confirmation, how the price heads towards the South. It does not take any pauses. We must not be certain about the reasons since it is the Forex market. However, if we consider

  1. The trend initiating candle
  2. The breakout candle
  3. The breakout confirmation candle

We see that three of these candles have all the attributes that the sellers look for in an ideal bearish market. In a bullish market, it is vice versa. If things go like this, H1 breakout trading is one of the most consistent winning strategies. In most cases, the price hits the target as we have demonstrated the example in today’s lesson.

Categories
Forex Price-Action Strategies

The Better the Risk-Reward, the More the Opportunities

Risk-Reward is an extremely important factor in price action trading. The price action of a chart is related to risk-reward to some extent. In today’s lesson, we are going to reveal an example of that. Despite the daily chart producing a bearish reversal candle, the H4 traders do not get the opportunity to take an entry. However, something interesting happens afterwards. We find that out in a minute.

This is the daily chart. The chart shows that it produces a bearish inside bar, which is a not a strong bearish reversal candle. Nevertheless, a good consolidation and a bearish engulfing candle on the H4 chart may attract the sellers to go short on the pair. The nearest support is not too far. However, if we flip over to the H4 chart, we will be able to find out whether it offers a 1:1 risk-reward or not.

This is the H4 chart. The chart shows that if it starts consolidating now, it may offer 1:1 risk-reward (depending on the breakout candle). Thus, sellers may wait for a consolidation and an H4 bearish engulfing candle to make some green pips.

It does not consolidate but keeps going towards the South. The sellers on the minor charts may have found some short entries earlier. Since we are dealing with the daily-H4 combination, we may not shift our concentration on the minor charts of this pair. Do you notice one thing? Concentrate and try to find an interesting thing about the chart. The interesting fact about the chart is it has made a breakout on the H4 support. It consolidates and seems to have obeyed the breakout level. A bearish engulfing candle may attract the price action sellers to go short. Have a look at the chart below.

Here it is. A bearish engulfing candle breaches the consolidation support. Look at the red marked take profit level. In naked eyes, it offers an excellent risk-reward. As far as the daily-H4 chart combination trading is concerned, the pair may head towards the take profit level with good bearish momentum. Let us find out how the trade goes.

As expected, the price heads towards the downside and hits the take profit with ease.

On the first occasion, the price neither consolidates nor offers an entry. On the second occasion, it consolidates nicely and produces an ideal bearish engulfing candle to offer a short entry with an excellent risk-reward. I am not saying that it never offers an entry on such occasions (first occasion). Risk-reward attracts more traders. Thus, if there is a better risk-reward, most likely, there is more opportunity for traders.

Categories
Forex Daily Topic Forex Price-Action Strategies

Don’t Only Rely on Your Initial Assumption, Dig into It

In today’s article, we are going to demonstrate an example of an entry, which is derived from the daily-H4 chart combination. It is a typical entry once we flip over to the H4 chart. Before flipping over to the H4 chart, there is a good lesson, which may help us in the future. Let us get started.

This is a daily chart. It shows that the price, after having a bounce, heads towards the upside. It finds its resistance and produces a bearish marubozu candle. The combination of the last two candles is also known as track rail. It is a strong bearish signal. Usually, the daily-H4 combination traders may want to flip over to the H4 chart to hunt an entry. However, the level of support seems too adjacent to offer a short entry. In naked eyes, the daily chart shows that there is very little space for the price to travel towards the South. Is it? Let us flip over to the H4 chart and reveal the truth.

This is the H4 chart. It shows that the price is on consolidation, searching for its resistance already. The level of support is far enough to offer some handful of pips to the sellers.

The chart produces a bearish engulfing candle closing below the last swing low. The sellers may trigger a short entry right after the candle closes. Let us not just guess it. Let us measure it by drawing two horizontal lines.

These two lines determine the stop loss and entry-level. The drawn support is far enough to offer excellent risk-reward. If you are not sure, measure it with the tool on the trading platform. The risk-reward is 1:1.5 here. Let us now find out the result.

The price heads towards the level of support and produces a bullish reversal candle as well. The sellers have grabbed some green pips. The consolidation, the signal candle, and the risk-reward are perfect here. Do you remember how it begins, though? The daily chart does not look that appealing at the very outset despite producing an excellent daily bearish reversal candle. In naked eyes, it looks bad. However, once we have flipped over to the H4 chart, it is a different story. It looks very appealing, and in the end, it offers an excellent entry. In the beginning, do not just skip a chart by its outlook. Dig into it. The habit of digging may get you more entries.

Categories
Forex Daily Topic Forex Price-Action Strategies

An Entry Derived From an Unusual Consolidation

Price action traders love to see the price consolidates and makes a breakout towards the trend direction. Consolidation offers better risk-reward as well as a better chance of winning a trade. In today’s lesson, we are going to demonstrate an example of a consolidation, which is rather unusual. Let us proceed.

This is a daily chart. The chart shows that the price produces a bullish engulfing candle at a flipped level of support. The daily-H4 chart combination traders may flip over to the H4 chart for the price to consolidate and a bullish breakout to go long on the pair. Let us flip over to the H4 chart.

The H4 chart shows that the price heads towards the North by producing bullish candles consecutively. The buyers shall wait for the price to find its support, consolidates, and makes a bullish breakout. Let us proceed to the next chart.

The chart produces another candle, which has a bullish body. In naked eyes, it is a bullish candle, but it is not. It is an Inside bar, which closes within the level of resistance. Let us have a look at the next chart.

The next candle has a little bullish body as well. Many traders may think that the price is still with the bull. Do not get trapped here. The candle closes within the level of resistance again. The price has not found its support yet. However, it has been on a tricky consolidation.

Look at the last candle, which closes above the level of resistance. The price bounces at the level where the first candle (Inside Bar) bounced. Since a bullish engulfing candle breaks the level of resistance, technically traders may trigger a long entry right after the candle closes. Let us proceed to the next chart to find out how the trade goes.

The price keeps heading towards the North for two more candles. As it seems, it may go towards the North further. An unusual consolidation and an explicit breakout seem to work wonderfully well for the buyers here. We usually see that price consolidates by producing bearish candles on a bullish market and vice versa. In this example, we have seen that the price may consolidate by producing inside bars as well. An Inside bar/s may confuse us. It may make us think the price is not on consolidation. Now we know consolidation sometimes may look different. However, it works as well as usual consolidation.