
In today’s article, we are going to demonstrate an example of an entry, which is derived from the daily-H4 chart combination. It is a typical entry once we flip over to the H4 chart. Before flipping over to the H4 chart, there is a good lesson, which may help us in the future. Let us get started.

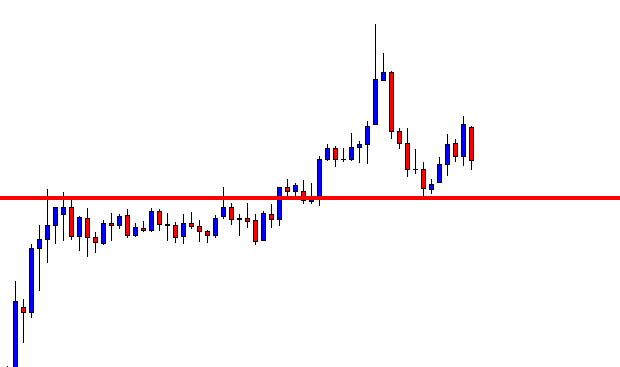
This is a daily chart. It shows that the price, after having a bounce, heads towards the upside. It finds its resistance and produces a bearish marubozu candle. The combination of the last two candles is also known as track rail. It is a strong bearish signal. Usually, the daily-H4 combination traders may want to flip over to the H4 chart to hunt an entry. However, the level of support seems too adjacent to offer a short entry. In naked eyes, the daily chart shows that there is very little space for the price to travel towards the South. Is it? Let us flip over to the H4 chart and reveal the truth.
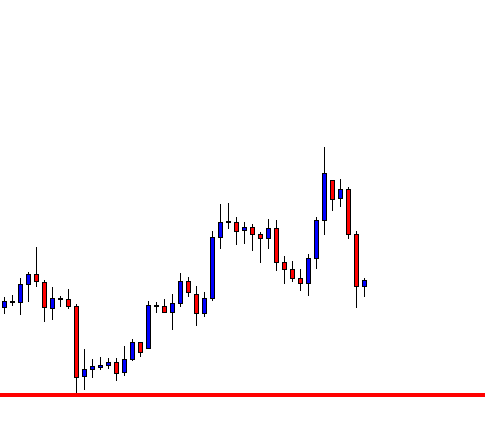
This is the H4 chart. It shows that the price is on consolidation, searching for its resistance already. The level of support is far enough to offer some handful of pips to the sellers.
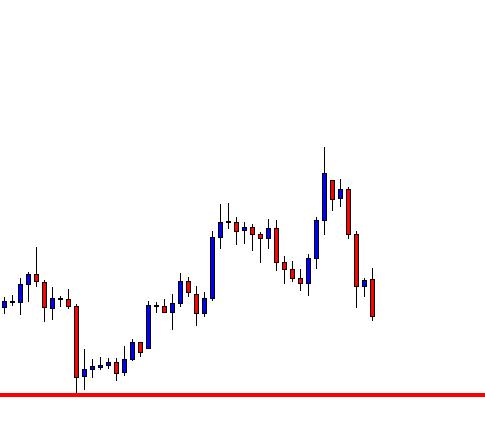
The chart produces a bearish engulfing candle closing below the last swing low. The sellers may trigger a short entry right after the candle closes. Let us not just guess it. Let us measure it by drawing two horizontal lines.
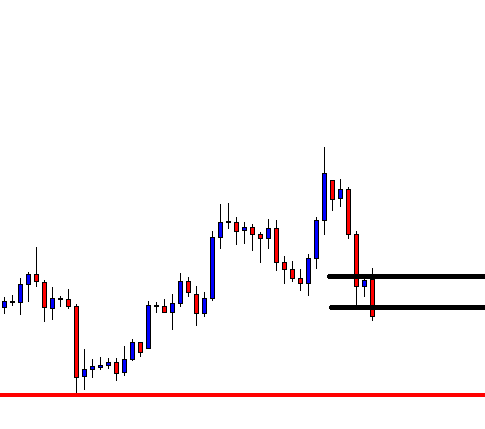
These two lines determine the stop loss and entry-level. The drawn support is far enough to offer excellent risk-reward. If you are not sure, measure it with the tool on the trading platform. The risk-reward is 1:1.5 here. Let us now find out the result.
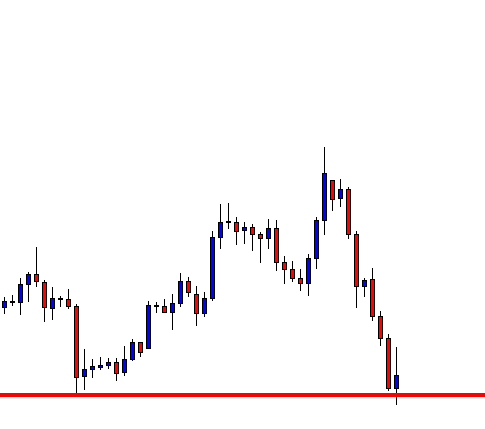
The price heads towards the level of support and produces a bullish reversal candle as well. The sellers have grabbed some green pips. The consolidation, the signal candle, and the risk-reward are perfect here. Do you remember how it begins, though? The daily chart does not look that appealing at the very outset despite producing an excellent daily bearish reversal candle. In naked eyes, it looks bad. However, once we have flipped over to the H4 chart, it is a different story. It looks very appealing, and in the end, it offers an excellent entry. In the beginning, do not just skip a chart by its outlook. Dig into it. The habit of digging may get you more entries.