Categories
Forex Price-Action Strategies

A Thing You May Notice in the H1 Breakout Strategy

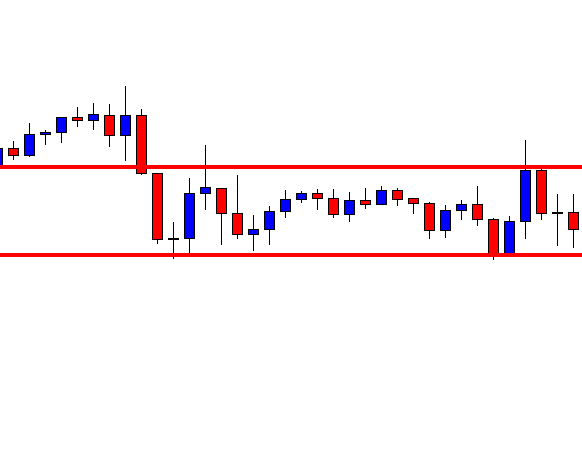
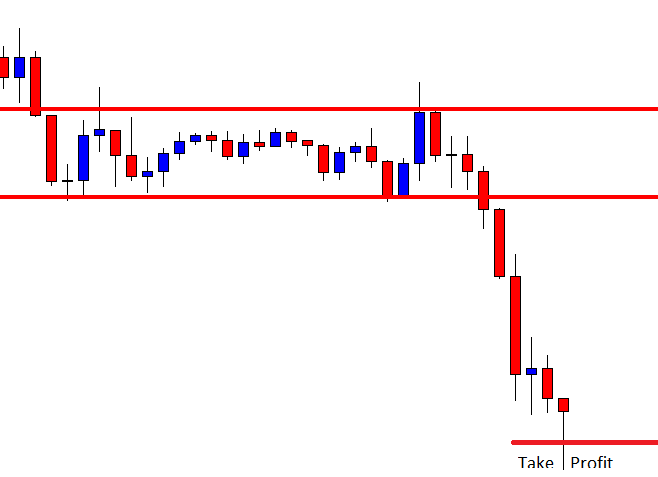
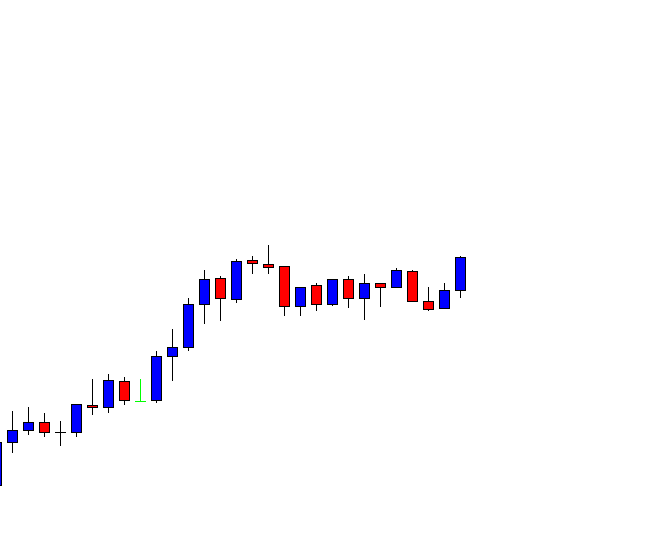
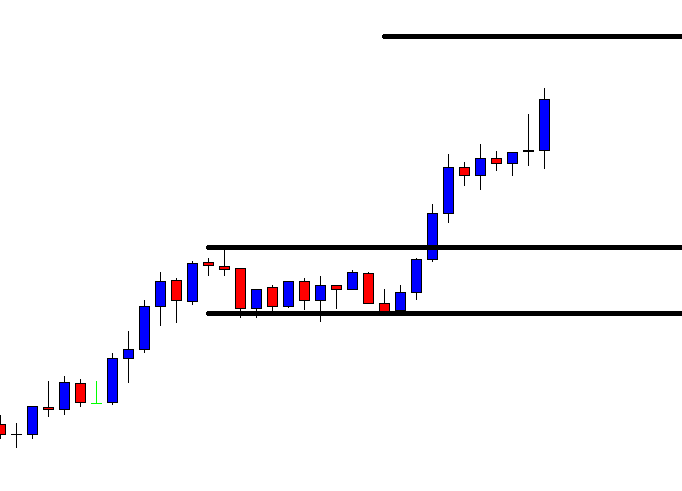
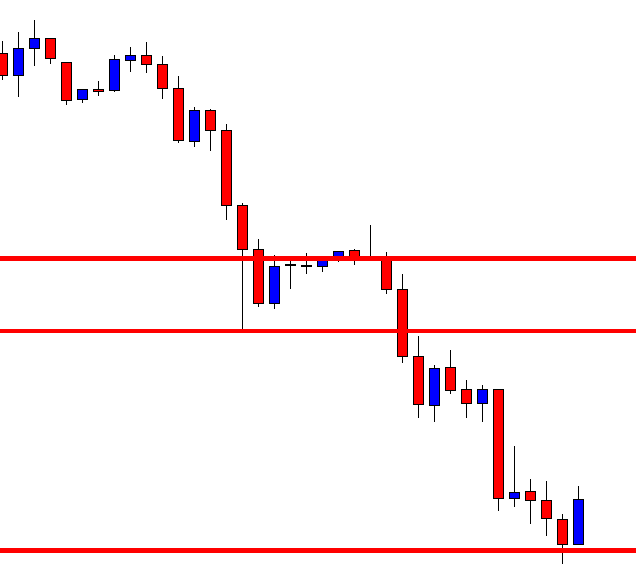
We are going to demonstrate an example of the H1 breakout strategy in today’s lesson. Usually, the H1 breakout strategy does not make traders wait too long to hit the target. However, if the breakout level is a double top or a double bottom level on the H4 chart, the price gets even more momentum to hit the target. Today’s breakout level is a double bottom level on the H4 chart. Let us now find out what happens after the breakout.

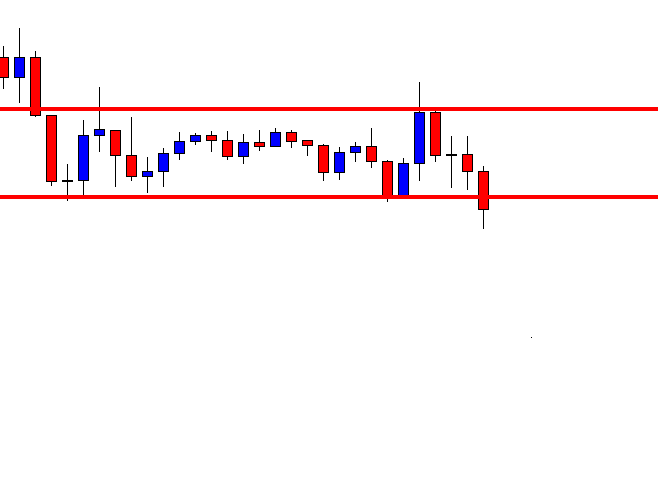
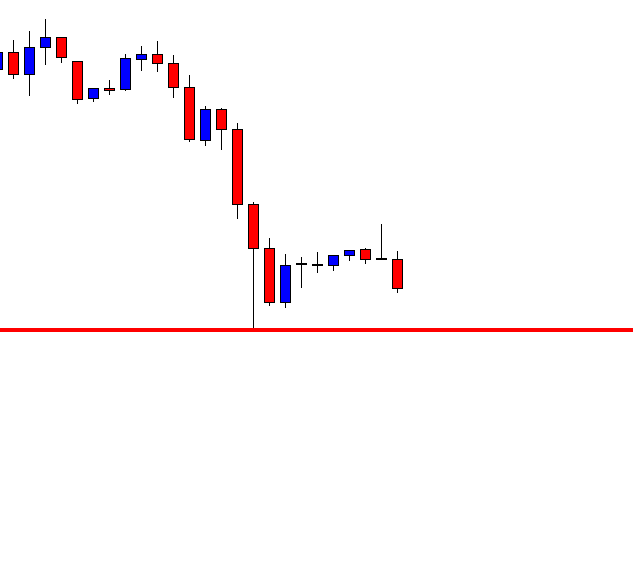
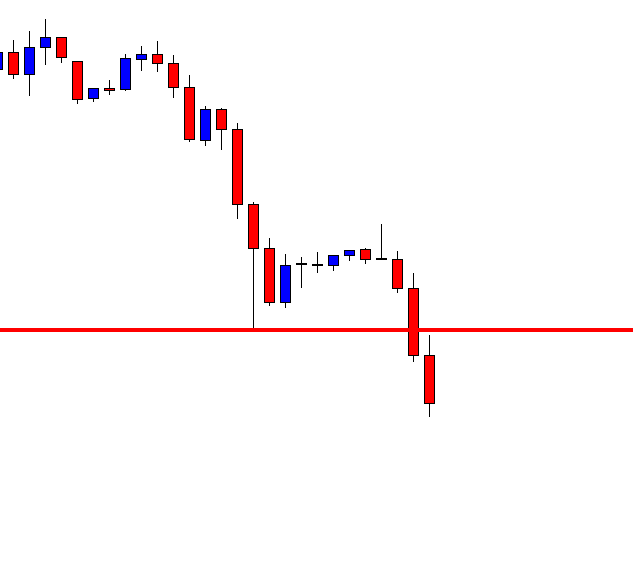
After making a bearish move, the price makes a correction. The last candle on the chart comes out as a bearish engulfing candle. This means the price finds its resistance. If it heads towards the swing low and makes a breakout, price action sellers may jump into this chart to make some green pips by going short in the pair.

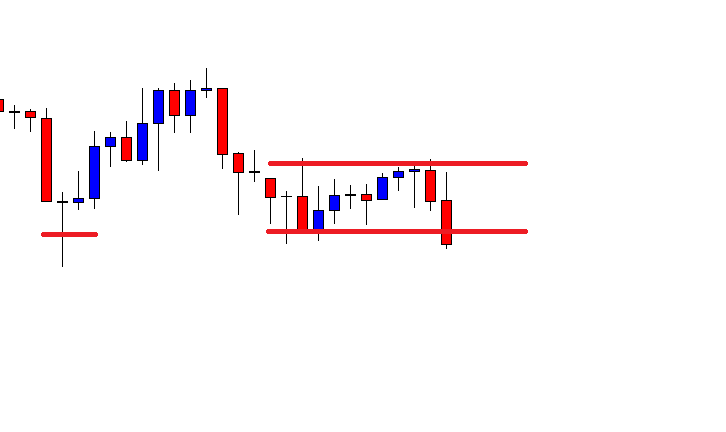
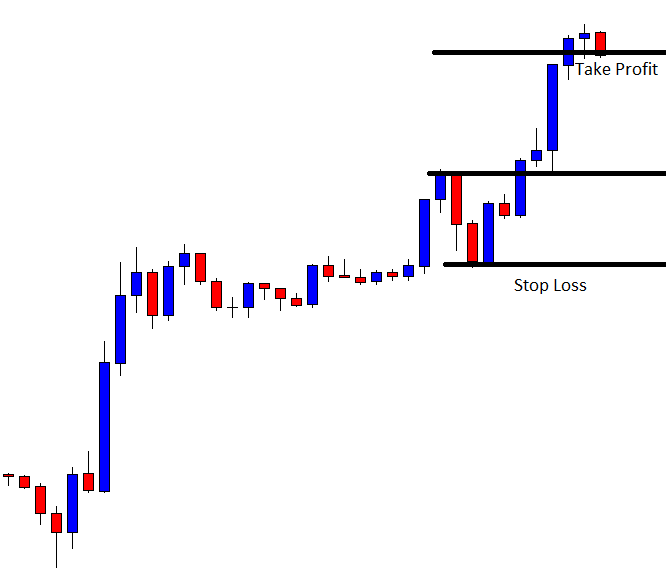
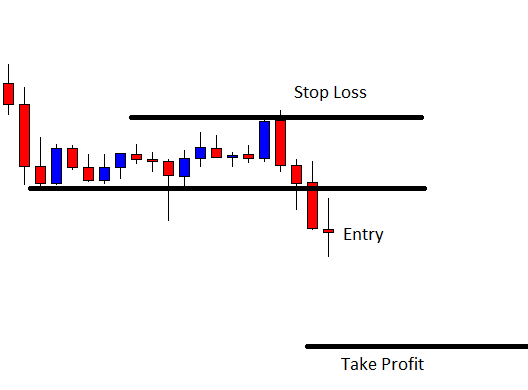
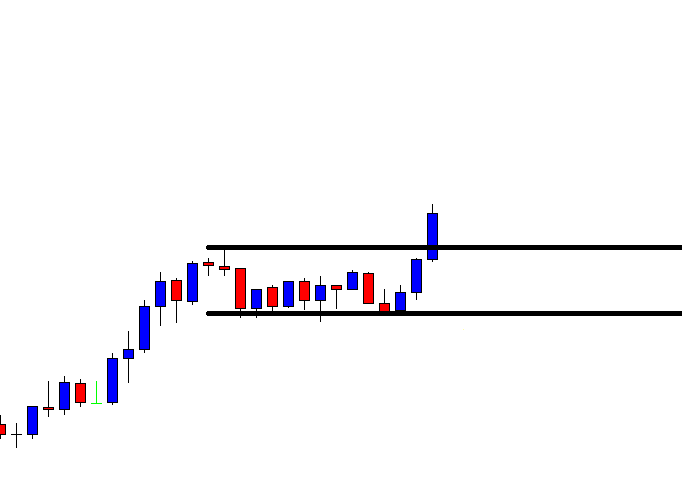
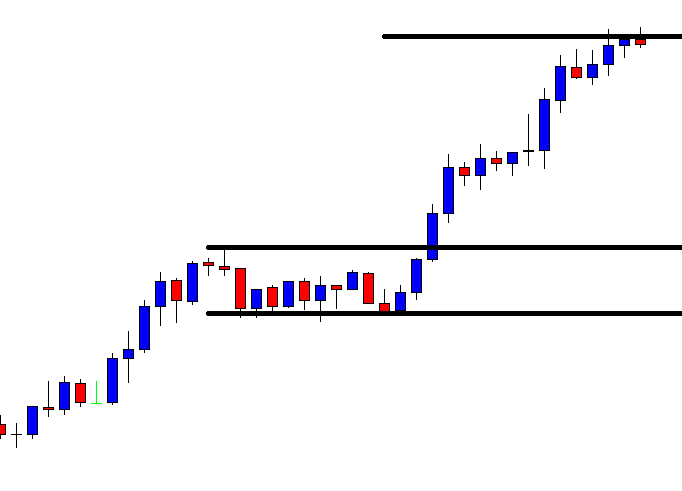
The last candle makes a breakout at the level of support. This is an explicit breakout. Please note that the price bounces at the same level earlier. This means this is a double bottom support level on the bigger chart. This is an H1 chart. Thus, this must be a double bottom support level of the H4 chart.

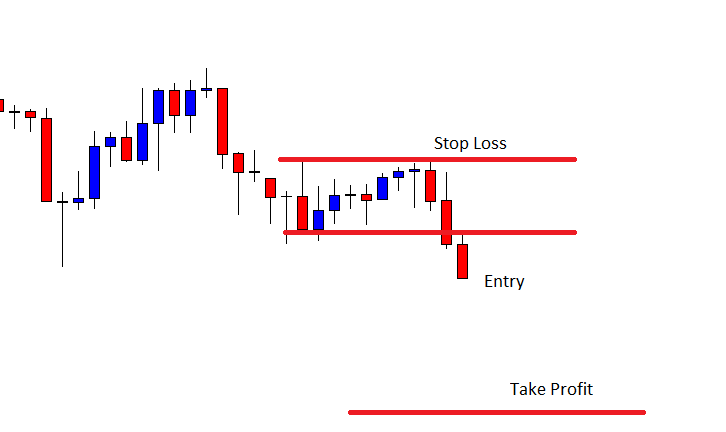
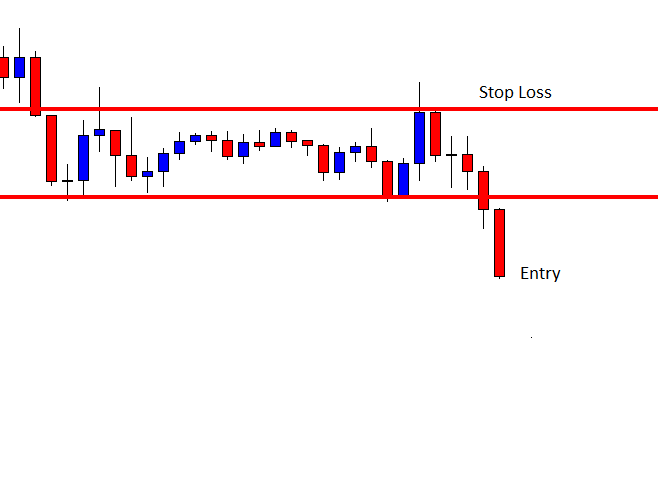
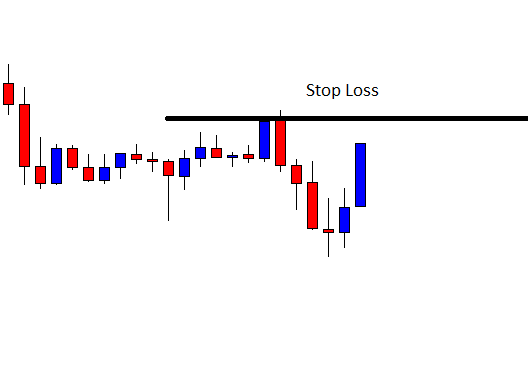
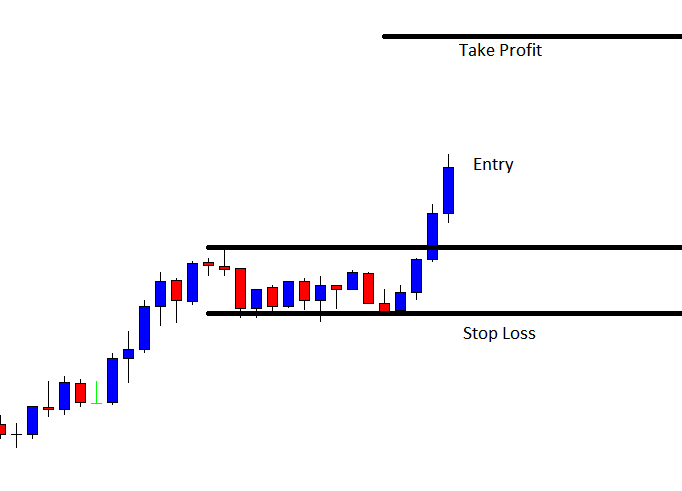
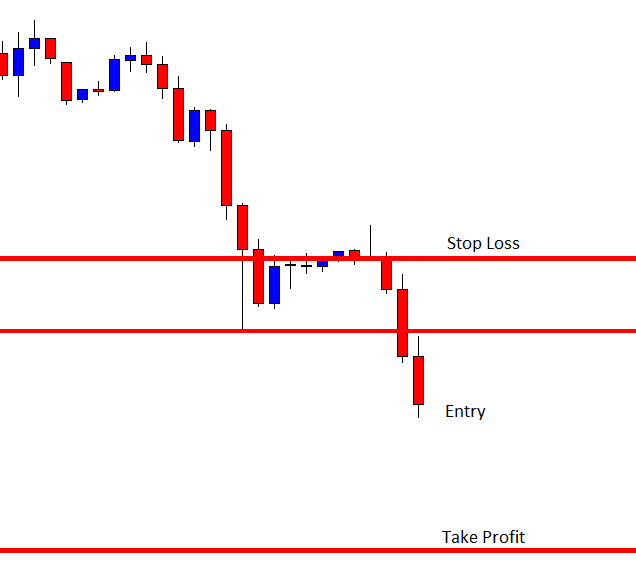
The next candle closes below the breakout candle. It confirms the breakout. The sellers may trigger a short entry right after the last candle closes by setting stop-loss above the level where the trend starts and setting the take profit with 1R.

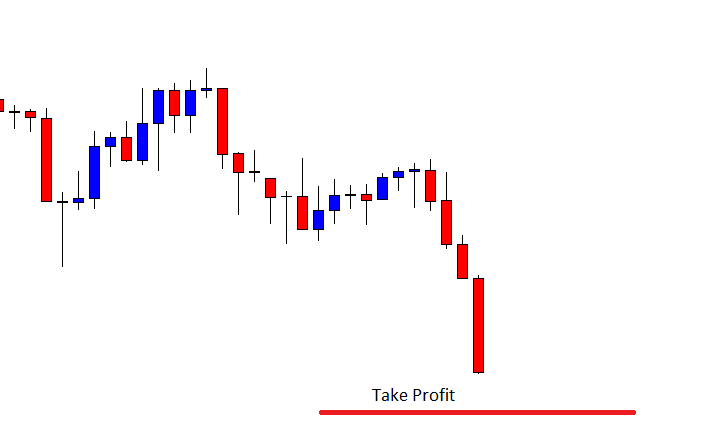
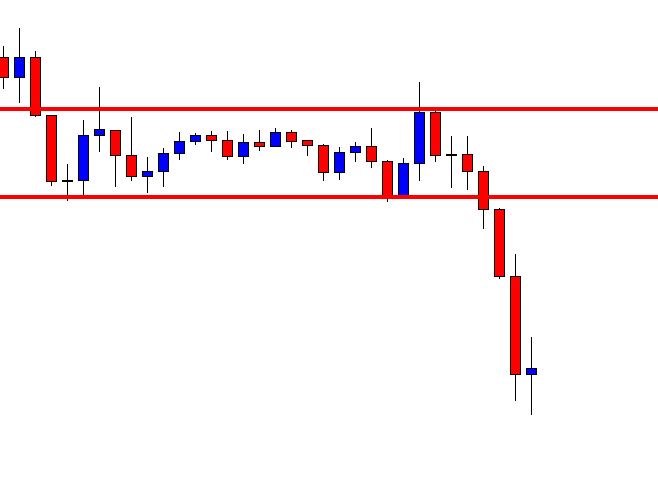
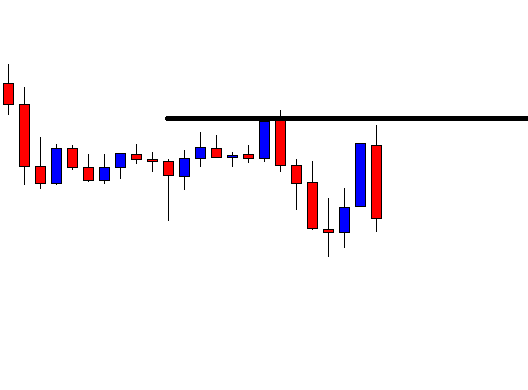
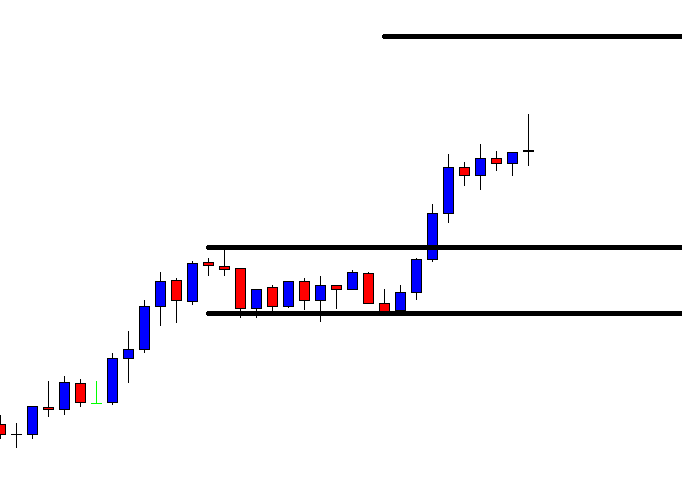
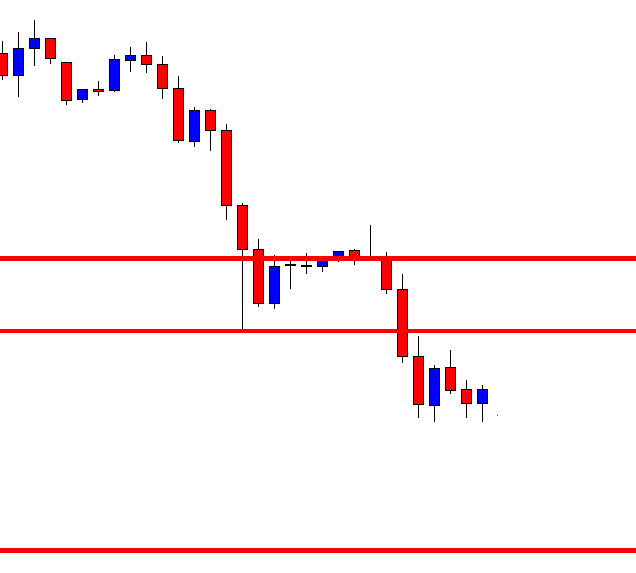
The price heads towards the South with extreme pressure. The price is about to hit the target on the next candle after triggering the entry. It does not, but the sellers get their message. A strong bearish candle like this suggests that the pair would remain bearish at least for two more candles. That would be enough to hit the target.

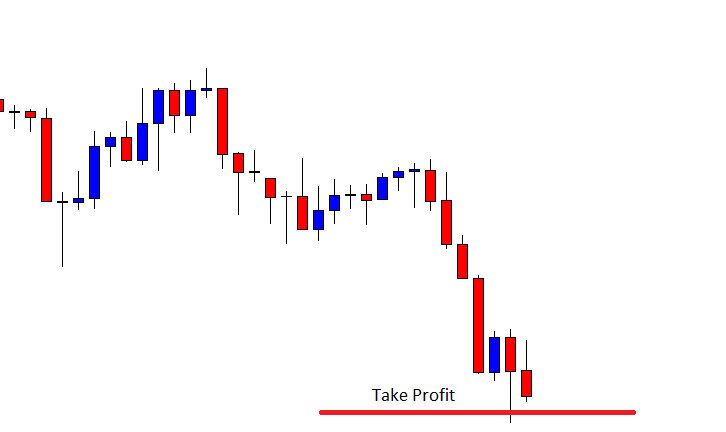
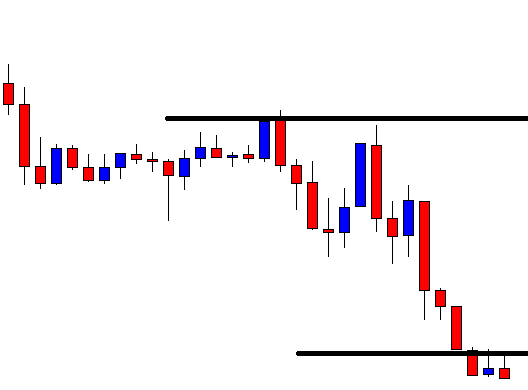
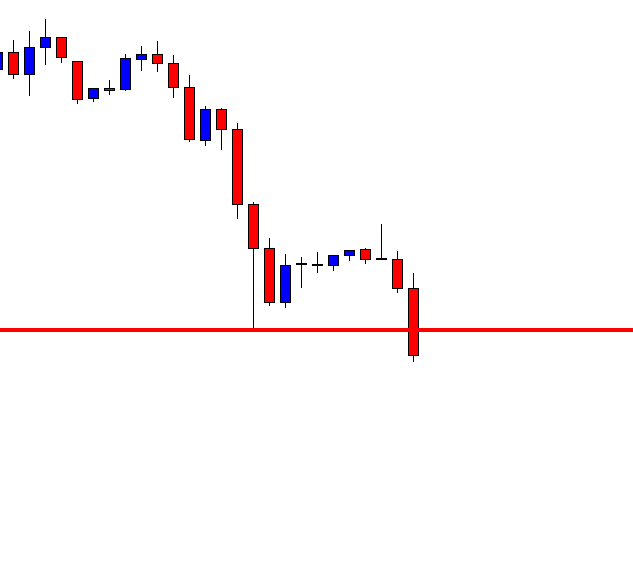
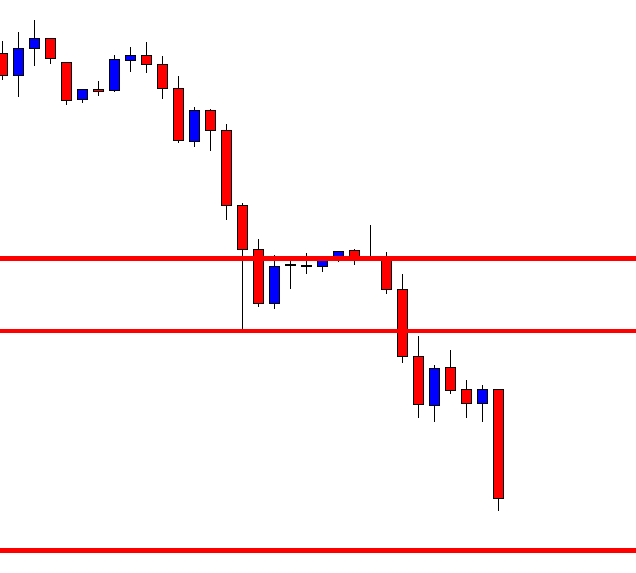
The chart produces a bullish inside bar before hitting the target. If we count, it takes only three candles to hit take profit level. As mentioned, the H1 breakout strategy hits take profit level in a hurry. So does this one. If we calculate the next candle after the signal candle, we see that the candle comes out as a very strong bearish candle and generates strong bearish momentum. This is often seen when the H1 chart makes a breakout at a level, which is a double top or double bottom level on the H4 chart too. We do not need to concentrate on this if we aim to trade on the H1 breakout strategy. However, noticing such things help us be better traders to some extent.


Categories
Forex Daily Topic Forex Price-Action Strategies

Manage Your Trade Differently on Different Charts

In today’s lesson, we are going to demonstrate an example of an H1 breakout strategy. Before hitting the target, at some point, the price gets sluggish. Nevertheless, it hits the target in the end. Let us now proceed to find out the lesson it has to offer us.

This is an H1 chart. The price gets choppy within these two horizontal lines. It has a rejection and makes a bearish move upon producing a bearish inside bar. The chart is yet to make a breakout. Until it makes a breakout, it does not have anything to offer to the buyers or the sellers. However, as it stands, the buyers may have an upper hand here. Let us proceed to the next chart.

Here it comes. After a long while, a candle breaches through the level of support closing well below it. The candle has a long lower shadow, but the breakout is explicit. The sellers are to wait for the next candle to close its lowest low to trigger a short entry.

The next candle comes out as a strong bearish candle. This is one perfect looking bearish candle to attract the sellers to trigger an entry. The sellers may trigger a short entry right after the candle closes, setting stop-loss above the level where the trend starts with 1R.

As expected, the price heads towards the South with good bearish momentum. However, look at the last candle. It comes out as a spinning top. In a strong bearish trend, it is not considered as a strong bullish reversal candle. Moreover, it is an H1 chart, and the entry is triggered based on the H1 breakout strategy. Thus, the sellers must hold their position and wait. To be precise, they should not even look at this chart anymore by following the rule of ‘Set and Forget.’

The price hits the target. The next candle, after the spinning top comes out as a bearish candle. However, it closes within consolidation support. If it were an H4 or the daily chart, the sellers would have to close the trade manually. This is the difference between trading on the minor chart and major chart.

If we have a plan to take trading as our fulltime business, we may have to trade on different charts from the 15M to Weekly. Trade management varies from chart to chart. This is what we must remember. In the beginning, we shall master on a particular chart that we are comfortable with. Then, we may start trading on the other charts, preferably on the demo first. Once we are confident, we may trade on that chart in our live account. We must not apply a strategy or manage the trade the same way on the weekly chart that we are successful on the H1 or the 15 Chart.

Categories
Forex Price-Action Strategies

To Maintain Better Winning Ratio, Go with A+ Entry

In today’s lesson, we are going to demonstrate an example of H1 breakout trading. In this example, the breakout candle, as well as the confirmation candle, is not the best one the price action traders like to have. Nevertheless, the price heads towards the trend’s direction nicely. In most cases, it does not happen though.

The price after being bullish gets choppy. It then makes a bearish move but upon finding its support, it produces a bullish engulfing candle. This is the strongest bullish reversal candle, which shall attract the buyers to keep an eye on this chart. Let us proceed to the next chart.

The price does not get bullish as expected. However, an inside bar means that the buyers still hold the key. The chart may produce bullish candle and end up making a breakout at the swing high. The H1-breakout traders must be waiting for a breakout here.

The next candle comes out as a bullish engulfing candle closing above the level of resistance. It is a breakout but the breakout is not explicit. If the candle closes well above the level of resistance, it would attract more buyers. Let us now wait for the confirmation candle. If the next candle comes out as a bullish candle closing well above the breakout candle, it may attract more buyers in the end.

The confirmation candle does not look very promising either. As far as H1 breakout price action trading is concerned, the buyers may trigger a long entry. Considering candles’ attributes, it is not an A+ entry though. Let us proceed to the next chart and find out what the price does.

The price heads towards the North with good bullish momentum. It takes only two candles to hit the target. As mentioned, it is not an A+ entry but the trade gets the buyers some profit. In some cases, we see that even an A+ entry gets us a loss instead.

This is how the market works. We must not lose our patience but stick with our plan. If we take such entry, we may have to encounter less momentum after triggering entry, and more losing trades. We have to have the mental strength to face such losses then. Otherwise, we may skip taking such entry. Such an entry does not always get us profit. We have demonstrated this in today’s lesson.

Another equation we should remember, if we want to take A+ entry, we get less number of entries but more consistency. On the other hand, if we take a signal as long as it meets our trading strategy requirement, we get more entries but less consistency.

Categories
Forex Daily Topic Forex Price-Action Strategies

A Weak Breakout Candle Makes Things Different

In H1 breakout trading, the signal candle’s attributes are as important as the breakout candle. We know that a breakout candle means a lot. So is the breakout confirmation or signal candle. In today’s article, we are going to demonstrate an example of this. Let us get started.

The price after being bearish gets caught within a horizontal channel. However, the last candle comes out as a bearish engulfing candle. It seems that the sellers may take control soon. It all depends on the breakout at the level of support followed by breakout confirmation.

The next candle comes out as a bearish candle as well closing within the level of support. The sellers are to wait longer. On the other hand, the buyers would love to get a bullish reversal right here. The battle is on.

The bear wins. The last candle comes out as a bearish engulfing candle closing well below the level of support. This is what H1 breakout traders want. If the next candle closes well below the breakout candle, the sellers may trigger a short entry.

The next candle comes out as a bearish doji candle. It closes below the breakout candle. The sellers may trigger a short entry. However, this is not an ideal candle showing strong bearish momentum. If a candle like this confirms a breakout, the price may not go towards the take profit level that we would love to see.

After triggering the entry, the chart produces two bullish candles. It looks extremely ominous. Most probably, the entry is going to get us a loss. Taking a loss is a usual thing in the Forex trading. However, the last two candles may be produced because of the fragile confirmation candle. This is where H1 breakout traders shall be a bit careful. If the confirmation candle does not come out as a strong candle, the price may go another way round. Let us find out from the next chart what the price does here.

Oh! It is about to hit the stop loss. It produces a bearish engulfing candle again. The price may head towards the downside and hit take profit level. It is still 50-50 since the price is trading within the level of last swing low. Let us find out how it ends.

Yes, it hits the target at last. However, this is what the price does not usually do when the H1 chart makes a breakout and confirms it. As mentioned, it often happens when the breakout and confirmation candle come out as weak candles. Thus, we may consider this when trading H1 breakout strategy next time.

Categories
Forex Price-Action Strategies

Patience Required Even with H1 Breakout Trade Setup

In today’s lesson, we are going to demonstrate an example of an H1 breakout strategy. Usually, the price heads towards the trend’s direction with good momentum on the H1 breakout trade setup. In today’s example, the price does not behave as it usually does. Let us get started.

The price after being bullish, it has been on consolidation. Look at the last two candles. The price heads towards the consolidation resistance. The buyers eagerly wait for a bullish breakout at the level of resistance on such price action. Let us proceed to the next chart.

Here comes the breakout candle. The buyers love to get a breakout with such a candle. Now, they must wait for the next candle to close above the breakout candle. If that happens, traders may trigger a long entry.

The next candle comes out as a bullish candle closing well above the breakout candle. The buyers may trigger a long entry right after the last candle closes. The stop loss is to be set below the trend-initiating candle, and the take profit is to be placed with 1:1 risk-reward. Six out of ten times, the price goes towards the take-profit level with ease in a hurry. Let us proceed to the next chart and see how this one goes.

The price does not head towards the North with good bullish momentum. The way it has been going for the last five candles, it looks ominous. A question may be raised here, “shall we close the entry?” The price still has a lot of space to hit take profit level. The market is not about to close down for the weekend or holiday. Thus, we must be patient and hold the entry. In other words, we shall apply the rule “set and forget.” The set and forget rule is tailor-made for intraday trading, such as the H1 chart to the 5M chart. Let us wait and find out what happens.

After a long while, the price makes a move towards the North again. It seems the trade is going to get the buyers some green pips. They must wait and let the price to hit the target.

It loses its momentum again a bit, but it hits the target. We often head that patience is required more when traders trade on major charts such as the H4, the daily or the weekly. The reality is patience is required for traders of all kinds. Today’s example has proved this again.

Categories
Forex Daily Topic Forex Price-Action Strategies

Remember the Rule ‘Set and Forget’

In today’s lesson, we are going to demonstrate an example of H1 breakout trading. Usually, in this strategy, the price goes towards the direction with good momentum if things go accordingly. In this example, the breakout candle, breakout confirmation candle are immaculate, but it takes a long pause before it hits the target. It has a lesson to give us. Let us dig into this.

The price after being bearish finds its support. It consolidates for a while and produces a bearish pin bar followed by a bearish engulfing candle. Traders are to wait for a breakout at the level of support to get them prepared to go short on the pair.

The last candle breaches the level of support and closes well below the level. The candle is having a tiny lower spike. Ideally, H1 breakout strategy traders wait for such a breakout candle.  They are to wait for the next H1 candle to close below the breakout candle. If that happens, the game is on. Let us proceed to the following chart.

As expected, the next candle closes below the breakout candle. The candle looks very bearish, being an ideal candle to confirm the breakout. The sellers may trigger a short entry right after the last candle closes. Let us have a look at the same chart with some calculations in it.

The sellers may set the level of stop-loss above the level where the trend is initiated. They may set the take-profit level with 1:1 risk-reward. It means

Entry- Stop Loss= Take Profit-Entry.

The price consolidates after the signal candle. It bounces at the level, where it bounced some hours earlier. This is the first sign of a double bottom. It looks the buyers may take over the control, which may make the price hit the stop loss. You may remember, in one of our lessons, it has been recommended that a trader may have to close his entry manually. It was an example of the Friday market. Today’s market is not the Friday market. Thus, we must not close it manually, as it may get us a loss, but we must let it run. Let us wait and see how it ends.

It looks much better now. The price heads towards the South with good bearish momentum. It may not take much time to hit the target.

It does not go according to your calculation. It takes much longer than our expectations. However, it hits the target at last. The lesson that we have learned here is we must let a trade run to do its bit. Once we take entry after measuring the risk-reward, we must be patient. In a word, we must remember the rule ‘set and forget.’