In today’s lesson, we are going to demonstrate an example of an H1 breakout strategy. Before hitting the target, at some point, the price gets sluggish. Nevertheless, it hits the target in the end. Let us now proceed to find out the lesson it has to offer us.
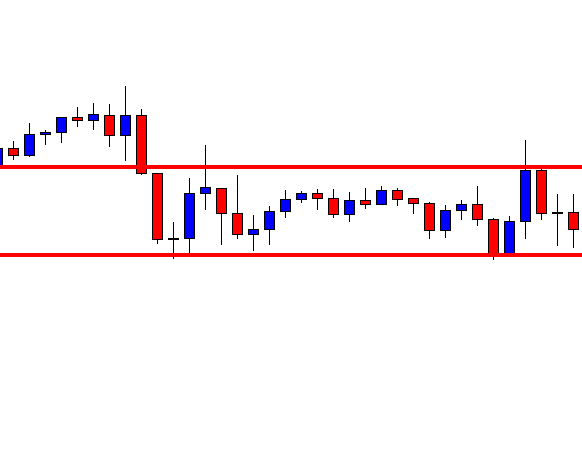
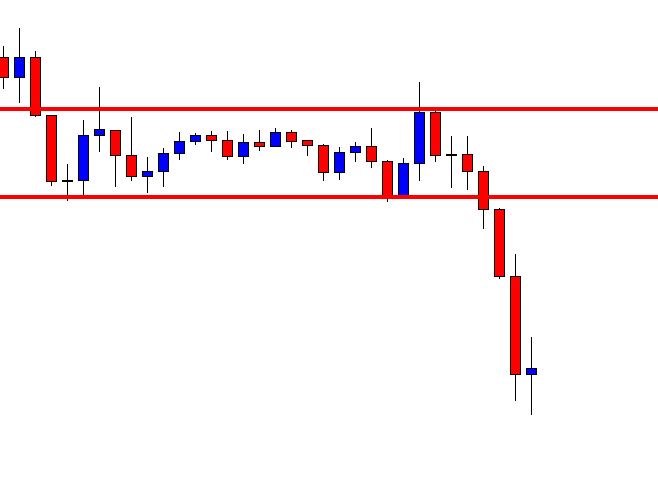
This is an H1 chart. The price gets choppy within these two horizontal lines. It has a rejection and makes a bearish move upon producing a bearish inside bar. The chart is yet to make a breakout. Until it makes a breakout, it does not have anything to offer to the buyers or the sellers. However, as it stands, the buyers may have an upper hand here. Let us proceed to the next chart.
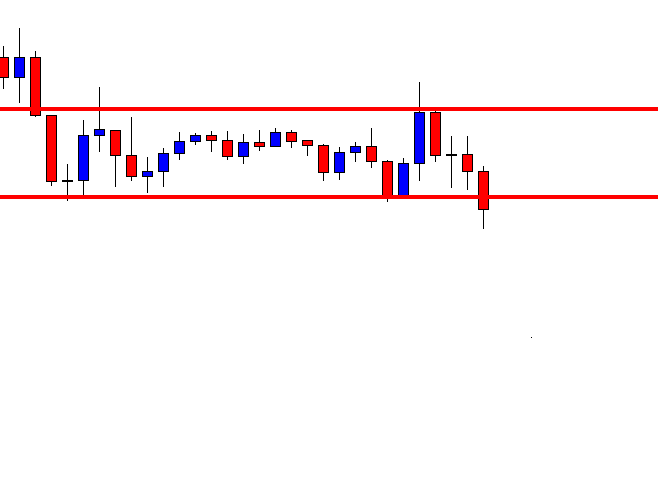
Here it comes. After a long while, a candle breaches through the level of support closing well below it. The candle has a long lower shadow, but the breakout is explicit. The sellers are to wait for the next candle to close its lowest low to trigger a short entry.
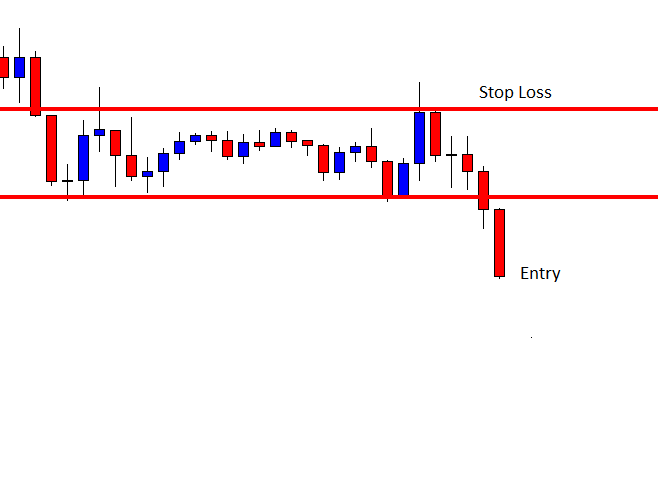
The next candle comes out as a strong bearish candle. This is one perfect looking bearish candle to attract the sellers to trigger an entry. The sellers may trigger a short entry right after the candle closes, setting stop-loss above the level where the trend starts with 1R.
As expected, the price heads towards the South with good bearish momentum. However, look at the last candle. It comes out as a spinning top. In a strong bearish trend, it is not considered as a strong bullish reversal candle. Moreover, it is an H1 chart, and the entry is triggered based on the H1 breakout strategy. Thus, the sellers must hold their position and wait. To be precise, they should not even look at this chart anymore by following the rule of ‘Set and Forget.’
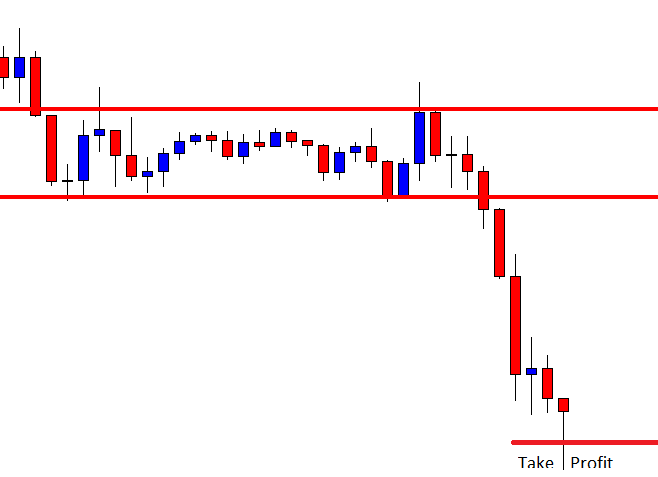
The price hits the target. The next candle, after the spinning top comes out as a bearish candle. However, it closes within consolidation support. If it were an H4 or the daily chart, the sellers would have to close the trade manually. This is the difference between trading on the minor chart and major chart.
If we have a plan to take trading as our fulltime business, we may have to trade on different charts from the 15M to Weekly. Trade management varies from chart to chart. This is what we must remember. In the beginning, we shall master on a particular chart that we are comfortable with. Then, we may start trading on the other charts, preferably on the demo first. Once we are confident, we may trade on that chart in our live account. We must not apply a strategy or manage the trade the same way on the weekly chart that we are successful on the H1 or the 15 Chart.