Categories
Forex Price Action

The H1-15M Breakout Trading: Concentrate on Breakout and Reversal Candle

In today’s lesson, we are going to demonstrate an example of a trade setup based on the H1-15M chart combination. Usually, the straighter the first move, the better it is.  However, the price sometimes consolidates in the first arm as well. Such consolidation makes a move look weak and may hold us back from eyeing on the chart. We try to find out whether we should skip eyeing on such a chart or not.

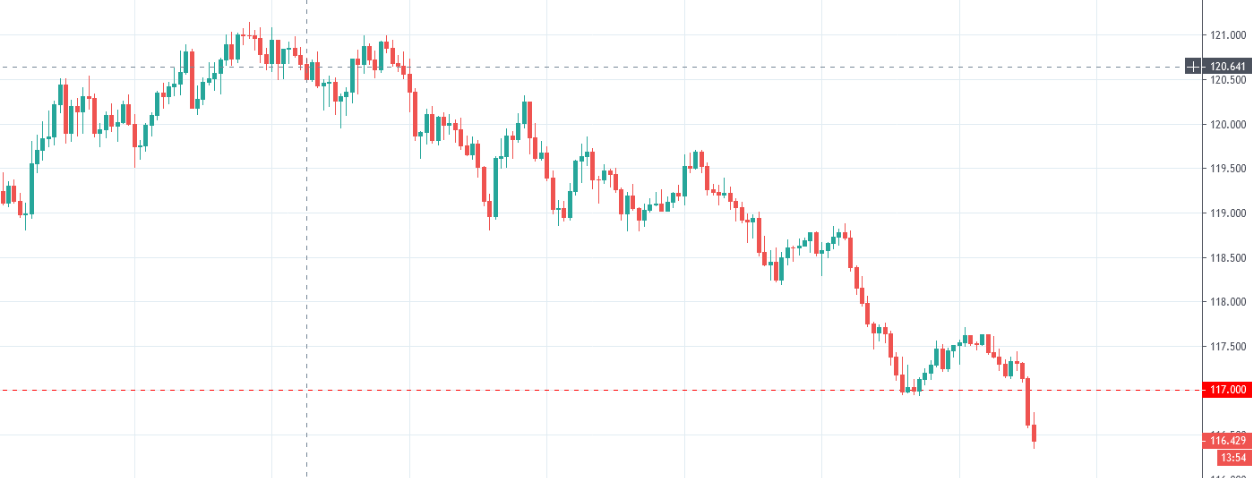
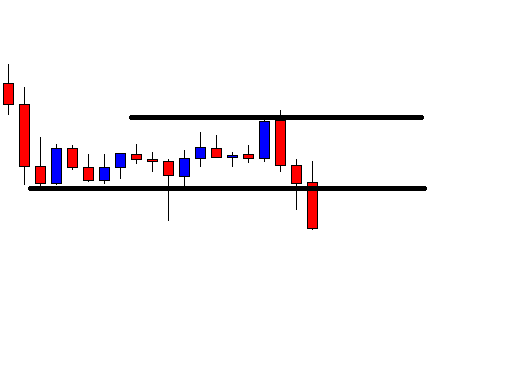
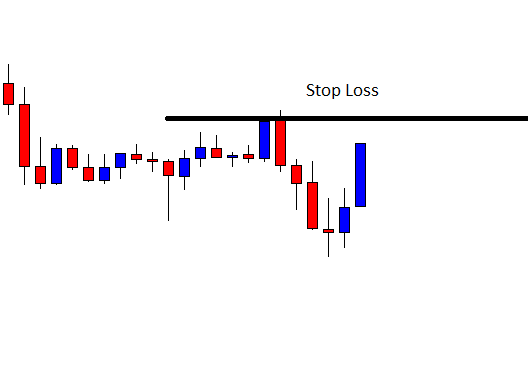
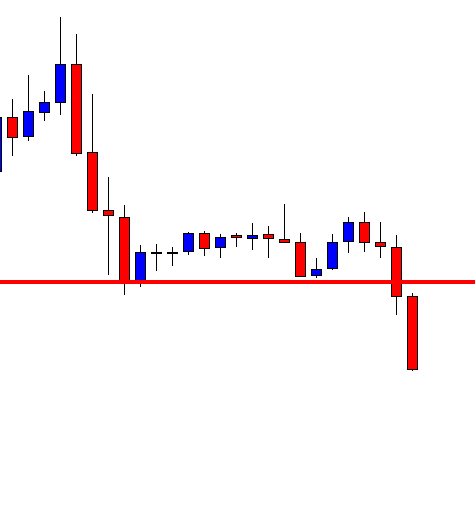
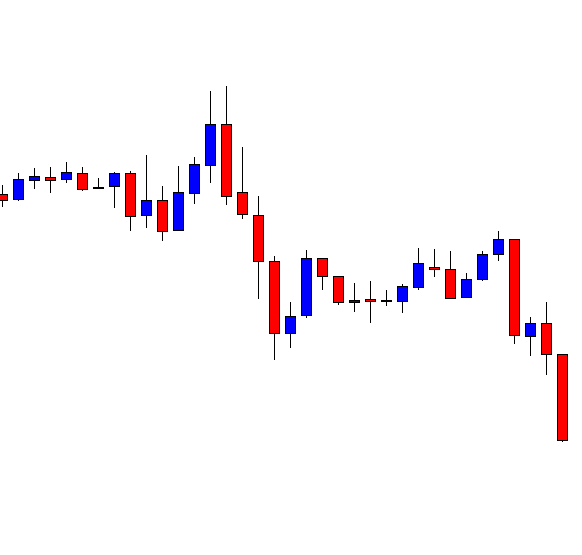
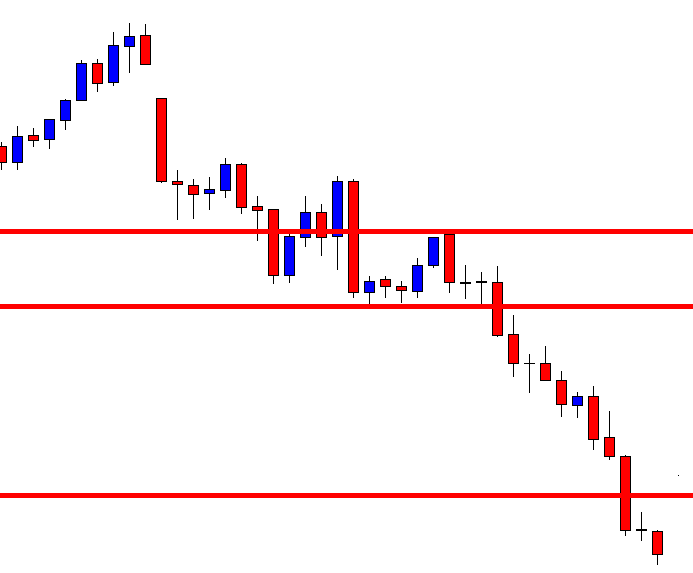
This is an H1 chart. The chart shows that the price makes a bullish move. Then, it produces a bearish inside bar followed by a bullish engulfing candle. The H1-15M buyers may flip over to the 15M chart to get a 15M bullish reversal candle to trigger a long entry. However, those two bearish H1 candles suggest that the 15M chart does not produce any bullish reversal candle after the H1 breakout. The price starts having a bearish correction instead.

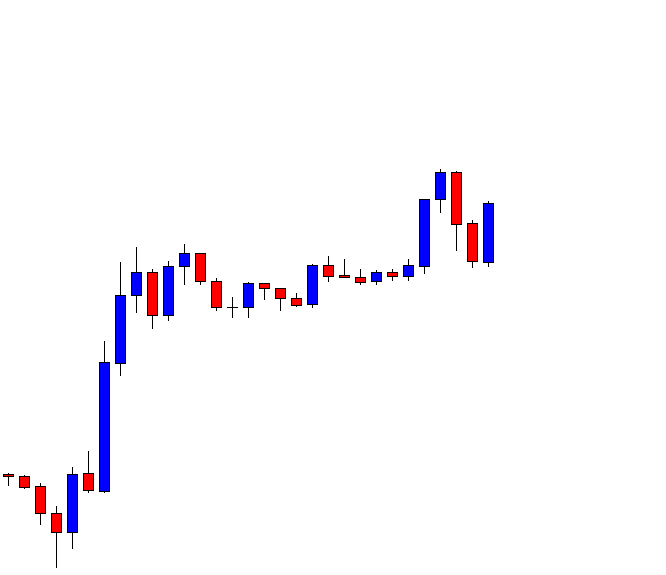
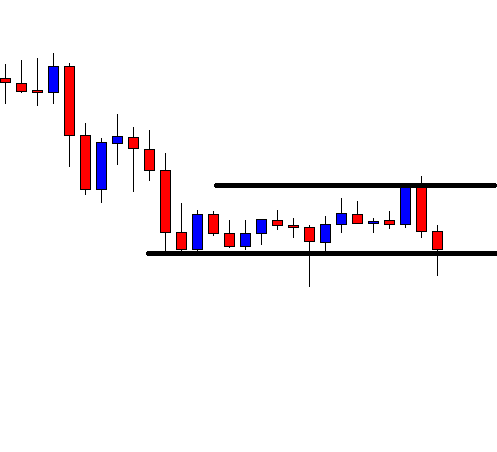
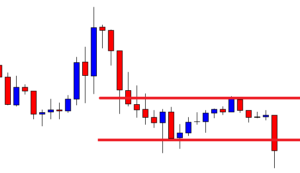
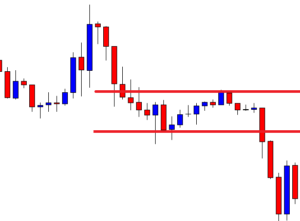
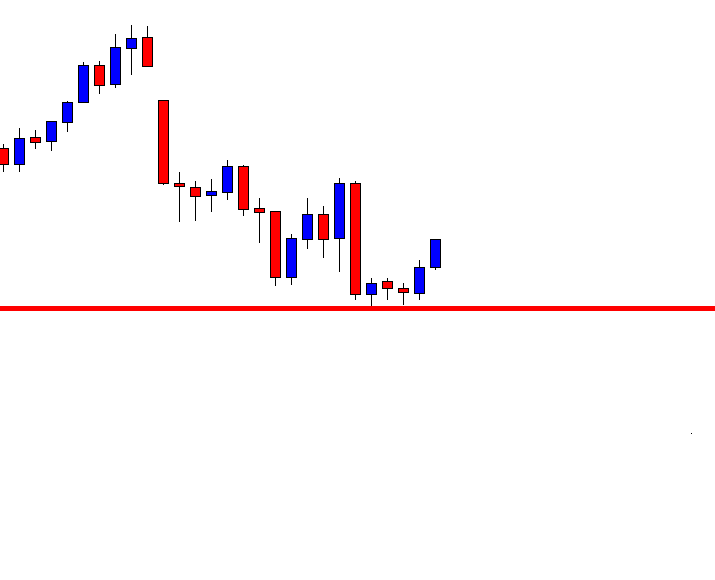
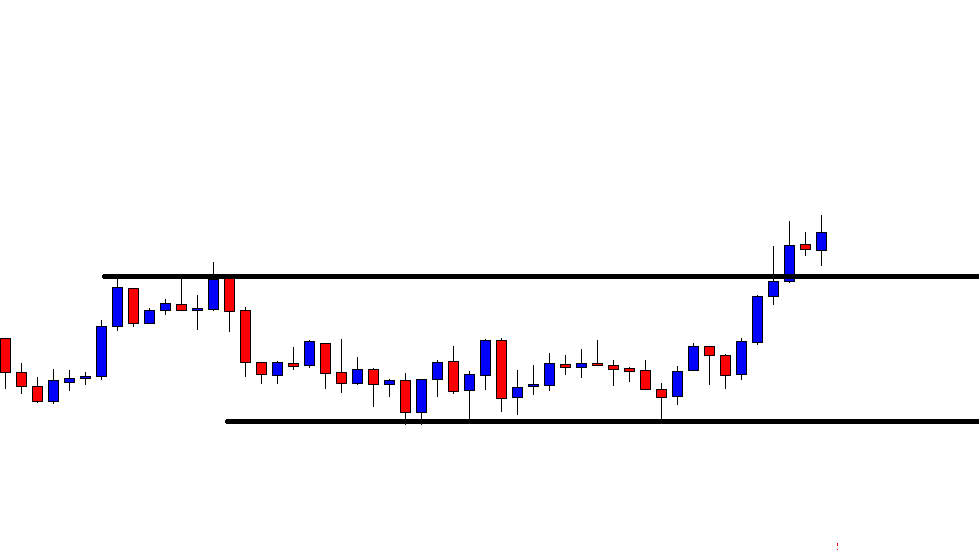
The chart makes its bullish move, followed by a bearish correction. The bullish move does not look that impressive. It consolidates before making the bearish correction. Many traders may skip eyeing on this chart to go long in the pair. Ideally, the H1-15M combination trading requires an H1 breakout followed by a 15M bullish reversal to offer a long entry. Let us proceed to the next chart to find out what the price does here.

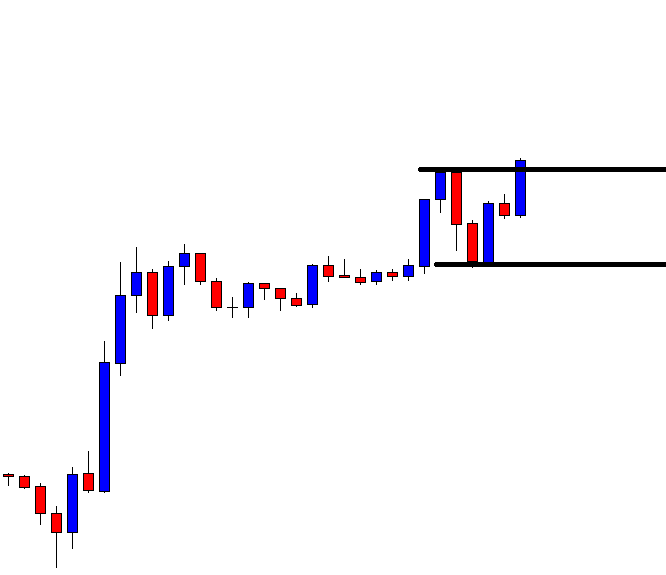
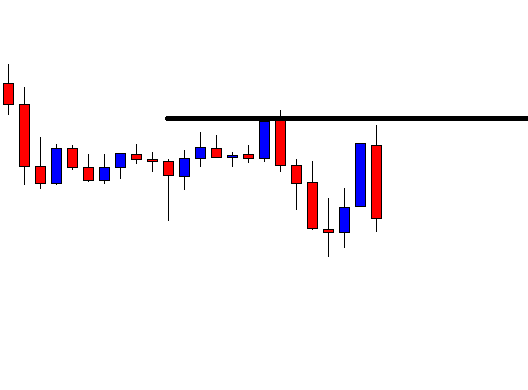
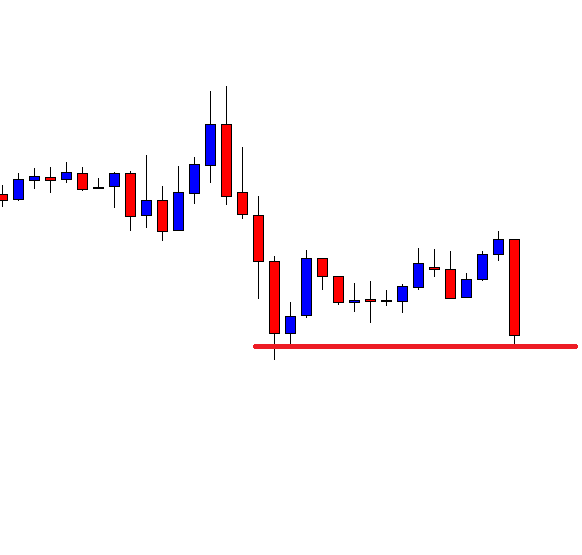
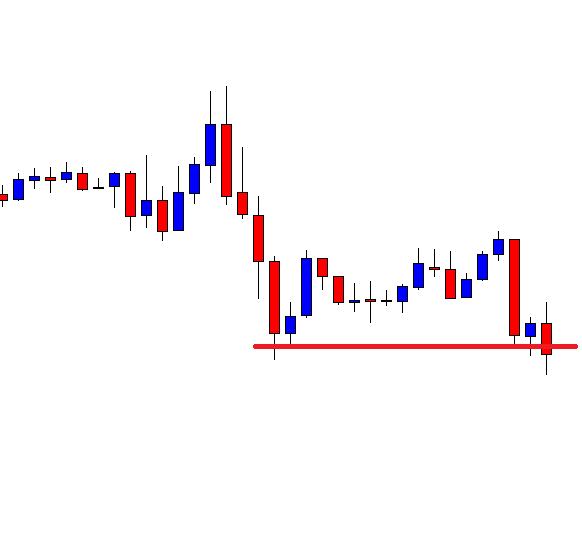
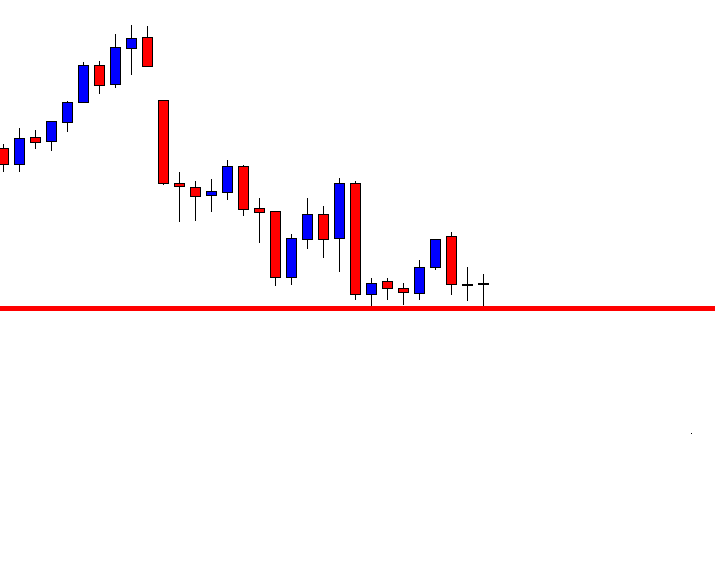
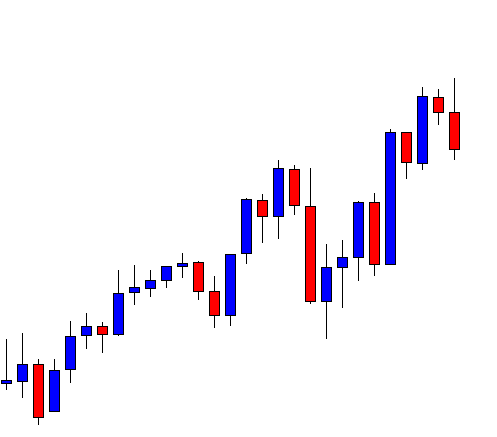
The price finds its support and heads towards the North. The last candle closes above the level of resistance. This is an H1 breakout. The H1-15M combination traders are to flip over to the 15M chart to trigger a long entry. Let us flip over to the 15M chart first.

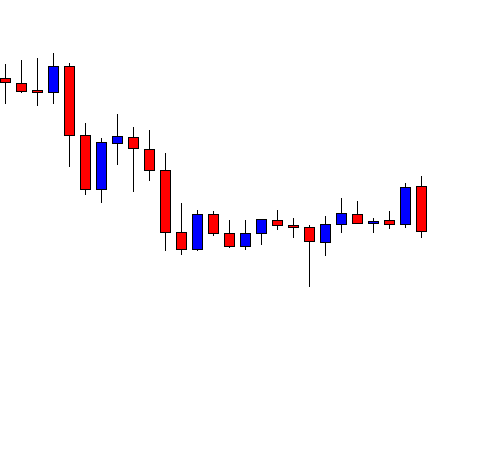
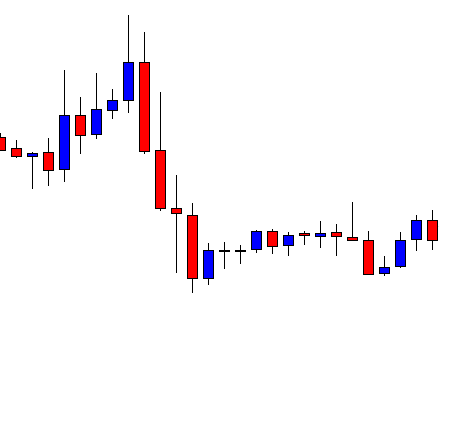
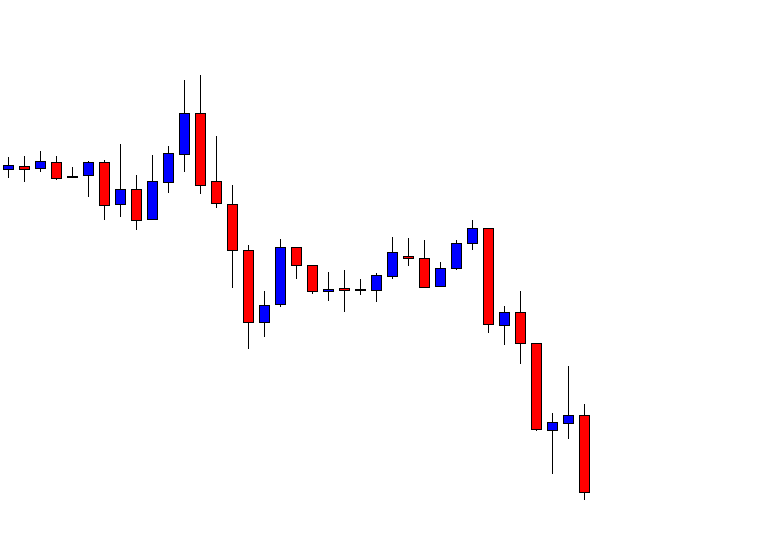
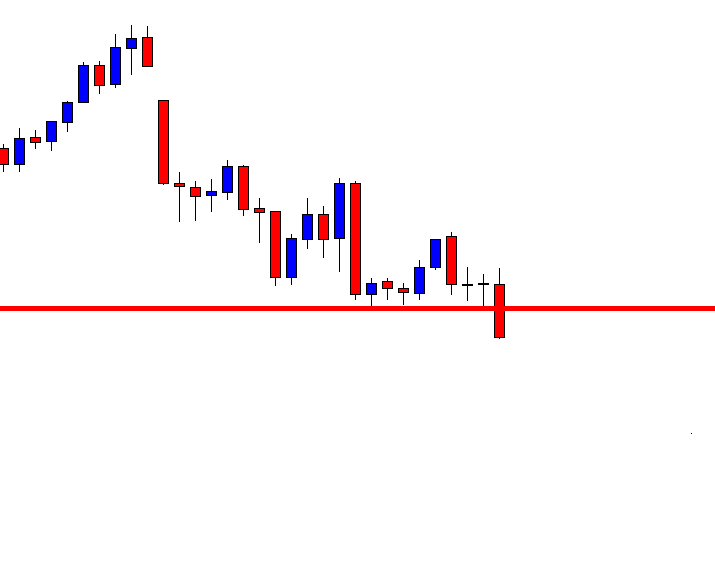
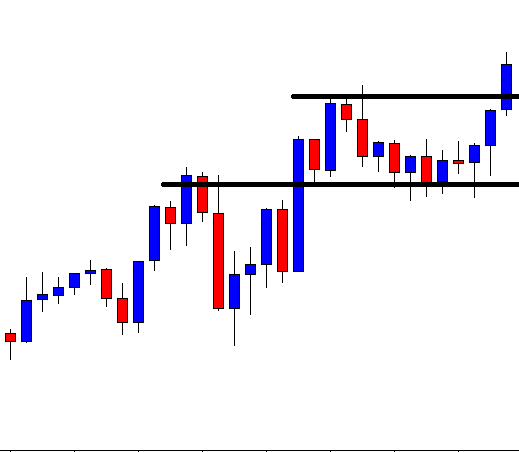
This is how the 15M chart looks right after the H1 breakout. If the price comes back to the breakout level, and the level produces a 15M bullish reversal candle, the buyers may trigger a long entry.

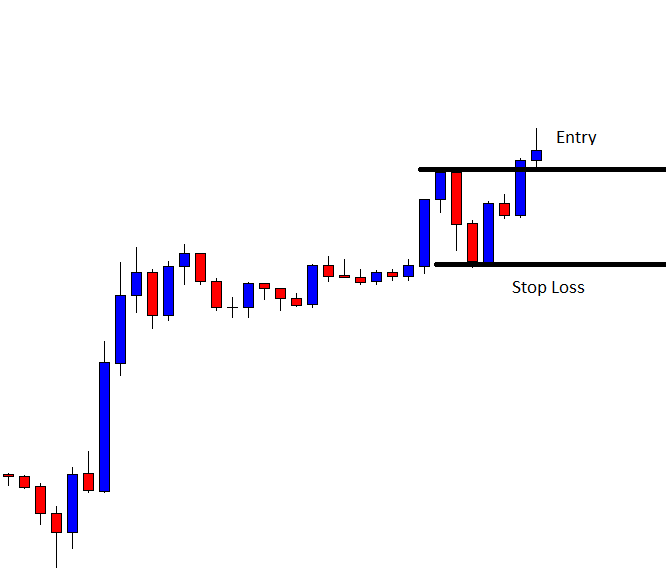
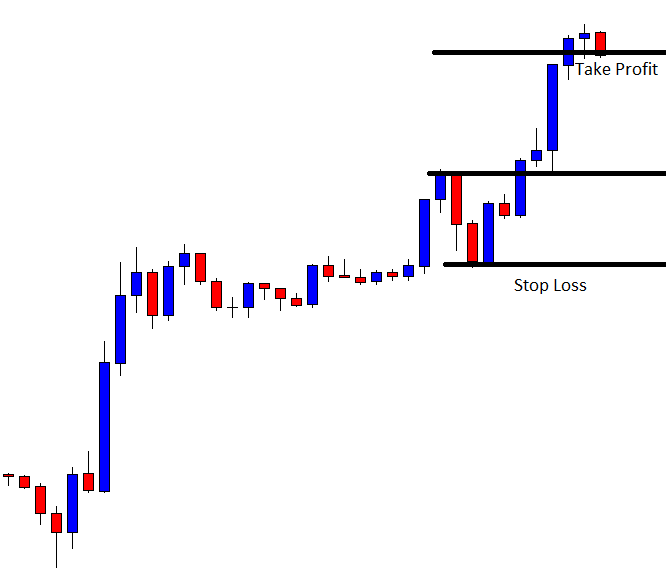
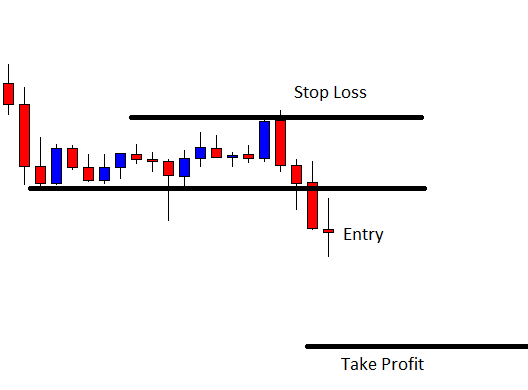
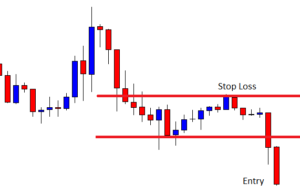
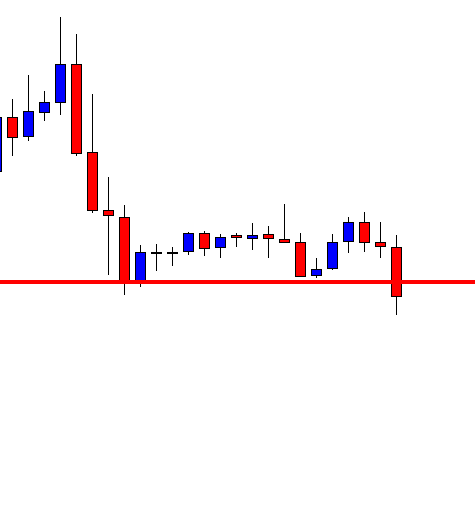
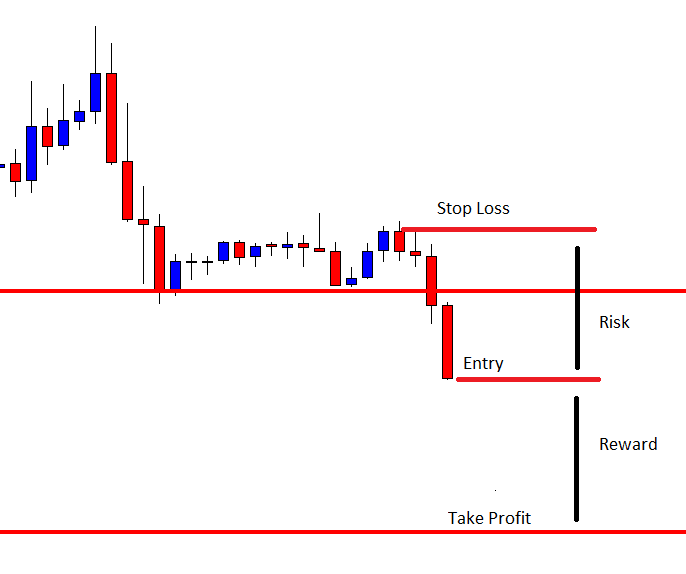
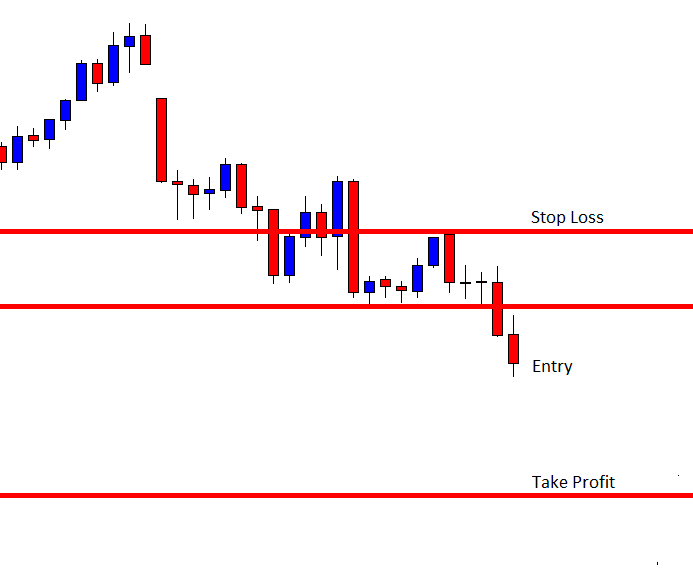
The 15M chart produces a bearish engulfing candle closing within the breakout level. The next candle comes out as a bullish engulfing candle. The H1-15M buyers may trigger a long entry right after the last candle closes by setting stop loss below consolidation support and by setting take profit with 1R.

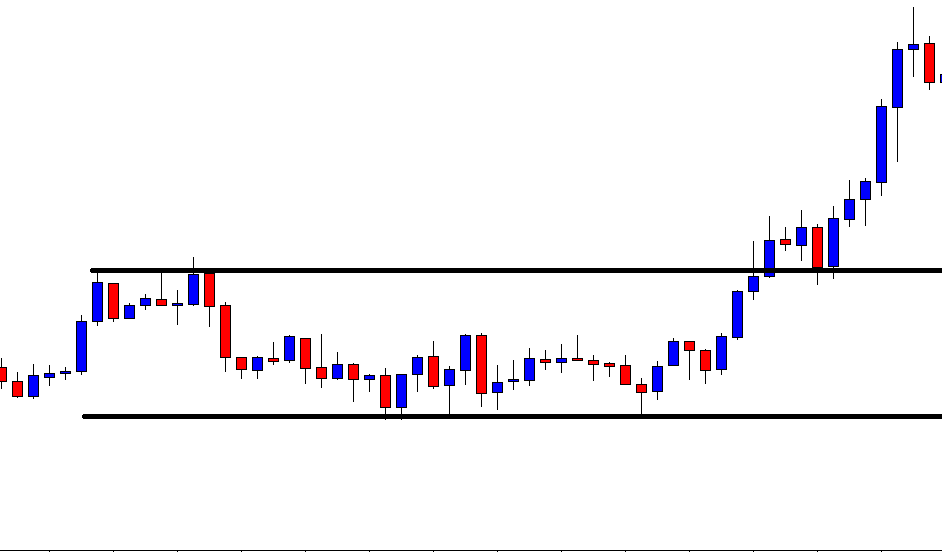
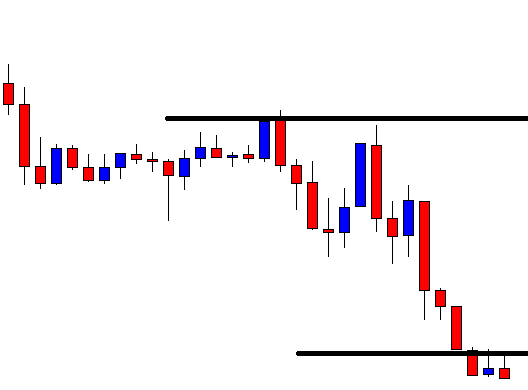
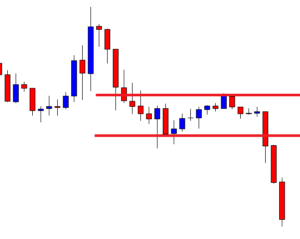
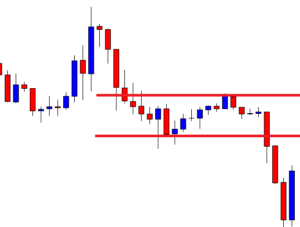
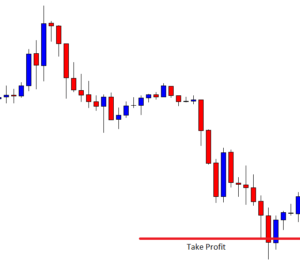
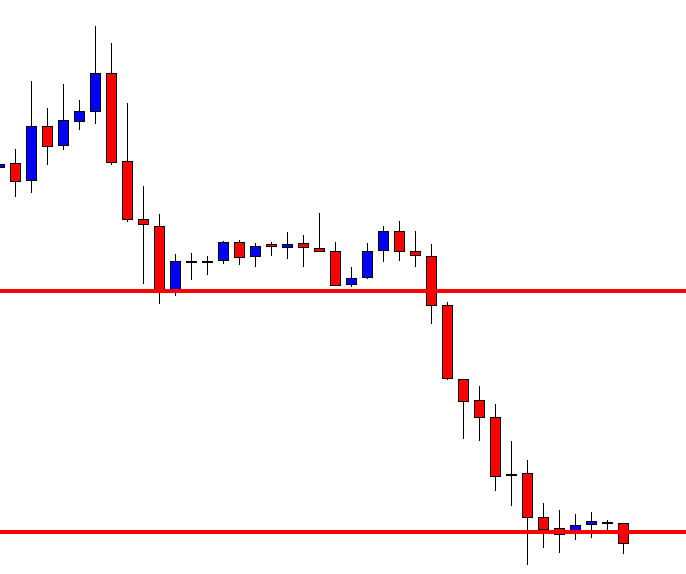
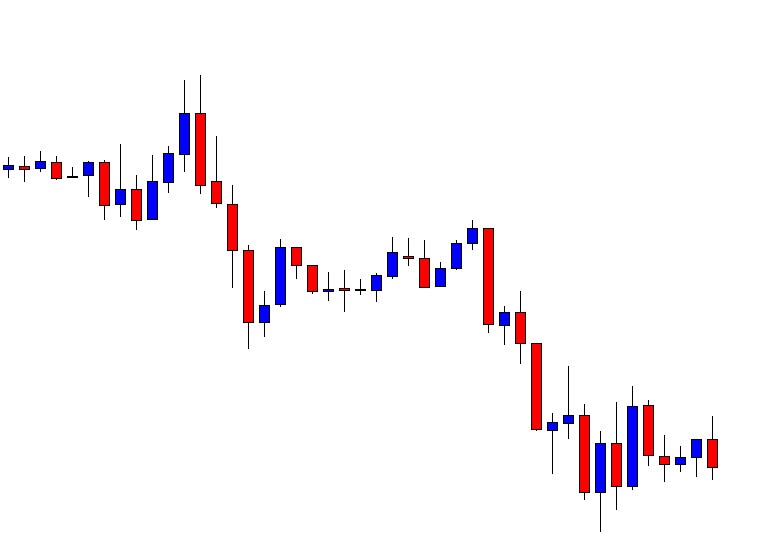
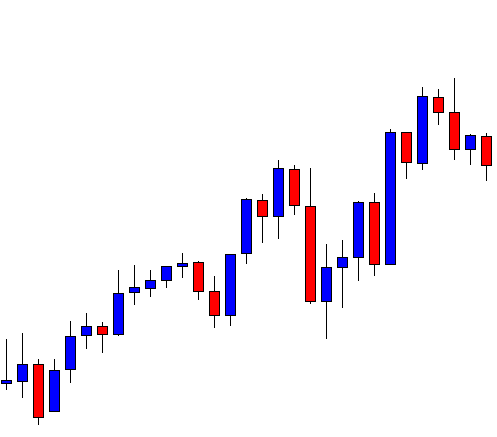
The price never looks back before hitting 1R. It heads towards the North at a very good pace. Consolidation and bullish reversal candle come out exactly the buyers would want to get. Do not forget that the first bullish move does not look that impressive. The breakout and 15M chart’s price action attract the buyers to go long here, though. This is what we are to look for in the H1-15M combination trading. It is good if the price makes a strong move in the first arm. However, if it does not, we may still eye on the chart to see whether it makes an H1 breakout and offers us an entry by producing a 15M bullish reversal candle.

Categories
Forex Signals

Bear Continues its Domination

Chart EUR/JPY H1 Chart

EUR/JPY made a strong bearish move on the H1 chart yesterday. The chart shows that it made a breakout at yesterday’s lowest low today. As of writing, the last candle closed well above the breakout candle. A short entry is triggered at 116.370. The price may head towards the South and find its next support at around the level of 115.255 area.

Let us have a look at the trade summary

Entry: Sell at 116.370

Stop Loss: Above 117.640

Take Profit: 115.255

Categories
Forex Price-Action Strategies

To Maintain Better Winning Ratio, Go with A+ Entry

In today’s lesson, we are going to demonstrate an example of H1 breakout trading. In this example, the breakout candle, as well as the confirmation candle, is not the best one the price action traders like to have. Nevertheless, the price heads towards the trend’s direction nicely. In most cases, it does not happen though.

The price after being bullish gets choppy. It then makes a bearish move but upon finding its support, it produces a bullish engulfing candle. This is the strongest bullish reversal candle, which shall attract the buyers to keep an eye on this chart. Let us proceed to the next chart.

The price does not get bullish as expected. However, an inside bar means that the buyers still hold the key. The chart may produce bullish candle and end up making a breakout at the swing high. The H1-breakout traders must be waiting for a breakout here.

The next candle comes out as a bullish engulfing candle closing above the level of resistance. It is a breakout but the breakout is not explicit. If the candle closes well above the level of resistance, it would attract more buyers. Let us now wait for the confirmation candle. If the next candle comes out as a bullish candle closing well above the breakout candle, it may attract more buyers in the end.

The confirmation candle does not look very promising either. As far as H1 breakout price action trading is concerned, the buyers may trigger a long entry. Considering candles’ attributes, it is not an A+ entry though. Let us proceed to the next chart and find out what the price does.

The price heads towards the North with good bullish momentum. It takes only two candles to hit the target. As mentioned, it is not an A+ entry but the trade gets the buyers some profit. In some cases, we see that even an A+ entry gets us a loss instead.

This is how the market works. We must not lose our patience but stick with our plan. If we take such entry, we may have to encounter less momentum after triggering entry, and more losing trades. We have to have the mental strength to face such losses then. Otherwise, we may skip taking such entry. Such an entry does not always get us profit. We have demonstrated this in today’s lesson.

Another equation we should remember, if we want to take A+ entry, we get less number of entries but more consistency. On the other hand, if we take a signal as long as it meets our trading strategy requirement, we get more entries but less consistency.

Categories
Forex Daily Topic Forex Price-Action Strategies

A Weak Breakout Candle Makes Things Different

In H1 breakout trading, the signal candle’s attributes are as important as the breakout candle. We know that a breakout candle means a lot. So is the breakout confirmation or signal candle. In today’s article, we are going to demonstrate an example of this. Let us get started.

The price after being bearish gets caught within a horizontal channel. However, the last candle comes out as a bearish engulfing candle. It seems that the sellers may take control soon. It all depends on the breakout at the level of support followed by breakout confirmation.

The next candle comes out as a bearish candle as well closing within the level of support. The sellers are to wait longer. On the other hand, the buyers would love to get a bullish reversal right here. The battle is on.

The bear wins. The last candle comes out as a bearish engulfing candle closing well below the level of support. This is what H1 breakout traders want. If the next candle closes well below the breakout candle, the sellers may trigger a short entry.

The next candle comes out as a bearish doji candle. It closes below the breakout candle. The sellers may trigger a short entry. However, this is not an ideal candle showing strong bearish momentum. If a candle like this confirms a breakout, the price may not go towards the take profit level that we would love to see.

After triggering the entry, the chart produces two bullish candles. It looks extremely ominous. Most probably, the entry is going to get us a loss. Taking a loss is a usual thing in the Forex trading. However, the last two candles may be produced because of the fragile confirmation candle. This is where H1 breakout traders shall be a bit careful. If the confirmation candle does not come out as a strong candle, the price may go another way round. Let us find out from the next chart what the price does here.

Oh! It is about to hit the stop loss. It produces a bearish engulfing candle again. The price may head towards the downside and hit take profit level. It is still 50-50 since the price is trading within the level of last swing low. Let us find out how it ends.

Yes, it hits the target at last. However, this is what the price does not usually do when the H1 chart makes a breakout and confirms it. As mentioned, it often happens when the breakout and confirmation candle come out as weak candles. Thus, we may consider this when trading H1 breakout strategy next time.

Categories
Forex Daily Topic Forex Price-Action Strategies

‘Set and Forget’ Tailor Made for H1 Breakout Trading

In today’s article, we are going to demonstrate an example of H1 breakout strategy. It is a typical example of the rule ‘Set and Forget’. To trade on the H1 chart, we must be patient and let the price do its job once we have taken entry. Let us proceed.

The chart shows that the last candle breaches closing below the level of support. As far as the H1 breakout strategy is concerned, traders must wait for the next candle to be bearish closing well below the breakout candle.

The last candle comes out as a bearish candle closing well below the breakout candle. The sellers wait for such candle to confirm a breakout. The sellers may trigger a short entry right after the last candle closes. Stop loss is to be set above where the trend starts and Take Profit is to be set with a 1:1 risk-reward.

The next candle comes out as a bearish candle as well. The sellers must let the price to hit the target. To be precise, they shall not even look at the chart. Stop Loss and Take Profit are set. All they can do is let the price do its job.

Where does that one come from? The chart produces a bullish engulfing candle. It is a strong bullish reversal candle, which may change the trend. To be honest, a candle like this may intimidate any price action trader. Do not forget this is an H1 chart and the entry is taken on H1 breakout strategy. Set and Forget rule comes very handy in this trade setup. Let us assume, we do not even know that the chart produces such a candle. We let the market do its own job.

The next candle comes out as a bearish inside bar. It looks more ominous. If the next candle comes as a bullish engulfing candle, the sellers will be in serious trouble. Let us proceed to the next chart.

The next candle comes out as a doji candle followed by another doji candle. However, the price heads towards Take Profit level and hits the target at last. If we keep looking at such chart, would we be able to hold ourselves back from closing the entry manually? It may get very tough for the traders to hold their nerves with such price action when a trade is running. If a trader trades on the daily or the H4 chart, he may consider closing the entry manually. With the H1 chart trading, traders may not do this. In other words, set and forget when you are trading on the H1 chart.

Categories
Forex Price-Action Strategies

When Things Go Like This

In today’s lesson, we are going to demonstrate an example of H1 breakout trading. We have come to know that it is an excellent trading strategy. It offers 1:1 risk-reward but maintains a tremendous winning consistency. However, the H1 chart is to maintain some attributes to offer us entry with the strategy. Today’s example is one of the ideal charts with those attributes. Let us have a look.

The chart shows that the price gets caught within two horizontal lines. The last candle comes out as a bearish Marubozu candle. Thus, It may be the beginning of a new bearish trend. Traders must wait for the price to continue its bearish move and make a breakout at the level of support.

The price continues its bearish move. The last candle comes out as a strong bearish candle closing below the level of support. It is an explicit breakout. Here comes the trickiest part of this strategy. Traders must wait for the next candle to close below the breakout candle. Let us find out what the price does in the next chart.

Look at the confirmation candle. This is one good-looking bearish candle. Traders shall look for such candle for the breakout and breakout confirmation to trade with H1 breakout trading. A short entry may be triggered right after the last candle closes. Let us find out the level of Stop Loss and Take Profit.

Measure the difference between Stop Loss to Entry and set the Take Profit at the level with the same distance. In a word, it gives us 1:1 risk-reward. It often travels more, but usually, the price consolidates after hitting the target with 1:1 risk-reward. Let us proceed and find out how the trade goes.

The price heads towards the Take Profit level with extreme bearish momentum. The level where we set Take Profit, the price seems to be making another breakout. It looks the sellers still have the controls. However, as far as H1 breakout trading is concerned, the sellers are out with the profit.

You might have noticed that after the breakout confirmation, how the price heads towards the South. It does not take any pauses. We must not be certain about the reasons since it is the Forex market. However, if we consider

  1. The trend initiating candle
  2. The breakout candle
  3. The breakout confirmation candle

We see that three of these candles have all the attributes that the sellers look for in an ideal bearish market. In a bullish market, it is vice versa. If things go like this, H1 breakout trading is one of the most consistent winning strategies. In most cases, the price hits the target as we have demonstrated the example in today’s lesson.

Categories
Forex Daily Topic Forex Price-Action Strategies

Friday Trading May Need More Attention

The Forex market is open from Monday to Friday. Since Friday is the last day of the week, traders may need to look after their trade more. To be precise, they may need to close their intraday trades manually. In today’s lesson, we are going to demonstrate an example of this.

This is an H1 chart. The price after being bearish has been trapped within a rectangle. It could make a breakout either side. However, the last candle suggests that the price is bearish biased. It closes within the level of previous swing low. If the price makes a bearish breakout, the sellers may trigger a short entry upon the breakout confirmation. Let us proceed to the next chart.

The price action produces an inside bar. As we know, an inside bar is a relatively weak reversal candle. It may push the price towards the North; however, if a bearish candle breaches the level of support, the sellers may get ready to go short on the pair.

The last candle breaches the level of support. It is not an explicit breakout. Nevertheless, the candle closes below the level. If the next candle closes well below the breakout candle, the sellers may trigger a short entry by setting the Stop Loss above the trend-initiating candle.

Yes, the next candle closes well below the breakout candle. The sellers may trigger a short entry right after the last candle closes. Usually, the take profit level is to be set with a 1:1 risk-reward ratio on the H1 breakout strategy. Do not forget that it is Friday. It is an essential factor to remember while trading in the H1 breakout trading strategy.

The last candle gets us some green pips. It looks good now. Most probably, it is going to get us the reward, which it usually does. We must wait and hold the position.

We have been waiting for long. The price has been on strong consolidation. It is still to travel more to hit the Take Profit. As mentioned, it is Friday. The market is about to close (within 2 hours). Usually, most of the pairs get sluggish before the market closes on Friday. On Monday, many pairs start trading with a gap. There is no point holding H1 breakout positions during the weekend. Thus, we may close the trade manually and be happy with half the profit of our expectations.

Categories
Forex Price-Action Strategies

An H1 Trading Strategy, A New Arrow in the Quiver

The H1 chart is one of the most traded charts in the Forex market. This is a very consistent chart considering other intraday charts. In today’s article, we are going to learn a strategy to trade on the H1 chart in the Forex market.

This is an H1 chart. The price after making a bearish move seems to have found its support. It produces two consecutive bullish candles. The buyers are to wait for the price to consolidate and create a bullish breakout to go long. On the other hand, the sellers are to wait for a bearish reversal candle and make a bearish breakout to go short on the pair. Let us find out what the price does next.

The chart produces a bearish engulfing candle, which is the strongest bearish reversal candle. The sellers have the upper hand here. A breakout at the level of support is the next thing to take a short entry here.

The price consolidates around the level of support. The level of support becomes double bottom support. A strong battle is going on between the buyers and the sellers. Traders must wait to find the next direction.

It makes an explicit bearish breakout. Admittedly, the sellers have outplayed the buyers. Traders shall get themselves ready to go short on the pair. The question is why they have to get themselves ready. Should not they trigger any entry right after the last candle closes? The answer is no. They must wait for the next candle to close below the breakout candle. This is the trickiest part of this strategy. Traders must wait for one more candle to make a new lower low (in a bearish market).

Here it comes. The next candle comes out as a bearish candle closing well below the breakout candle. An entry may be triggered right after the last candle closes. The stop loss level is easy to be found out. It is above the level where the trend initiates. We see that a red marked take profit level as well. However, the chart does not show that it is a significant level. How do we find this out then? We may set our take profit exactly with a 1:1 risk-reward ratio. It means the length of entry to stop loss equals to the length of entry to take profit in this strategy. Let us find out how the trade goes.

The trade goes well. We will demonstrate more examples of this strategy soon. Meanwhile, let us concentrate on the things to remember.

  1. The trend initiation candle is to be a strong reversal candle.
  2. The breakout is to be very explicit.
  3. The very next candle is to close below (in a bearish market) or close above (in a bullish market).
  4. Take Profit is to be set with no more than 1:1 risk-reward.