In today’s lesson, we are going to demonstrate an example of a chart that makes a strong bullish move upon producing a bullish engulfing candle at a key Fibonacci level. We know an engulfing candle creates good momentum. If it is created at a significant Fibonacci level, it often pushes the price towards the trend further than traders’ expectations. Let us see and find out what and how that happens.

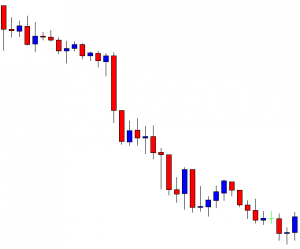
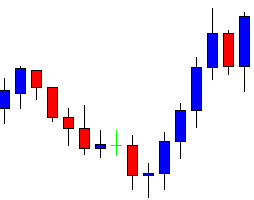
It is an H1 chart. The chart shows that the price heads towards the South. It keeps making new lower lows. At the last bounce, the chart produces a Morning Star. It may make a bullish reversal now. Let us wait and see whether it makes a breakout at the last swing high or not.
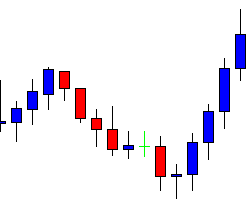
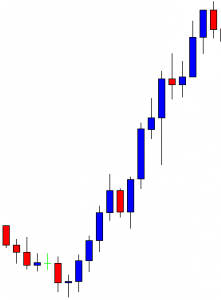
The chart produces four consecutive bullish candles. The price breaches the last swing high. The buyers may wait for the price to consolidate around the breakout level and get a bullish reversal candle to go long in the pair.
It produces a bearish candle closing within the breakout level. The buyers may keep their eyes sharp to see how the next candle comes out. A bullish reversal candle followed by a breakout at the highest high is the signal to trigger a long entry. If the reversal candle comes out as a bullish engulfing candle closing above the resistance, the buyers may trigger a long entry right after the candle closes.
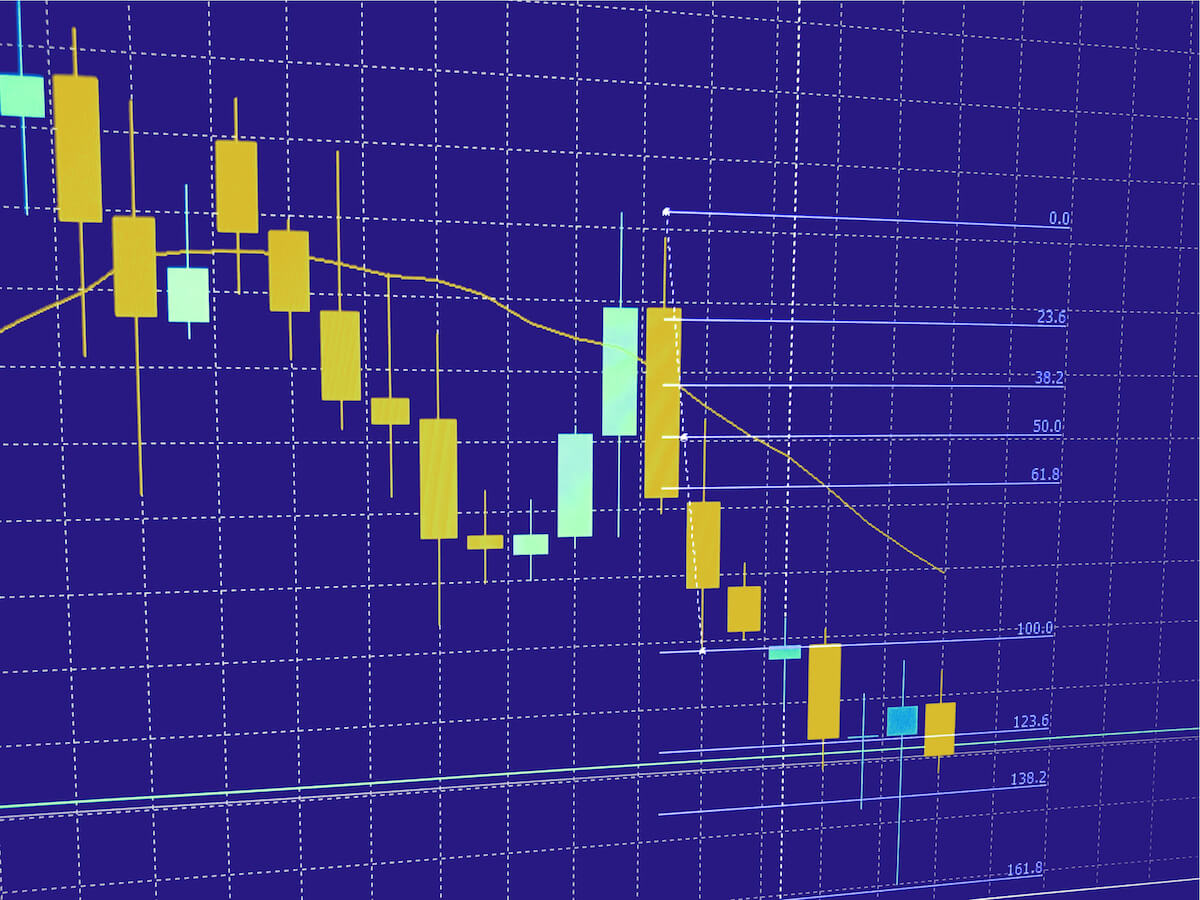
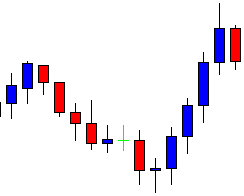
The candle comes out as a bullish engulfing candle closing well above the resistance. The buyers may trigger a long entry right after the candle closes. Since it is an H1 chart, Fibonacci levels come extremely handy to determine the take profit level. We find out that in a minute. At first, let us find out what the price does.
The price heads towards the North with extreme bullish momentum. It produces only one bearish candle and resumes its bullish journey. With naked eyes, we can tell that the price travels about 4R. It means as far as risk-reward is concerned, it is an excellent deal. Let us draw Fibonacci and see price trends from where to where.
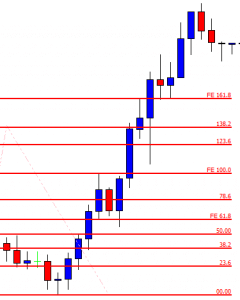
The price makes the bullish reversal at 61.8% and heads towards the level of 161.8% in a hurry. It makes a breakout at 161.8% consolidates and resumes its bullish move. Ideally, the buyers should set their take profit at 161.8%. It would allow them to take 1:2 risk-reward. However, we have seen here that the price travels towards the North even further than that. It often happens when the reversal candle comes out as a bullish engulfing candle, and it is produced at the key Fibonacci level at 61.8%. We may not be too greedy but set our take profit at 161.8% in such cases. However, back in our mind, we know that we are dealing with an excellent trade setup.