In today’s lesson, we are going to demonstrate an H1 chart offering an entry by using intraday support/resistance. To go with it, Fibonacci levels are used to spot out the stop-loss and take-profit levels. Let us now get started.

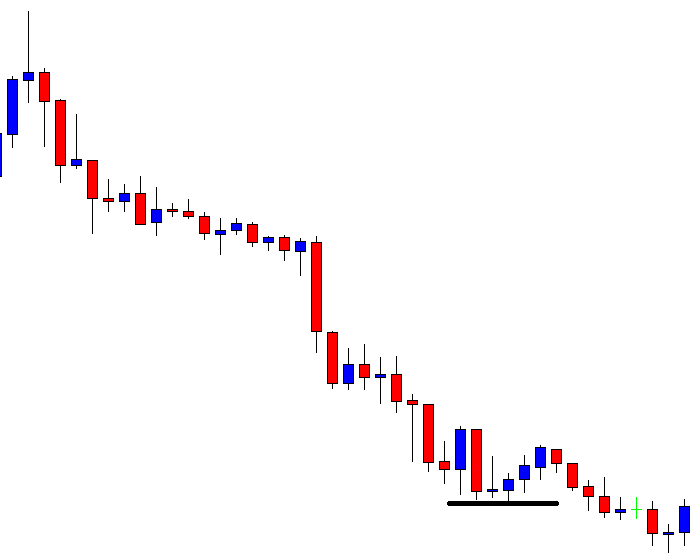
The chart shows that the price makes a long bearish move. The H1 chart makes a breakout at the last day’s lowest low (black drawn line). Usually, the chart attracts the sellers to look for short opportunities upon getting a bearish reversal candle. However, look at the combination of the last three candles. It is called Morning Star, which is one of the strongest bullish reversal patterns.
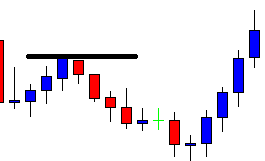
The price heads towards the North and goes back in the last day’s lowest low. Moreover, it makes a breakout at today’s highest high as well (black drawn line). Within four candles, the chart looks good for the buyers. The buyers may look to go long in the pair upon getting a bullish reversal candle at the breakout level.
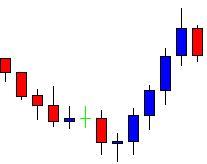
The chart produces a bearish candle. The breakout level seems to hold the price as a level of support. A bullish reversal candle at the level may attract the buyers to go long and push the price towards the North further.
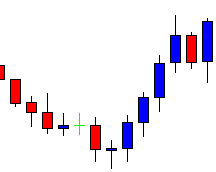
Here it comes. The chart produces a bullish engulfing candle right at the breakout level. The buyers may trigger a long entry right after the last candle closes by setting stop loss below the lowest low of the signal candle. We are going to talk about the take profit level in a minute. Let us find out how the trade goes.
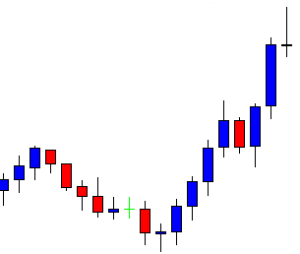
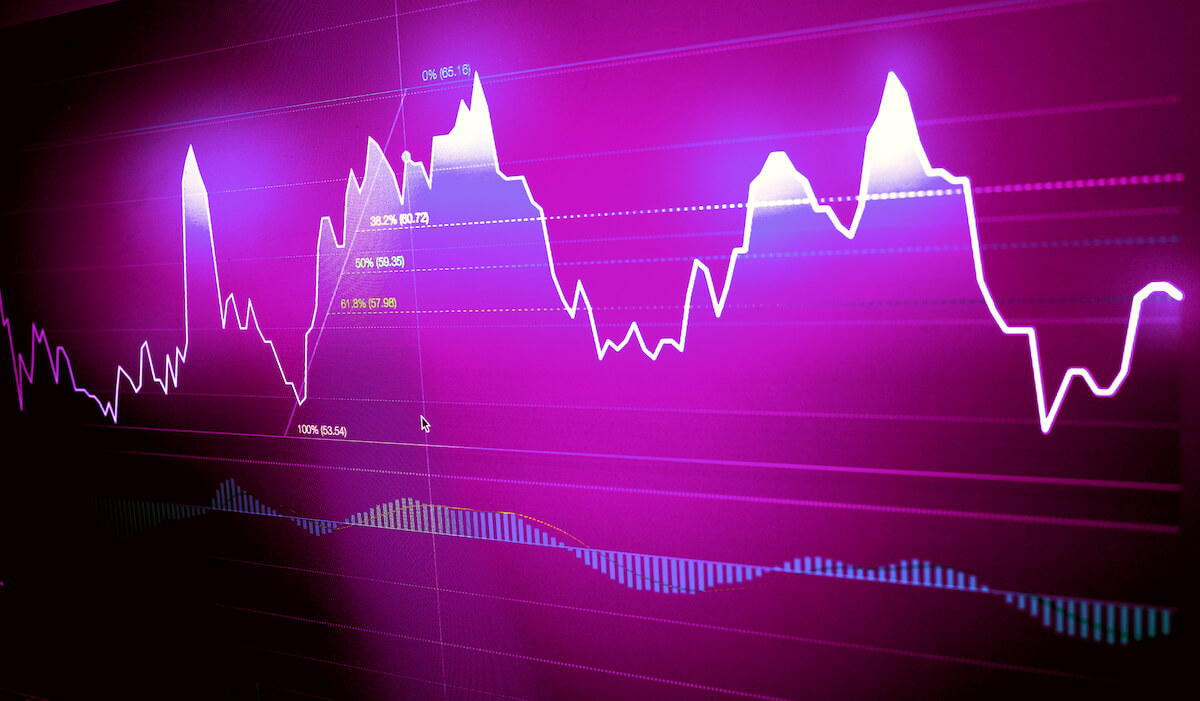
The chart produces a bullish candle. The price heads towards the upside with the next candle as well. However, the candle comes out as a Doji candle having a long upper shadow. It suggests that the price may make a bearish correction or make a bearish reversal. Since the trade setup is based on the H1 chart, the buyers may lose a good number of pips if they are to wait for the chart to produce a reversal candle to close their entry. It is tough to manage trade in the H1 chart manually. Thus, setting the take profit is the best way. The question is, where should we set our take profit? In this regard, Fibonacci levels come extremely handy. Let us draw the Fibonacci levels in the chart and find out how they work in the chart above.
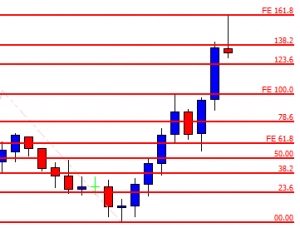
There you go. The price produces a bullish reversal candle at 61.8% level and heads towards the level of 161.8%. It means the buyers may achieve 1:2 risk-reward easily by using Fibonacci levels in intraday trading. In our fore coming lessons, we are going to demonstrate more examples of integration of Fibonacci levels and intraday trading. Stay tuned.