Introduction
For forex traders, the producer prices change come as an afterthought. The changes in the prices of the output by domestic producers is a vital macroeconomic indicator since it is considered a leading indicator of inflation. Therefore, understanding how these changes impact the economy, the rate of inflation, and the currency can be useful to forex traders.
Understanding Producer Prices Change
Producer prices change in the United States is measured using the producer price index (PPI). The PPI is a weighted index that measures the change in the price of finished goods and services sold by producers.
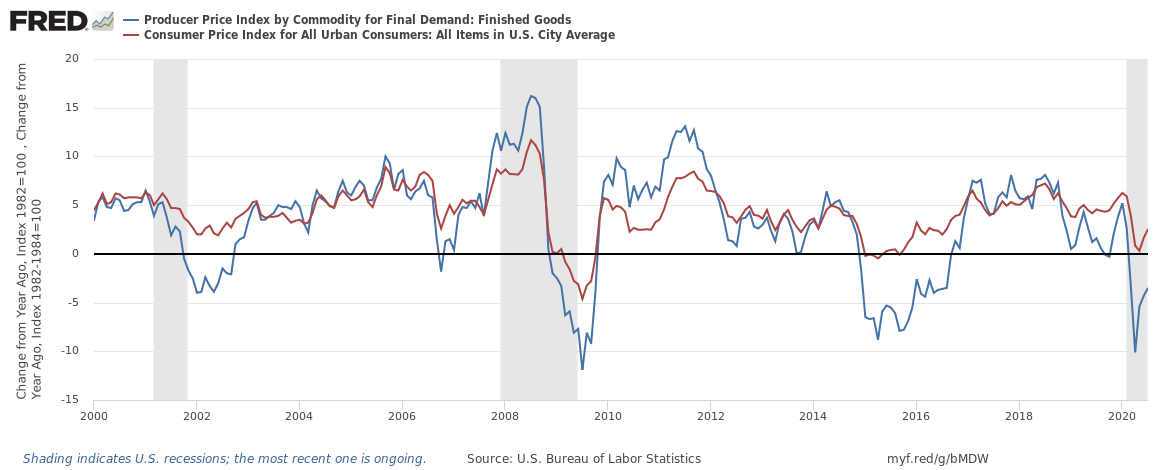
The consumer price index is the most cited metric for measuring inflation. However, PPI can be used as a measure of inflation; because it tracks the changes in prices from the perspective of producers. CPI tracks price changes from the consumers’ perspective. Therefore, PPI can be used as the foremost tracker of inflation since it measures the changes in the prices of output before it is distributed to the consumers. PPI can be considered to the purest change in the prices of output since it does not include the changes caused by sales taxes and mark-ups by retailers. Hence, PPI is predictive of the CPI, as shown by the correlation in the chart below.
Source: St. Louis FRED
Since the PPI does not represent the general and final changes in the prices of goods and services in an economy, it is regarded as a weak economic indicator in the forex market.
How PPI is measured
Although the PPI is quoted as the change in the price of the producers’ output, it is measured in three distinct stages based on the level of production. They include the PPI Commodity Index, which measures the changes in the price of input materials, PPI Processing Index, which measures the changes in the price of intermediate goods, and Core PPI, which measures the finished output.
It is worth noting that the prices of food and energy are considered to be highly volatile and are therefore not included in the computation of the core PPI. This omission is justified by the fact that their prices are reliant on the short term supply and demand, which makes it difficult to compare these prices in the long-run.
As mentioned earlier, PPI is a weighted index. Weighting means the size and importance of the items sampled are used. The changes in prices compared to those of 1982 as the base year.
How can the PPI be used for analysis?
The inflation data is among the most-watched economic indicators because the rate of inflation informs the monetary and fiscal policies in a country. Being a leading indicator for the CPI, the PPI serves an important role. This role is precipitated by the fact that inflation is one of the primary drivers of monetary and fiscal policies.
Rising inflation signifies the availability of cheap money, which encourages spending and investments. The Federal Reserve then raises interest rates to reduce the amount of money in circulation. At higher interest rates, borrowing money becomes expensive hence reducing consumption. Similarly, it becomes lucrative for households to save money since they earn more. Postponing consumption tends to reduce the amount of money I circulation hence lower rates of inflation.
Inarguably, low rates of inflation result in a stagnant economy. Although inflation is good for the economy, when it gets out of hand, it results in a rapid depreciation of a country’s currency. It is for this reason that the central banks use interest rate policies to set the desired maximum and minimum inflation rate. In the US, for example, the Federal Reserve has set the country’s inflation target at an average of 2%.
An increase in the PPI signifies that the overall rate of the CPI will also increase. This increase will reduce the purchasing power of the country’s currency since the same amount of money will afford a lesser quantity of goods and services. Therefore, an increasing rate of inflation encourages consumption within an economy because savers will be afraid that their money will lose value.
This increased consumption leads to growth within an economy. Conversely, a decreasing PPI signifies that the overall inflation is likely to reduce. This reduction, in turn, encourages people to save their money hence reducing the rate of consumption in an economy.
Inflation can result in a feedback loop. Hence, rising inflation will encourage more expenditure and investment in an economy leading to further inflation. This feedback loop occurs when savers opt for consumption to avoid the depreciation of their money; this, in turn, increases the amount of money in circulation, which causes the purchasing power of money even to reduce further.
Impact on Currency
The end goal for any forex trader is to establish whether a change in any fundamental indicator will lead to an interest rate hike or cuts. This anticipation is what primarily impacts the price action in the forex market.
A rising PPI signifies rising inflation, which would be accompanied by an increase in the interest rates. Since the increasing interest rate is good for the currency, an increase in PPI results in appreciation of the currency relative to others.
Conversely, dropping levels of PPI signifies that the overall rate of inflation will fall. Therefore, a steadily dropping PPI forestall a drop in the interest rate. Therefore, decreasing levels of PPI leads to a depreciating currency.
Sources of Producer Price Changes
The producer price changes data can be accessed from the US Bureau of Labor Statistics, along with the monthly updates. A comprehensive look into the US PPI data can also be accessed from St. Louis FRED website. Statistics on global producer price changes can be accessed at Trading Economics.
How PPI Data Release Affects The Forex Price Charts
The most recent PPI data was released on August 11, 2020, and can be seen at Forex factory here. A more in-depth review of the PPI report from the Bureau of Labor Statistics can be accessed at the BLS website.
As can be seen, both the monthly PPI and core PPI data are expected to have a high impact on the USD upon release.
The screengrab below shows the most recent changes in the MoM PPI and core PPI in the US. In July 2020, the monthly PPI increased by 0.5% compared to a 0.3% decrease in June. The core PPI increased by 0.6% in July compared to a 0.2% decrease in June. Both changes in the MoM PPI and core PPI were better than analysts’ expectations of 0.1% and 0.3% increase, respectively.
Now, let’s see how this release made an impact on the Forex price charts of a few selected pairs.
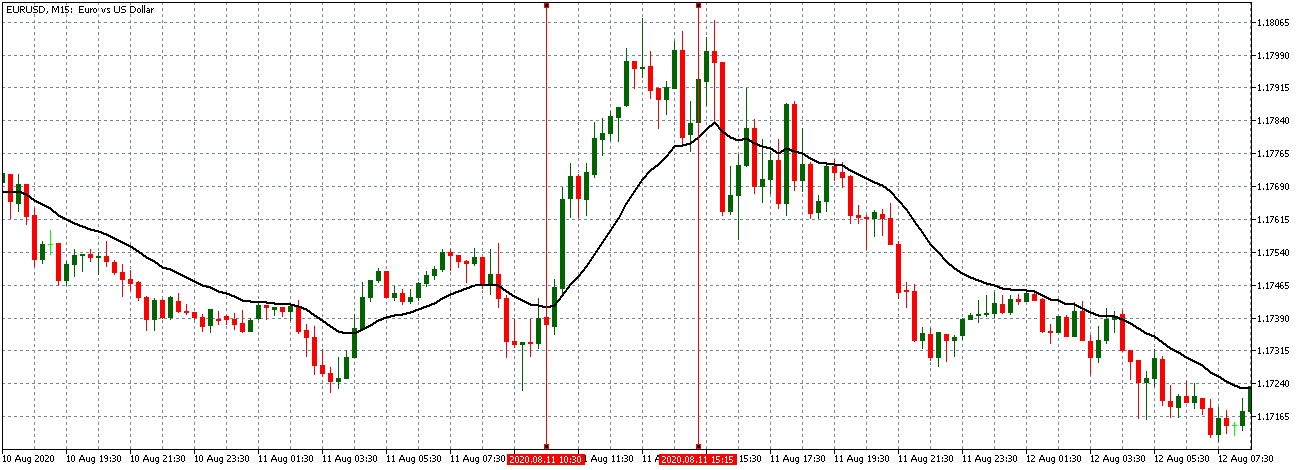
EUR/USD: Before Monthly PPI Release on August 11, 2020,
Just Before 8.30 AM ET
As can be seen from the above 15-minute chart of EUR/USD, the pair was on a steady uptrend before the release of PPI data. This trend is evidenced by candles forming above the steeply rising 20-period MA. However, 30 minutes before the release, the steady uptrend tapered with the 20-period MA peaking.
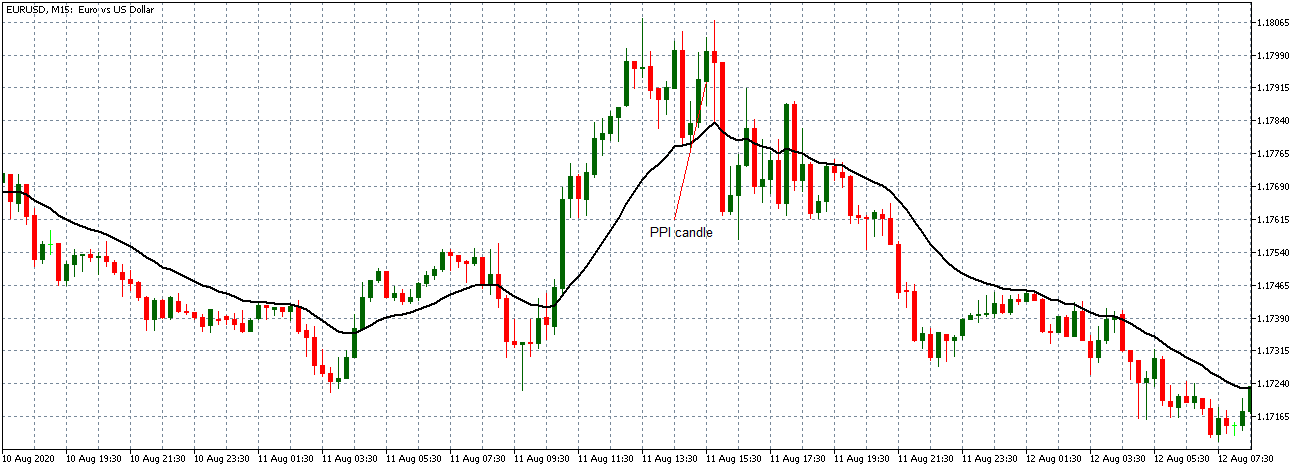
EUR/USD: After Monthly PPI Release on August 11, 2020,
at 8.30 AM ET
After the PPI data release, the pair formed a 15-minute bullish candle followed by a period of volatility. The pair later adopted a bearish trading pattern with the 20-period MA steadily sloping downwards, showing that the USD became stronger as expected.
Now let’s see how this news release impacted other major currency pairs.
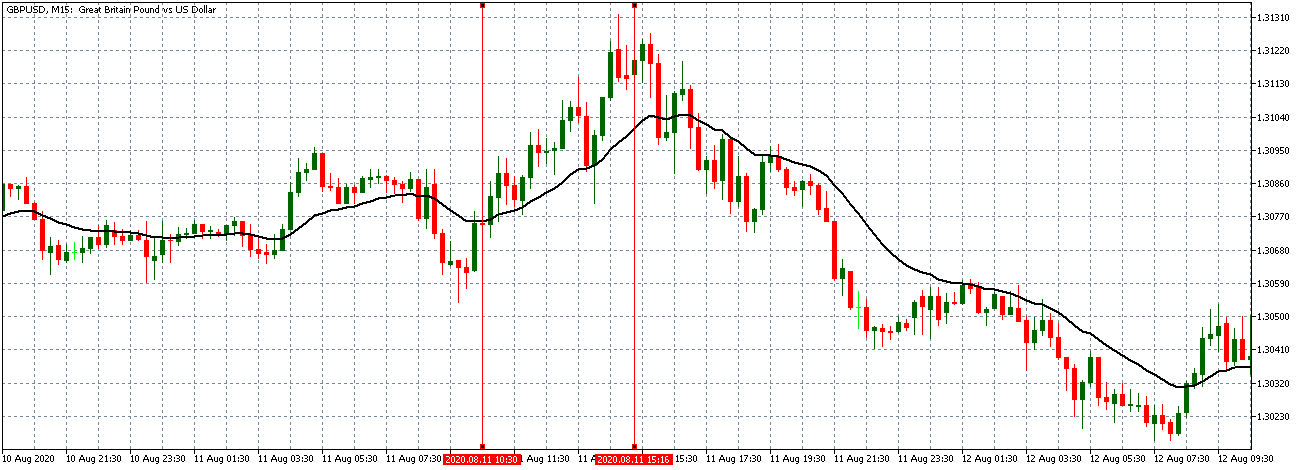
GBP/USD: Before Monthly PPI Release on August 11, 2020,
Just Before 8.30 AM ET
Before the news release, the GBP/USD pair showed a similar steady uptrend as observed with the EUR/USD pair. As seen above, the 20-period MA is steeply rising with candles forming above it.
GBP/USD: After Monthly PPI Release on August 11, 2020,
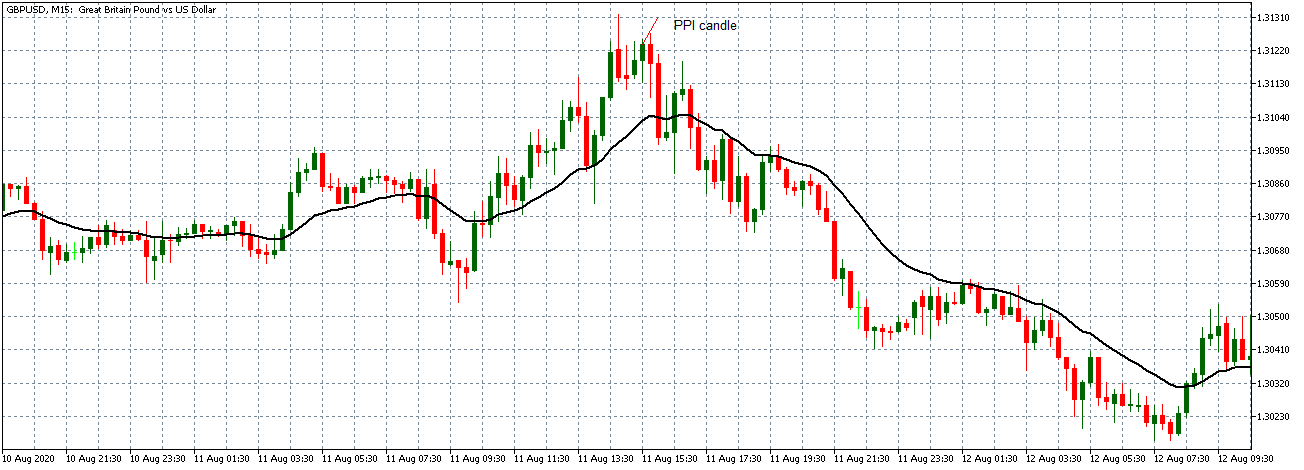
at 8.30 AM ET
After the PPI release, the pair formed a 15-minute bullish “hammer” candle. As with the EUR/USD, the pair subsequently reversed the uptrend and traded in a steady downtrend, the 20-period MA sloping downwards.
AUD/USD: Before Monthly PPI Release on August 11, 2020,
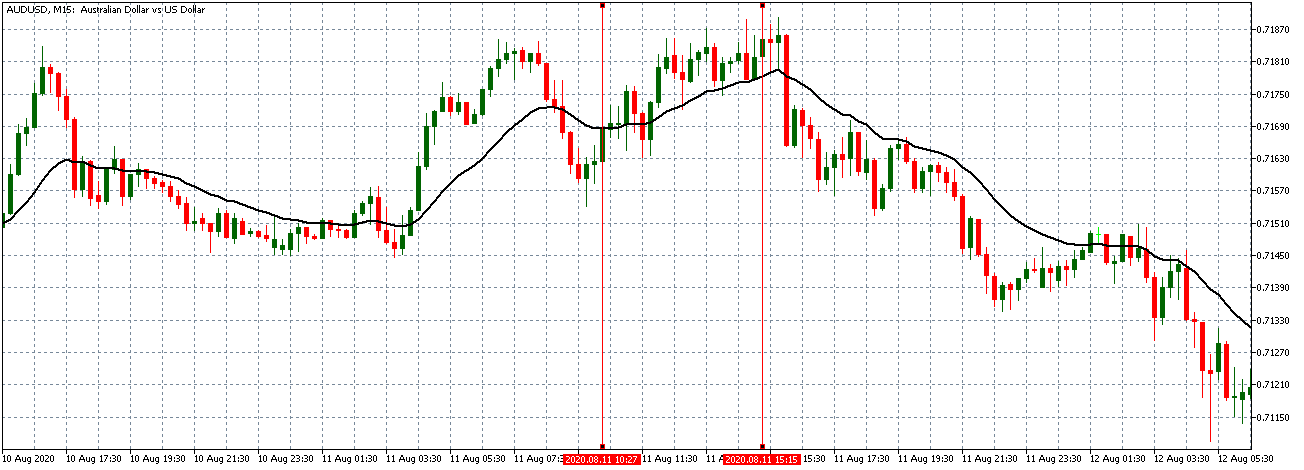
Just Before 8.30 AM ET
AUD/USD: After Monthly PPI Release on August 11, 2020,
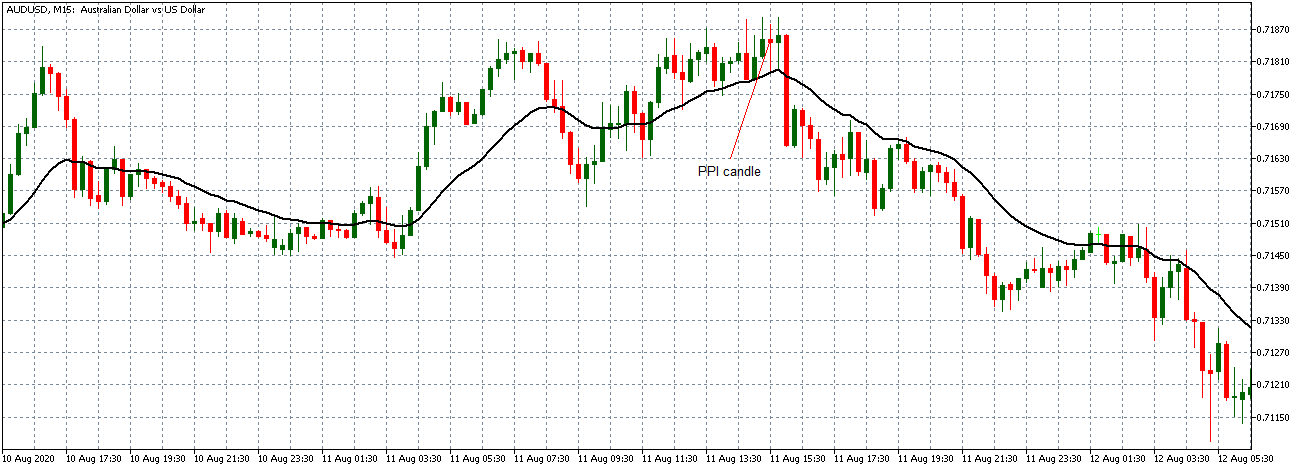
at 8.30 AM ET
Unlike the strong uptrend observed with the EUR/USD and GBP/USD pairs, the AUD/USD pair traded in a weak uptrend before the PPI data release. This trend is evidenced by candles forming just around the slightly rising 20-period MA. After the news release, the pair formed a 15-minute “bearish Doji” candle signifying a period of volatility. The pair subsequently reversed the trend adopting a steady bearish stance with the 20-period MA sloping downwards.
Bottom Line
Although the PPI is a relatively low impact fundamental indicator compared to the CPI, this analysis has proved that its release has a significant impact on the price action. Forex traders should avoid having any significant positions open before the release of the PPI.

