Categories
Forex Price Action

Do Not Be Biased, Take Decisions According to the Chart

In today’s lesson, we are going to demonstrate an example of a chart that makes a good bullish move but ends up having a rejection at a double top resistance. The price then shows the potential to make a bullish breakout. However, it has another rejection around the last week’s high and makes a bearish breakout. It looks good for the sellers at the time. We find out what happens afterward.

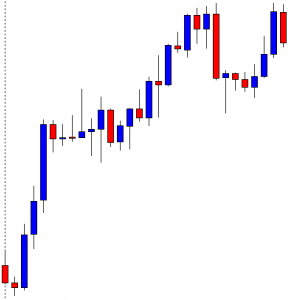
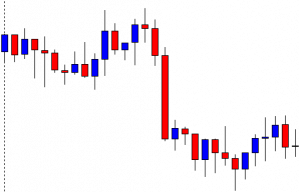
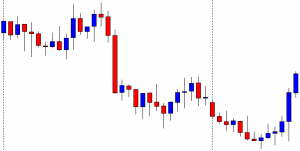
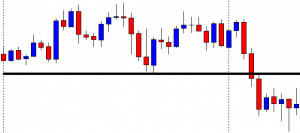
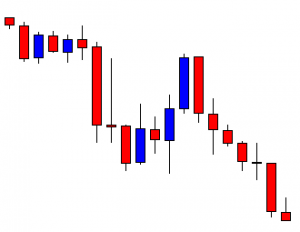
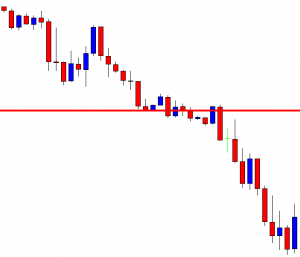
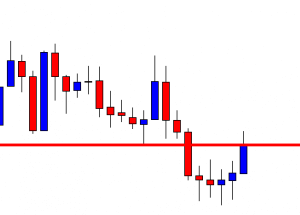
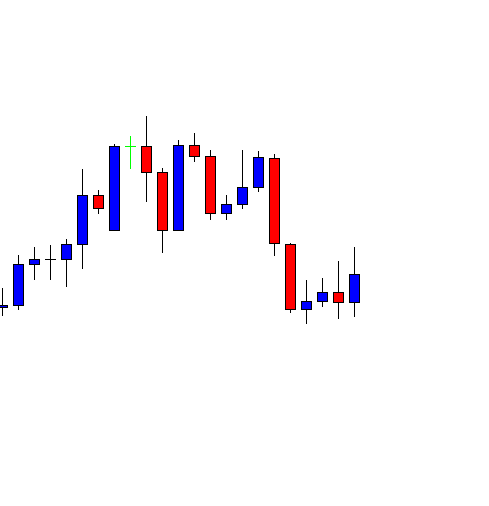
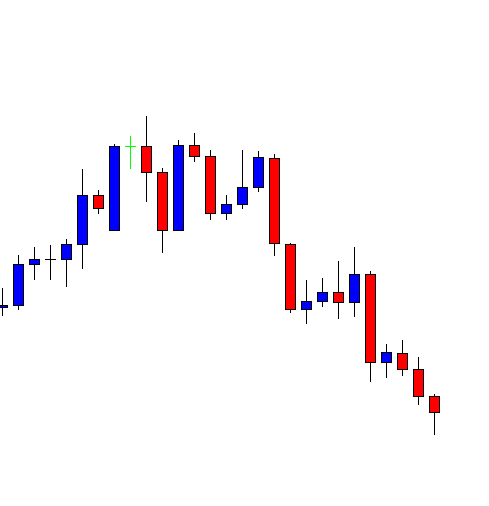
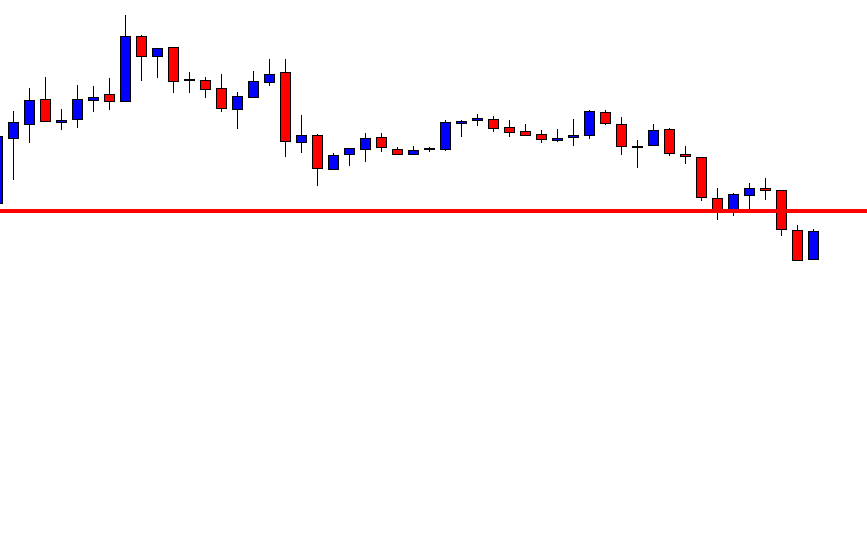
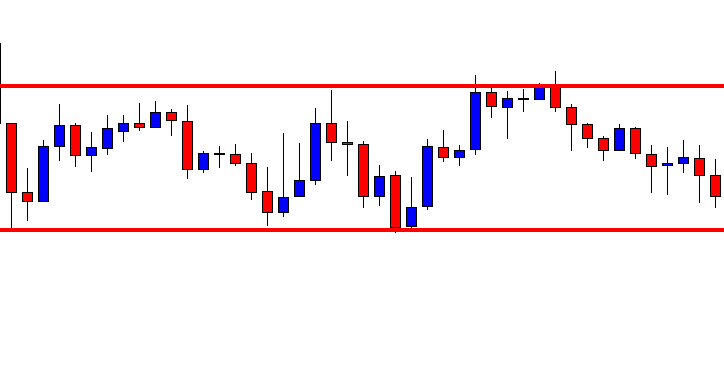
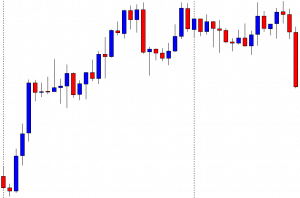
This is the H4 chart. The price makes a long bullish move. It ranges for a while and then continues its bullish journey again. Look at the last candle on the chart. It comes out as a bearish inside bar. Do not miss the point that the candle is produced right at the resistance, where the price has had a rejection.

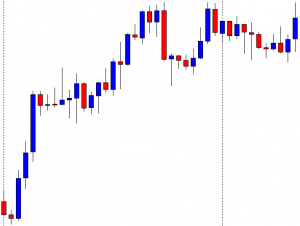
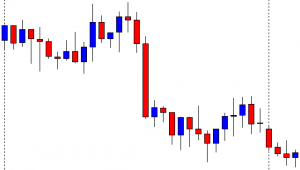
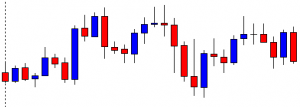
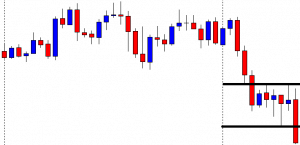
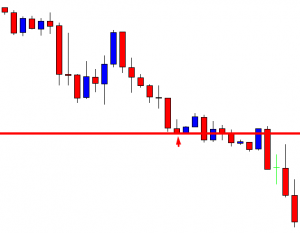
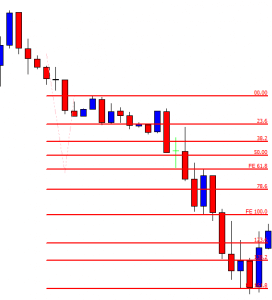
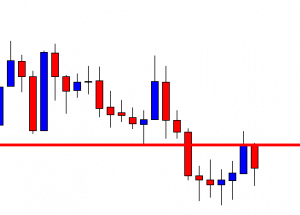
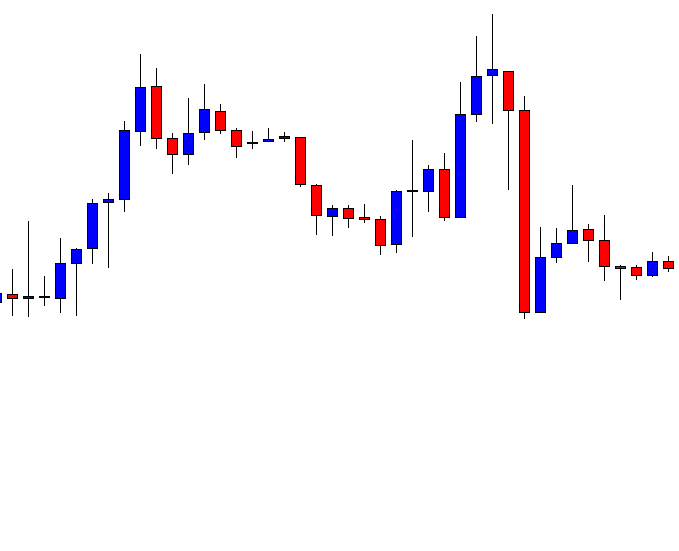
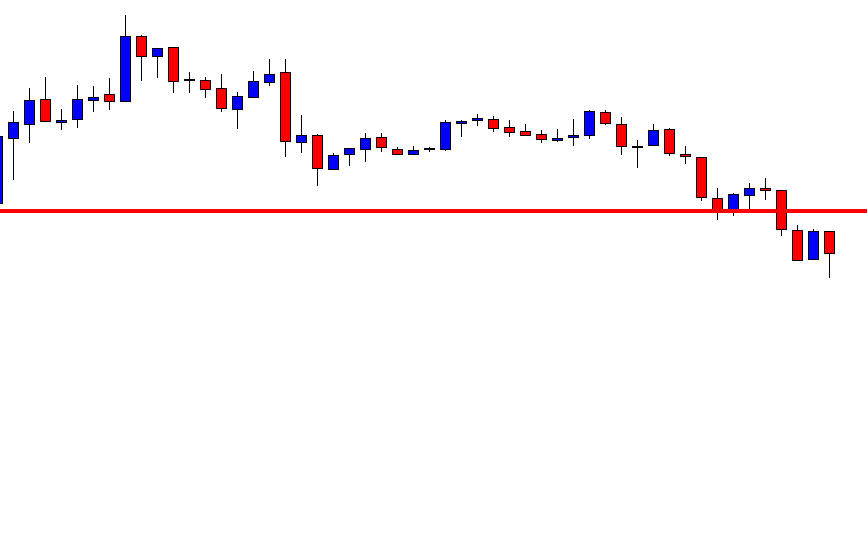
The chart produces a bullish candle to start the next week. It then ranges for a while and produces two bullish candles. It seems that the price may head towards the North and makes a bullish breakout at the last weekly high.

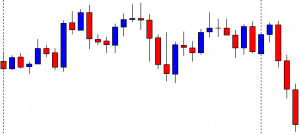
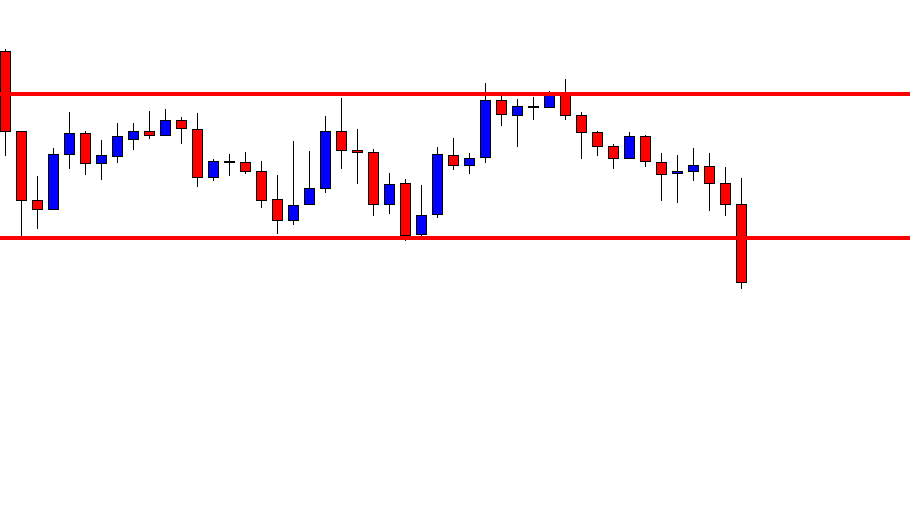
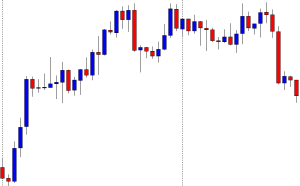
It does not. It rather finds its resistance around the same level. Moreover, it produces a bearish engulfing candle. To be more precise, the chart produces an evening star. It is a strong bearish reversal candle. Let us wait and see what the price does next.

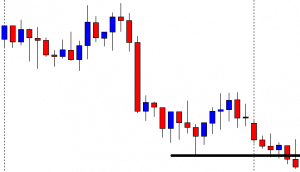
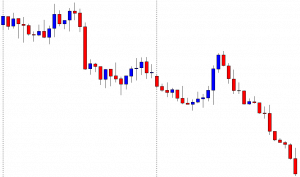
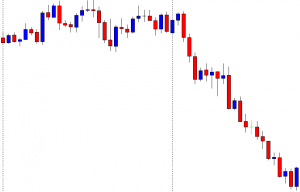
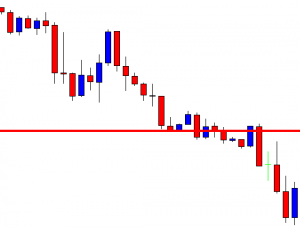
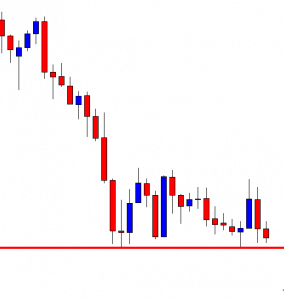
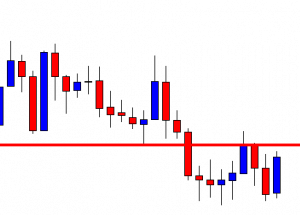
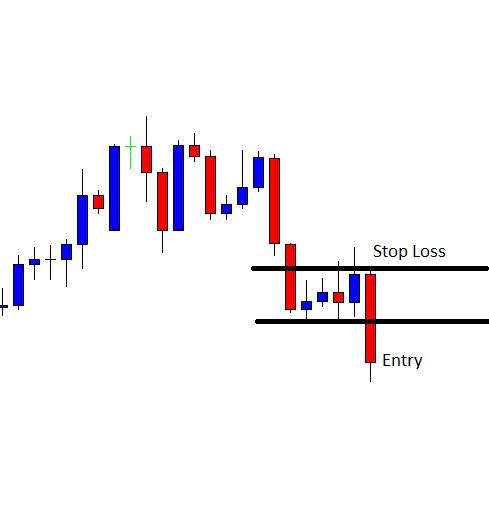
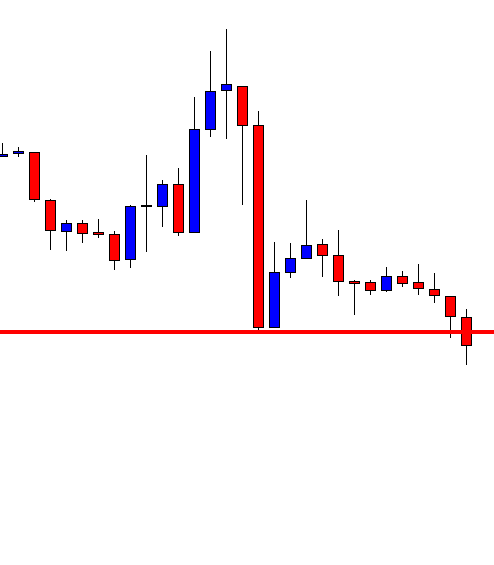
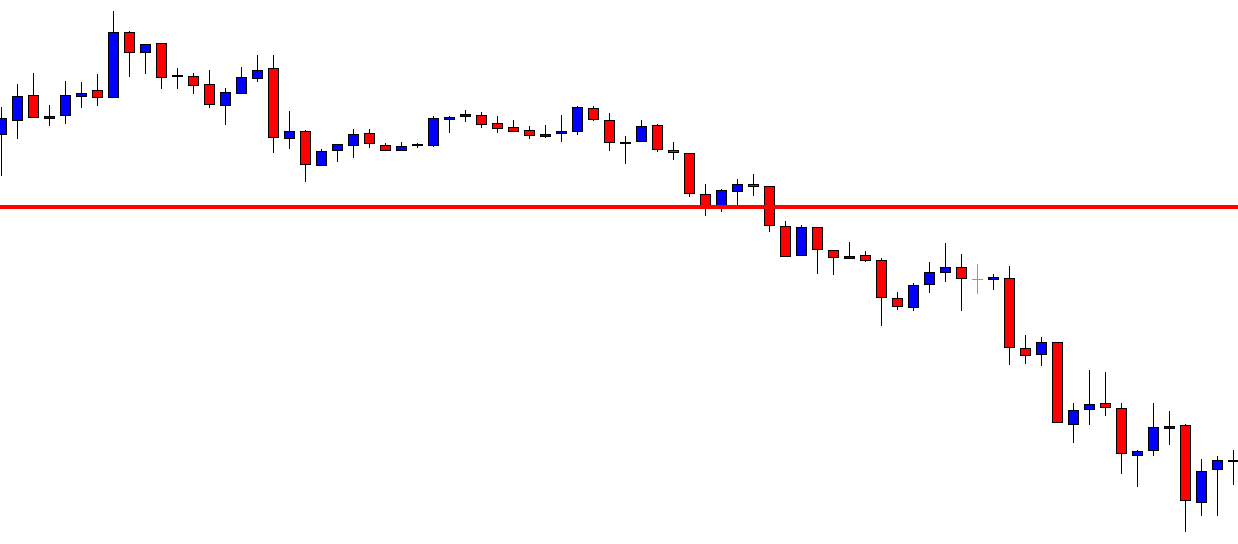
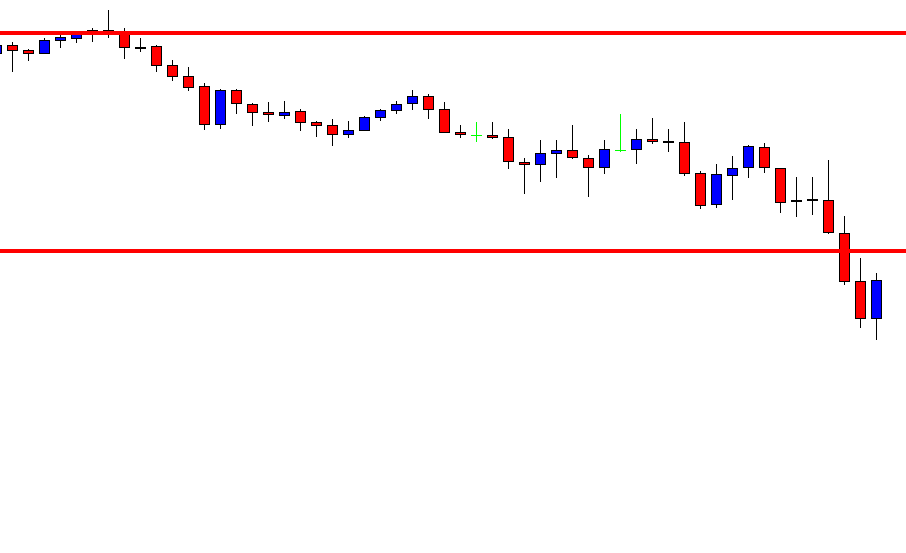
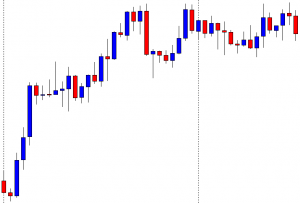
The chart produces a long bearish candle breaching the last swing low. The breakout is significant since the price trends from the last weekly low. The sellers may keep their eyes in the pair to go short. Before going short on this chart, the sellers shall wait for the price to make a bullish retracement since the price is within the last weekly range. Keep that in mind that the price is to make a bullish correction to offer a short entry.

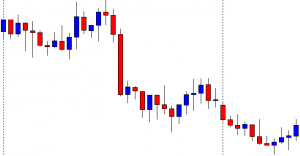
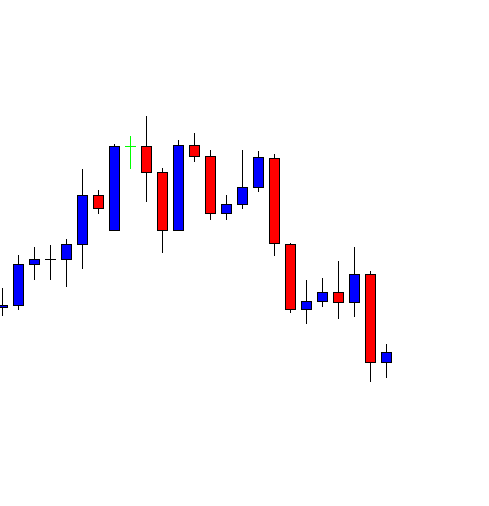
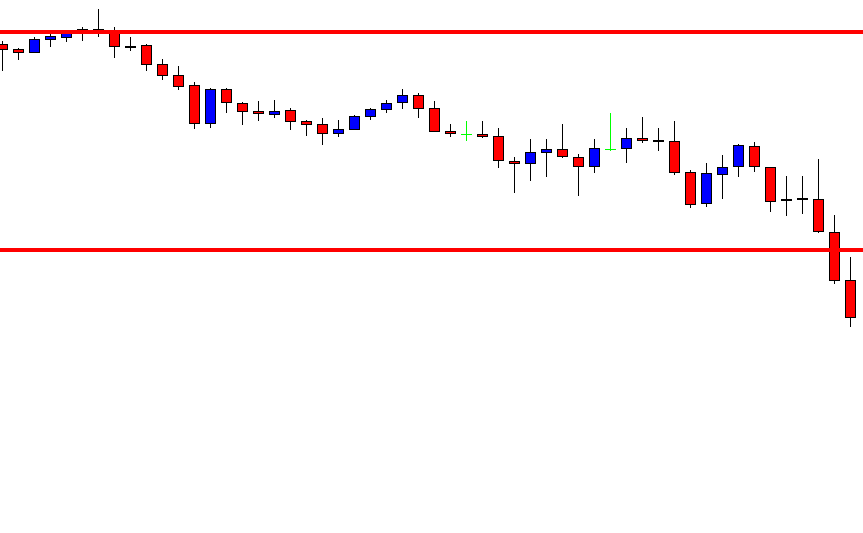
The price does not make a bullish correction. It rather consolidates and produces a bearish reversal candle. Since the price is within the last weekly range, so it is not a short signal.

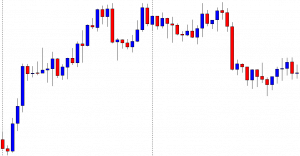
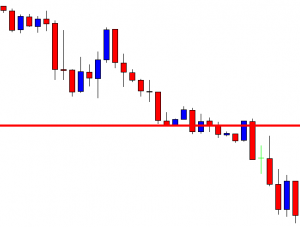
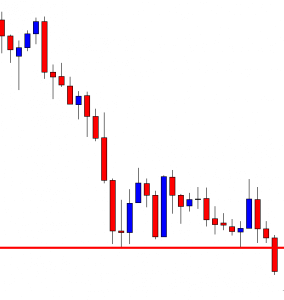
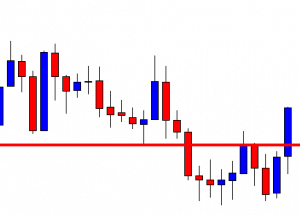
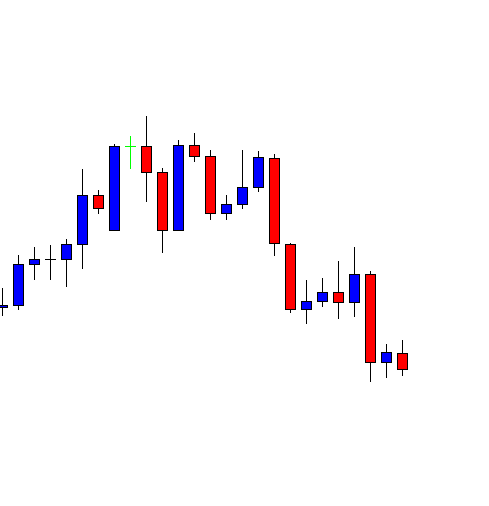
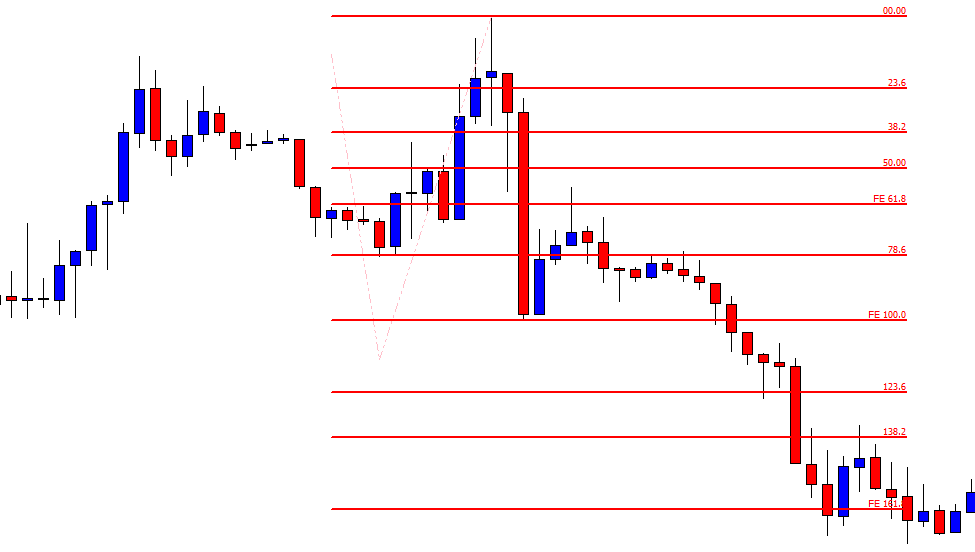
Here it goes. The price gets choppy. This chart becomes a risky chart to trade. Thus, traders might as well skip eyeing on the chart to trade at. At first, it looks good for the buyers. Then, it shows potential for the Bear to dominate since the price has several rejections at the same level. However, it ends up being an extremely choppy chart.  Thus, do not be biased with your initial assumption. Wait for the breakout, confirmation, and then trade.

Categories
Forex Price Action

Some Moves do not Belong to the Chart that You Follow

In today’s lesson, we will demonstrate an example of a chart that makes a breakout at the last weekly low. The price then goes back within the last weekly range and makes an interesting move. We will find out what that interesting move is all about in a minute. Let us get started.

It is the H4 chart. The chart shows that the price makes a bearish move. It finds its support and trades around it for a while. The last candle of the week comes out as a Doji candle. The sellers may keep their eyes on the chart to get a bearish breakout and find short opportunities.

The first candle of the week comes out as a bearish candle. The price heads towards the level of support, and it produces a hammer. The price may roam around the level of support before making its next move. Let us proceed to find out what happens next.

The chart produces two bearish candles. One of the candles closes well below the level of support. The sellers may keep the chart on their watch list closely. They may wait for the price to consolidate and produce a bearish reversal candle to go short in the pair.

The chart produces four candles with a bullish body. The last candle comes out as a commanding bullish candle closing above the breakout level. If the chart still produces a bearish engulfing candle closing below the last swing low, the sellers may still go short in the pair. However, it does not look that good for the sellers.

As expected, the price heads towards the North further. One of the candles closes above the weekly opening as well. It means the H4 sellers may skip eyeing on the chart to go short. The chart does not belong to the H4 sellers anymore. The buyers may go long on the pair upon bearish retracement followed by a bullish reversal candle at the key level of support though. That is another ball game. Let us find out what the price does afterward.

What a strong bearish move that is! The price does not produce a bullish reversal candle. It makes a strong bearish move and makes a new swing low instead. However, the H4 sellers upon weekly high/low breakout may not be able to catch the move. The move belongs to other chart traders. Most probably, the sellers on the daily chart can catch such a move.

We often find such a move that may not offer entry on the chart that we follow. Do not get disappointed. Stick to your chart and trading strategies. Something must be round the corner for you.

Categories
Forex Daily Topic Forex Price Action

Weekly High/Low Offers a Better Reward in the H4 Chart Trading

We are going to demonstrate an example of a trade setup on the H4 chart. The price, after breaches the last week’s low; it consolidates and produces a strong bearish reversal candle. It then heads towards the South with extreme bearish momentum. Let us find out how that happens.

It is an H4 chart. Look at the vertical line on the left. It is the beginning of the week. The chart shows that the price gets trapped within two horizontal levels. The pair is about to finish its trading week. The chart suggests that both the sellers and the buyers are going to keep their eyes on the chart next week to get the breakout and trade.

The pair produces two bullish candles consecutively to start its trading week. However, it produces a bearish engulfing candle and drives the price towards the South. Do you see anything here? Yes, the pair makes a breakout at the last week’s low. It means that the Bear may dominate on the H4 chart. Ideally, traders are to wait for the price to consolidate or make a bullish correction followed by a bearish breakout to go short in the pair.

The price consolidates. It produces some bearish reversal candles such as spinning top, hammer, Doji candle. However, it does not make a breakout at the last swing low. The sellers must wait for an H4 candle to close below consolidation support. Let us wait for more and see what the price does.

The chart produces a bearish engulfing candle closing well below consolidation support. The sellers may trigger a short entry right after the last candle closes. They may set their stop loss above consolidation resistance and set their take profit with 2R. This is the beauty of using weekly high/low and the H4 chart. It offers an excellent reward. Let us now proceed and find out how the entry goes.

The price heads towards the South with good bearish momentum. It produces three bullish inside bars in this move. The last candle comes out as a bullish engulfing candle. The sellers may consider closing their entry and come out with the profit. If we count, we find that the entry offers more than 2R reward. This is what usually happens when the price makes an H4 breakout at the last week’s high/low. Deep consolidation and a strong reversal candle add more fuel to its journey as usual. In our fore coming lessons, we will learn to integrate Fibonacci levels in this strategy to determine our target with better accuracy. Stay tuned.

Categories
Forex Signals

Gold – Breakdown Suggests Further Declines

Description

Gold prices in its 2-hour timeframe remain moving in a consolidation structure identified as a triangle pattern. At the same time, the price action reveals a breakdown in its internal sequence, suggesting the likelihood of additional drops.

According to the Elliott wave theory, the price advances in a triangle pattern, which consolidates the first downward movement that began when the precious metal topped at $2,075.14 per ounce on August 07th. With the short-term ascending trendline between waves d and e of Subminuette degree identified in green, the yellow metal unveiled the completion of wave e. It opened the possibility of a new bearish leg of the upper degree.

On the other hand, the RSI oscillator shows a breakdown that pierced below level 40 and consolidated in 41.4, confirming the intraday breakdown developed by the precious metal and increasing the downward move’s likelihood.

In a conservative scenario, the Gold prices could decline toward the $1,925.93 per ounce, which corresponds to the last swing of September 09th. The invalidation level of our bearish scenario will occur if the price soars over $1,952.93 per ounce.

Chart

Trading Plan Summary

  • Entry Level: $1,943.93 per ounce
  • Protective Stop: $1,952.93 per ounce
  • Profit Target: $1,925.17 per ounce
  • Risk/Reward Ratio: 2.08
  • Position Size: 0.01 lot per $1,000 in trading account.


Check out the latest trading signals on the Forex Academy App for your mobile phone from the Android and iOS App Store.

Categories
Forex Daily Topic Forex Fibonacci

Intraday Trading: How Fibonacci Levels Help You Determine Entry and Take-Profit Levels

In today’s lesson, we are going to learn an intraday trading strategy using the previous day’s highest high or lowest low. When the price makes a breakout at yesterday’s highest high or lowest low, the price usually trends towards the breakout direction. In today’s lesson, we are going to demonstrate an example of a bearish breakout. After making a bearish breakout at the previous day’s lowest low, the price consolidates and produces a bearish engulfing candle at a significant Fibonacci level. Then, it heads towards the South with good bearish momentum. We try to find out the Fibonacci level where the price trends from as well as the take profit level where the price may make a reversal. Let us proceed.

This is an H1 chart. The chart shows that the price makes a bearish move by producing an ABC pattern. The last candle closes the trading session at the lowest low of the day. The next chart shows that the price consolidates around the lowest low of the previous trading day and makes a good bearish move.

The chart suggests that it becomes intraday sellers’ territory. The sellers may look to go short in the pair. The question is how and when. Let us find these two answers.

The last candle comes out as a bullish candle. Since the chart has been bearish, the sellers may wait for the chart to produce a bearish reversal candle to go short below consolidation support. Here is another equation that they must consider. We will find that out in a minute.

The chart produces a bearish engulfing candle. The sellers may trigger a short entry right after the last candle closes. A question may be raised here that the chart produces a bearish engulfing candle earlier right at the breakout level. We have not concentrated on that to go short from there. However, we have planned to go short right after the last candle closes. What are the reasons behind this? Let us find out how the price reacts after the last candle is produced.

The price heads towards the South with good bearish momentum. The chart produces a bullish reversal candle. It may change its trend or make a bullish correction, at least. For intraday traders, they cannot afford to wait as many pips by waiting to get a bullish reversal candle. They are to close the trade right after the last bearish candle. The question is, how would they know that they should set their take profit at that level?

The answer is Fibonacci levels. Do you remember I was talking about the level for the price to resume its bearish move, we find that out by Fibonacci levels as well. See, the chart produces a bearish engulfing candle at the level of 61.8%, and it hits 161.8%. These are two levels intraday traders must count when a pair trades below the previous day’s lowest low or vice versa. Stay tuned for more lessons for intraday trading with Fibonacci levels.

Categories
Forex Daily Topic Forex Price Action

Evaluate Whether the Chart Belongs to Your Strategy or Not?

In today’s lesson, we are going to demonstrate an example of an H1 chart, where the price makes a bearish breakout and produces a bearish reversal candle upon making a bullish correction. However, things do not go as the sellers would like. Let us find out what happens and what the reason may imply.

The chart shows that the price produces two bearish candles consecutively. The level of support seems to be a strong one. It may produce a bullish reversal candle and push the price towards the North. However, the sellers may wait for the price to make a bearish breakout at the level of support.

Here it comes. The next candle breaches the level of support closing well below the level. This is one good-looking breakout candle. The sellers are to wait for the price to consolidate or make a bullish correction to produce a short signal.

The price makes a bullish correction. The last candle closes within the breakout level. Please pay attention to the number of candles the chart uses to make the bullish correction. The chart takes five candles to complete the correction. It means the level of support has become H4 support. Let us proceed to the next chart.

The chart produces a bearish inside bar. This is a bearish reversal candle, of course. However, the question may be raised here whether the sellers take a short entry depending on the H1 chart or not? Let us assume that a seller triggers a short entry by setting stop-loss above the breakout level.

The next candle comes out as a bearish candle. However, the last candle comes out as a bullish engulfing candle. The level is H4 support now. Thus, the buyers may look to go long in the pair and drive the price towards the North. It does not look good for the seller. The price may hit stop loss.

The next candle comes out as a strong bullish candle closing well above the breakout level. The short entry has been wiped off. If we consider the sequence bearish breakout, bullish correction, bearish reversal candle at the breakout level, it seems perfect to go short in the pair. What goes wrong here? In the Forex market, any entry may go wrong. However, over here, the H1 sellers may miss the point that the support is not H1 support anymore. It is H4 support since the level of support holds five candles. This is why the H1 traders may skip taking the short entry in this chart. It often happens in combination trading that traders forget to calculate or synchronize the chart that they are trading at. However, to be successful in trading, traders must not miss this point.

Categories
Forex Price Action

The H4-Daily Combination Strategy: Do not Get Carried Away

In today’s lesson, we are going to demonstrate an example of an H4-daily chart combination trading. The lesson has an important message to remember for the H4-Daily combination traders. Let us get started.

The chart shows that the price produces a double top and heads towards the South with good bearish momentum. The daily candle closes as a bearish Marubozu candle having no lower shadow at all. The next trading day starts with a Spinning Top. It seems that the H4 chart starts having consolidation. The last H4 candle comes out as a bullish engulfing candle. This looks good for the sellers that the price is having consolidation after making a good bearish move. However, the H4-Daily combination traders must not forget one thing that the signal is to be produced within the next two candles. Otherwise, it becomes daily support.

The fifth H4 candle of the day comes out as a bearish engulfing candle. The candle closes well below consolidation support. The sellers may trigger a short entry right after the last candle closes by setting stop-loss above consolidation resistance and by setting take profit with 1R.

The next candle comes out as a bullish inside bar after triggering the entry. The sellers would love to get a long bearish candle here. However, a bullish inside bar suggests that the bear still holds the key. Let us proceed to the next chart.

The next candle comes out as a bearish engulfing candle. This looks extremely good for the sellers now. The price finds another resistance. This attracts sellers to add more short positions. Anyway, the H4-Daily combination traders are to wait for the price to hit their 1R take profit.

The price takes two more candles to hit the target. I would say that the price hits the target at a moderate pace here. Anyway, the H4-Daily combination strategy offers entry, and the trade setup works well for the sellers.

The message this lesson has is that we must not get carried away with bullish or bearish move followed by consolidation. The H4 chart is to produce a trade signal within the next day. If it does not, that chart does not belong to the H4-Daily combination trading strategy.  If it does, then the H4-Daily combination traders may trigger an entry.

Categories
Forex Fibonacci

How to Use Fibonacci Levels in the H1-15M Combination Trading

In today’s lesson, we are going to demonstrate an example of an H1 chart offering an entry. We find out how Fibonacci levels and 15-min chart help us take the entry. Let us get started.

This is an H1 chart. The chart shows that the price after making a strong bearish move has been making an upward correction. The chart produces a Shooting Star and creates a bearish momentum. However, the sellers are to wait for the chart to make a breakout at the lowest low of the wave. Let us proceed to the next chart to find out what the price does next.

The price keeps driving towards the South and makes a breakout at the lowest low. The breakout candle has a long lower shadow, but it closes well below the level of support. The H1-15M combination traders may flip over to the 15M chart now.

This is how the 15M chart looks. The last candle comes out as a bullish candle. The sellers are to wait for a bearish reversal candle to go short in the pair. They must concentrate hard on the chart. It is waiting time for the sellers.

The 15M chart produces a bearish reversal candle. The candle has a long lower shadow but has a thick bearish body. Moreover, the H1 chart makes a breakout, so a 15M bearish reversal candle means a lot to the sellers. The sellers may trigger a short entry right after the last candle closes. There is another equation, which we will reveal in a minute. Let’s now find out how the trade goes.

The price heads towards the South with good bearish momentum. The 15M chart shows that it consolidates now and then. The H1 chart should look much more bearish than this. Ok, here is the equation we have pointed out a bit earlier. Let us draw Fibonacci levels and find out how it may help us set our stop-loss and take-profit levels.

The Fibonacci levels show that the price trends from the level of 61.8%. It makes a breakout at the level of 100.0 and heads towards the level of 161.8. When the price trends from 61.8%, it creates an extra momentum. This is what this example shows, as well. With Fibonacci, we know where to set the take-profit level. Yes, it is to be at 161.8%. With stop-loss, you may set it above 61.8% if you are too defensive a trader. If you want to be too tight with your stop loss, you may set it between 78.6% to 100.0%. The first one offers less risk-reward, but it has a higher winning percentage. On the other hand, the second one offers excellent risk-reward but has less winning percentage. The choice is yours.

Categories
Forex Daily Topic Forex Price Action

The H1-15M Combination Trading in a Bearish Market

In today’s lesson, we are going to demonstrate an example of the H1-15M combination trading strategy offering a short entry. In one of our previous lessons, we demonstrated an example of a long entry. Let us see how it ends up offering us the entry.

This is an H1 chart. The chart shows that the price gets caught within two horizontal levels. The chart shows that the price after getting the last rejection has been heading towards the South. The sellers are to wait for a bearish breakout to go short in the pair.

Here it comes. The last candle breaches the level of support closing well below it. The H1-15M combination traders may flip over to the 15M chart to get a bearish reversal candle for triggering a short entry. Let us flip over to the 15M chart.

This is how the 15M chart looks. As expected, the last candle comes out as a bearish candle. If the next 15M candle comes out as a bearish candle closing below the last candle, the sellers may trigger a short entry. If the chart consolidates, the sellers are to wait for a 15M bearish reversal candle to take the entry. Let us find out what happens here.

The chart produces a bullish corrective candle. The sellers are to wait for a bearish reversal candle to go short in the pair. Usually, if the price makes a correction, it goes towards the breakout level and produces a reversal candle there. Let us find out where it produces a bearish reversal candle for the sellers.

The chart produces a bearish engulfing candle closing below consolidation support. The sellers may trigger a short entry right after the last candle closes. Stop Loss and Take Profit are to be set according to the H1 chart. Stop Loss is to be set above H1 horizontal resistance before the breakout, and Take Profit is to be set with 1R. Let us now find out how the entry goes.

This is the H1 chart. We see that the price heads towards the South with good bearish momentum and hits the target of 1R with ease. After producing the 15M bearish reversal candle, the price never looks back but goes towards the trend’s direction. This is what usually happens in the H1-15M combination trading. The price heads towards the trend’s direction without wasting time.

Do a lot of backtesting in your trading chart to find out some entries based on the H1-15M chart. Then, do some demo trading with the strategy before going live. It will help you be a better trader.