
In today’s lesson, we will demonstrate an example of a chart that makes a breakout at the last weekly low. The price then goes back within the last weekly range and makes an interesting move. We will find out what that interesting move is all about in a minute. Let us get started.
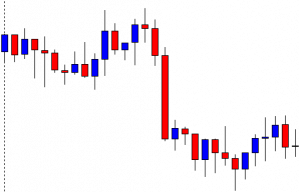
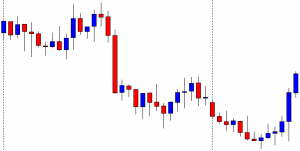
It is the H4 chart. The chart shows that the price makes a bearish move. It finds its support and trades around it for a while. The last candle of the week comes out as a Doji candle. The sellers may keep their eyes on the chart to get a bearish breakout and find short opportunities.
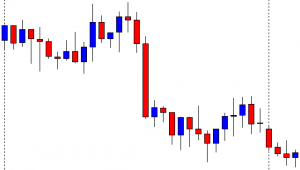
The first candle of the week comes out as a bearish candle. The price heads towards the level of support, and it produces a hammer. The price may roam around the level of support before making its next move. Let us proceed to find out what happens next.
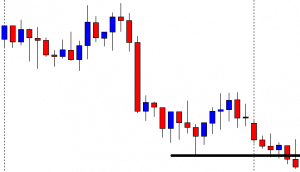
The chart produces two bearish candles. One of the candles closes well below the level of support. The sellers may keep the chart on their watch list closely. They may wait for the price to consolidate and produce a bearish reversal candle to go short in the pair.
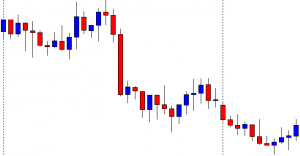
The chart produces four candles with a bullish body. The last candle comes out as a commanding bullish candle closing above the breakout level. If the chart still produces a bearish engulfing candle closing below the last swing low, the sellers may still go short in the pair. However, it does not look that good for the sellers.
As expected, the price heads towards the North further. One of the candles closes above the weekly opening as well. It means the H4 sellers may skip eyeing on the chart to go short. The chart does not belong to the H4 sellers anymore. The buyers may go long on the pair upon bearish retracement followed by a bullish reversal candle at the key level of support though. That is another ball game. Let us find out what the price does afterward.
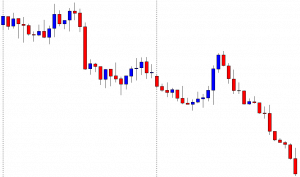
What a strong bearish move that is! The price does not produce a bullish reversal candle. It makes a strong bearish move and makes a new swing low instead. However, the H4 sellers upon weekly high/low breakout may not be able to catch the move. The move belongs to other chart traders. Most probably, the sellers on the daily chart can catch such a move.
We often find such a move that may not offer entry on the chart that we follow. Do not get disappointed. Stick to your chart and trading strategies. Something must be round the corner for you.