Description
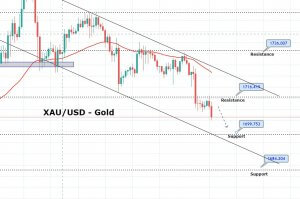
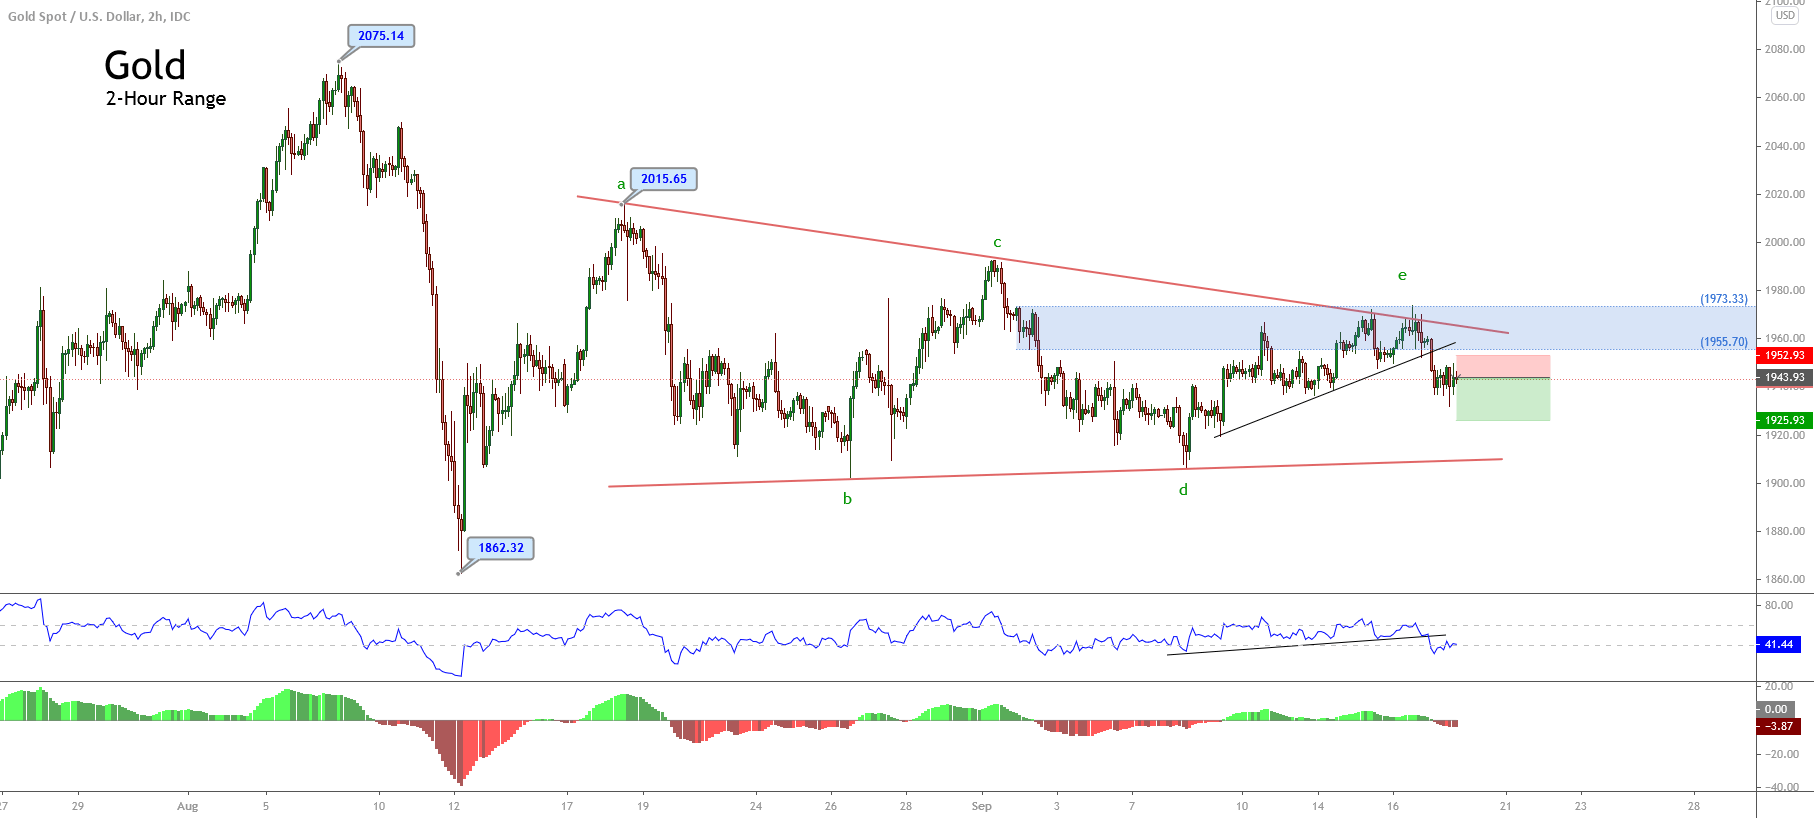
Gold prices in its 2-hour timeframe remain moving in a consolidation structure identified as a triangle pattern. At the same time, the price action reveals a breakdown in its internal sequence, suggesting the likelihood of additional drops.
According to the Elliott wave theory, the price advances in a triangle pattern, which consolidates the first downward movement that began when the precious metal topped at $2,075.14 per ounce on August 07th. With the short-term ascending trendline between waves d and e of Subminuette degree identified in green, the yellow metal unveiled the completion of wave e. It opened the possibility of a new bearish leg of the upper degree.
On the other hand, the RSI oscillator shows a breakdown that pierced below level 40 and consolidated in 41.4, confirming the intraday breakdown developed by the precious metal and increasing the downward move’s likelihood.
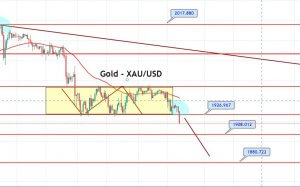
In a conservative scenario, the Gold prices could decline toward the $1,925.93 per ounce, which corresponds to the last swing of September 09th. The invalidation level of our bearish scenario will occur if the price soars over $1,952.93 per ounce.
Chart
Trading Plan Summary
- Entry Level: $1,943.93 per ounce
- Protective Stop: $1,952.93 per ounce
- Profit Target: $1,925.17 per ounce
- Risk/Reward Ratio: 2.08
- Position Size: 0.01 lot per $1,000 in trading account.
Check out the latest trading signals on the Forex Academy App for your mobile phone from the Android and iOS App Store.