
In today’s lesson, we are going to demonstrate an example of an H1 chart, where the price makes a bearish breakout and produces a bearish reversal candle upon making a bullish correction. However, things do not go as the sellers would like. Let us find out what happens and what the reason may imply.
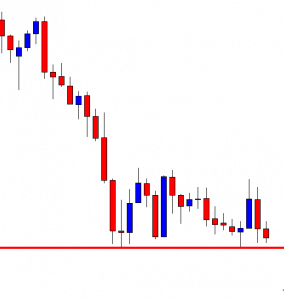
The chart shows that the price produces two bearish candles consecutively. The level of support seems to be a strong one. It may produce a bullish reversal candle and push the price towards the North. However, the sellers may wait for the price to make a bearish breakout at the level of support.
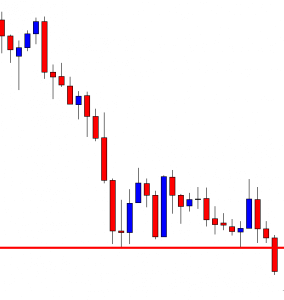
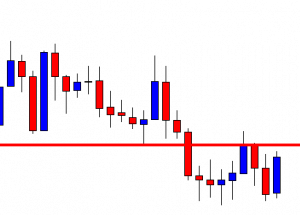
Here it comes. The next candle breaches the level of support closing well below the level. This is one good-looking breakout candle. The sellers are to wait for the price to consolidate or make a bullish correction to produce a short signal.
The price makes a bullish correction. The last candle closes within the breakout level. Please pay attention to the number of candles the chart uses to make the bullish correction. The chart takes five candles to complete the correction. It means the level of support has become H4 support. Let us proceed to the next chart.
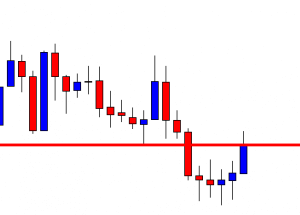
The chart produces a bearish inside bar. This is a bearish reversal candle, of course. However, the question may be raised here whether the sellers take a short entry depending on the H1 chart or not? Let us assume that a seller triggers a short entry by setting stop-loss above the breakout level.
The next candle comes out as a bearish candle. However, the last candle comes out as a bullish engulfing candle. The level is H4 support now. Thus, the buyers may look to go long in the pair and drive the price towards the North. It does not look good for the seller. The price may hit stop loss.
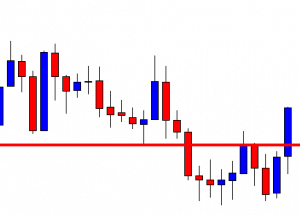
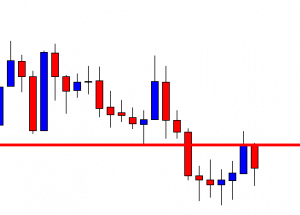
The next candle comes out as a strong bullish candle closing well above the breakout level. The short entry has been wiped off. If we consider the sequence bearish breakout, bullish correction, bearish reversal candle at the breakout level, it seems perfect to go short in the pair. What goes wrong here? In the Forex market, any entry may go wrong. However, over here, the H1 sellers may miss the point that the support is not H1 support anymore. It is H4 support since the level of support holds five candles. This is why the H1 traders may skip taking the short entry in this chart. It often happens in combination trading that traders forget to calculate or synchronize the chart that they are trading at. However, to be successful in trading, traders must not miss this point.