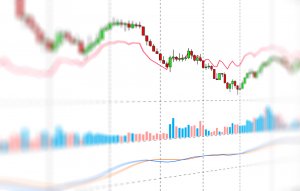
In today’s lesson, we are going to demonstrate an example of an H1 chart offering an entry. We find out how Fibonacci levels and 15-min chart help us take the entry. Let us get started.
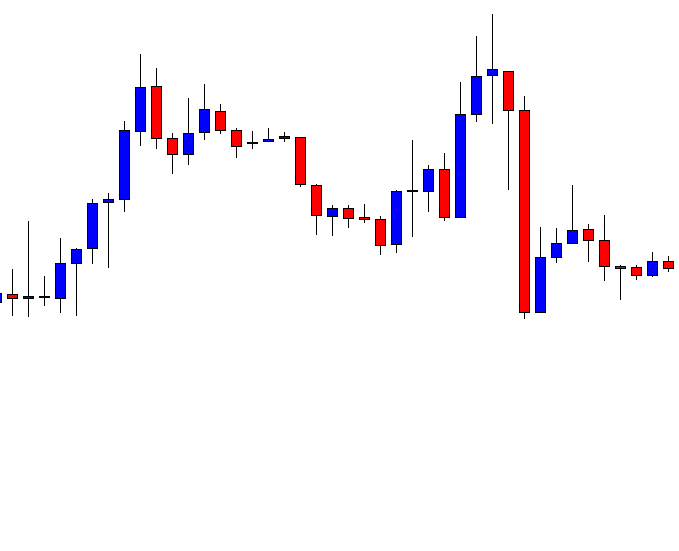
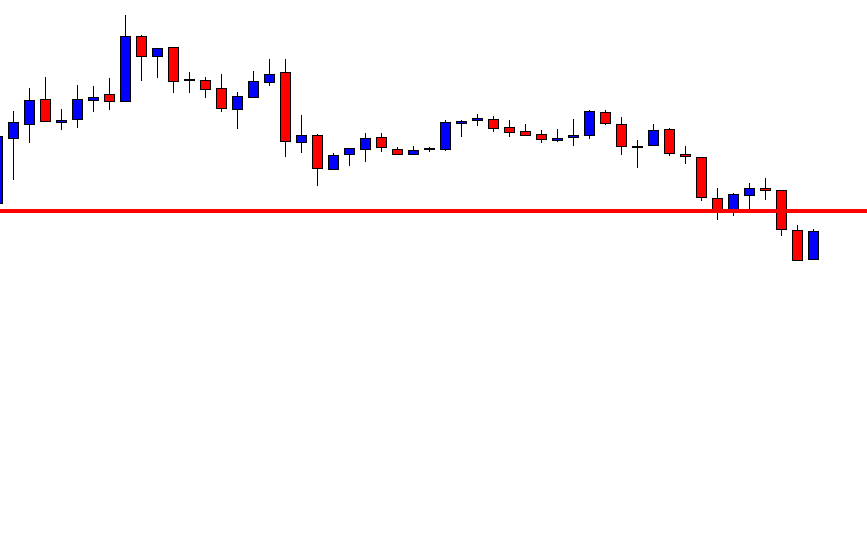
This is an H1 chart. The chart shows that the price after making a strong bearish move has been making an upward correction. The chart produces a Shooting Star and creates a bearish momentum. However, the sellers are to wait for the chart to make a breakout at the lowest low of the wave. Let us proceed to the next chart to find out what the price does next.
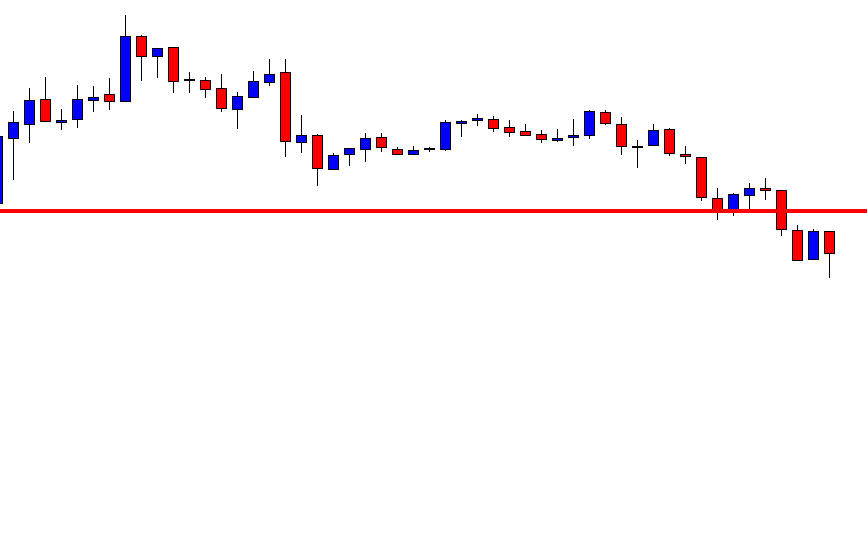
The price keeps driving towards the South and makes a breakout at the lowest low. The breakout candle has a long lower shadow, but it closes well below the level of support. The H1-15M combination traders may flip over to the 15M chart now.
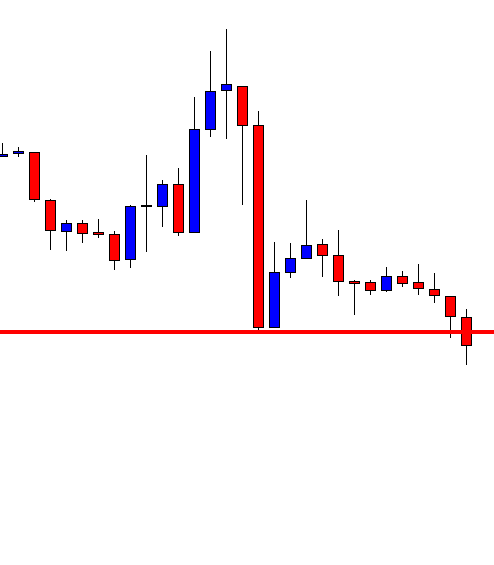
This is how the 15M chart looks. The last candle comes out as a bullish candle. The sellers are to wait for a bearish reversal candle to go short in the pair. They must concentrate hard on the chart. It is waiting time for the sellers.
The 15M chart produces a bearish reversal candle. The candle has a long lower shadow but has a thick bearish body. Moreover, the H1 chart makes a breakout, so a 15M bearish reversal candle means a lot to the sellers. The sellers may trigger a short entry right after the last candle closes. There is another equation, which we will reveal in a minute. Let’s now find out how the trade goes.
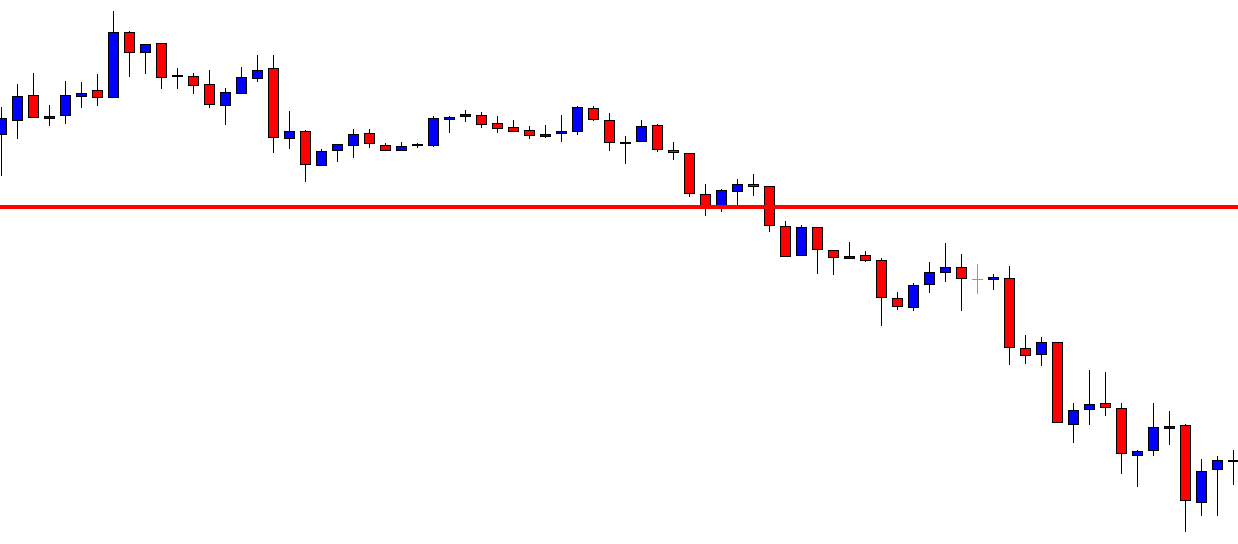
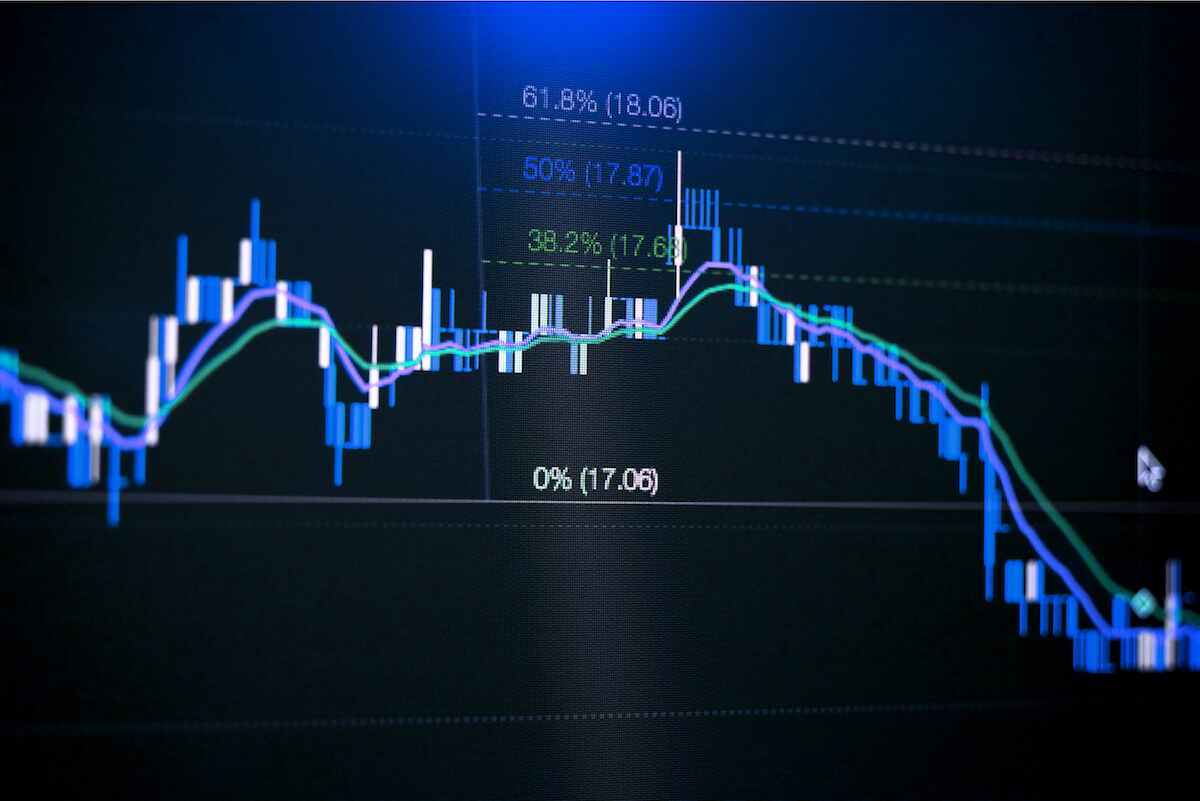
The price heads towards the South with good bearish momentum. The 15M chart shows that it consolidates now and then. The H1 chart should look much more bearish than this. Ok, here is the equation we have pointed out a bit earlier. Let us draw Fibonacci levels and find out how it may help us set our stop-loss and take-profit levels.
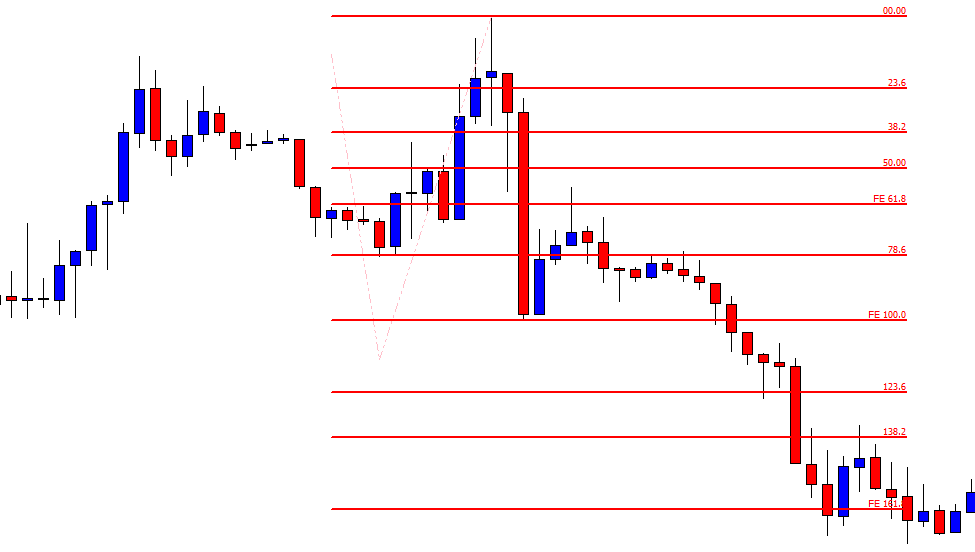
The Fibonacci levels show that the price trends from the level of 61.8%. It makes a breakout at the level of 100.0 and heads towards the level of 161.8. When the price trends from 61.8%, it creates an extra momentum. This is what this example shows, as well. With Fibonacci, we know where to set the take-profit level. Yes, it is to be at 161.8%. With stop-loss, you may set it above 61.8% if you are too defensive a trader. If you want to be too tight with your stop loss, you may set it between 78.6% to 100.0%. The first one offers less risk-reward, but it has a higher winning percentage. On the other hand, the second one offers excellent risk-reward but has less winning percentage. The choice is yours.