Categories
Forex Daily Topic Forex Fibonacci

Intraday Trading: How Fibonacci Levels Help You Determine Entry and Take-Profit Levels

In today’s lesson, we are going to learn an intraday trading strategy using the previous day’s highest high or lowest low. When the price makes a breakout at yesterday’s highest high or lowest low, the price usually trends towards the breakout direction. In today’s lesson, we are going to demonstrate an example of a bearish breakout. After making a bearish breakout at the previous day’s lowest low, the price consolidates and produces a bearish engulfing candle at a significant Fibonacci level. Then, it heads towards the South with good bearish momentum. We try to find out the Fibonacci level where the price trends from as well as the take profit level where the price may make a reversal. Let us proceed.

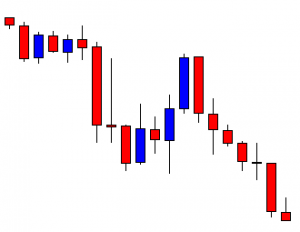
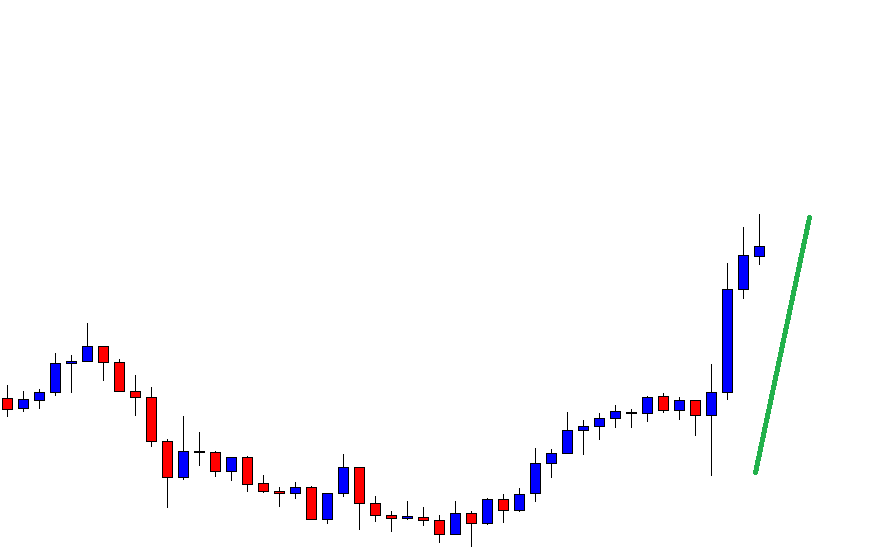
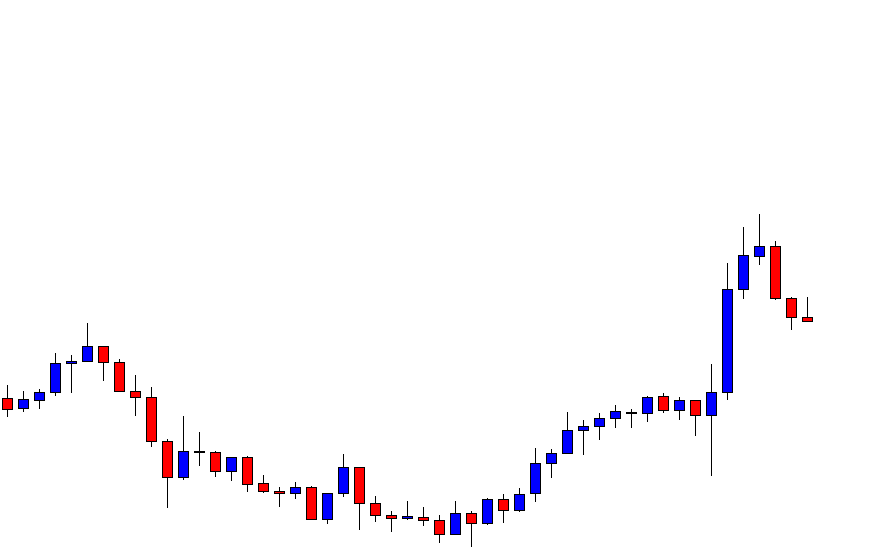
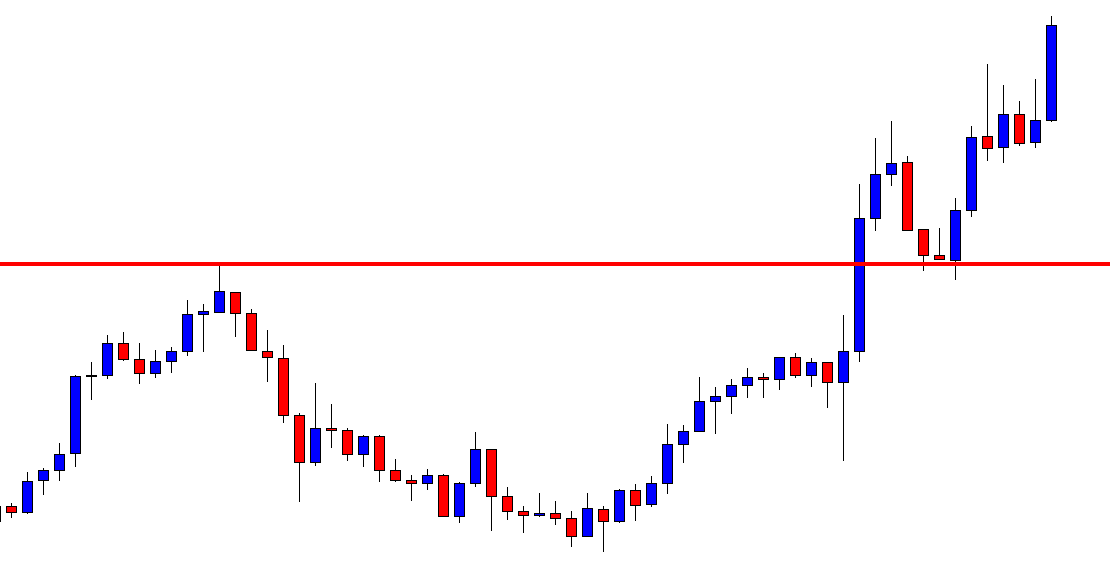
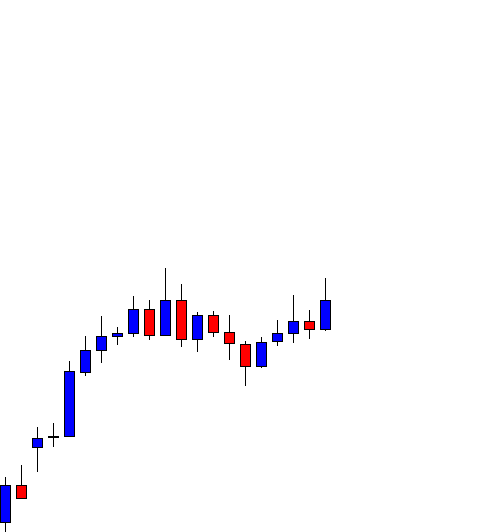
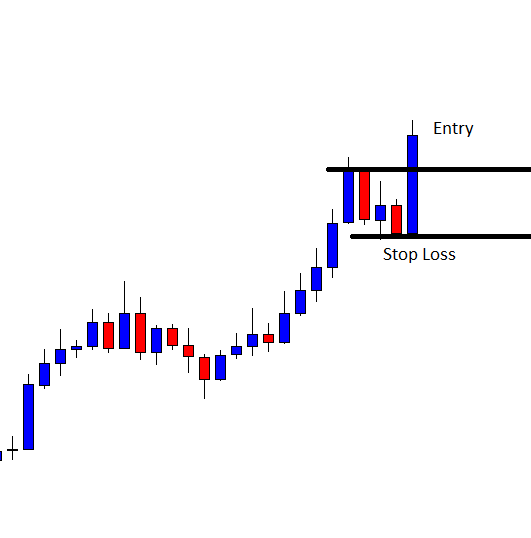
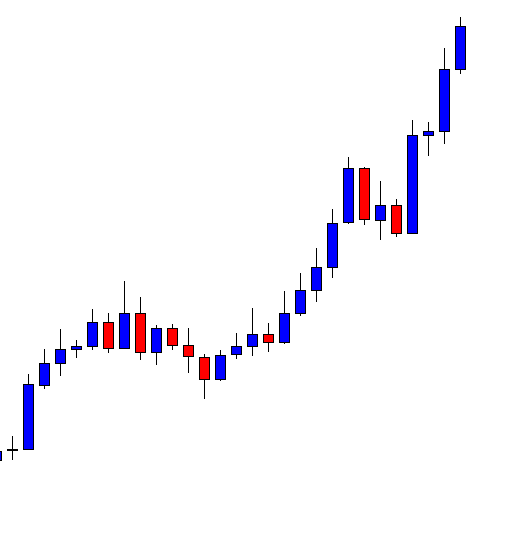
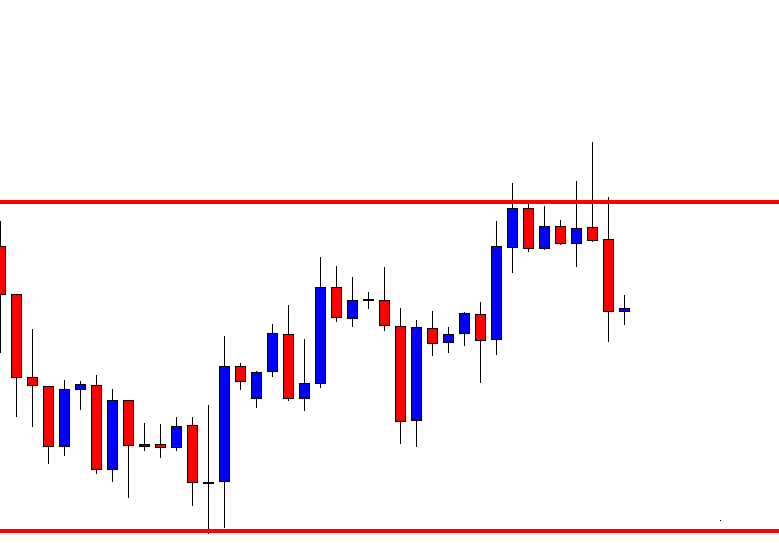
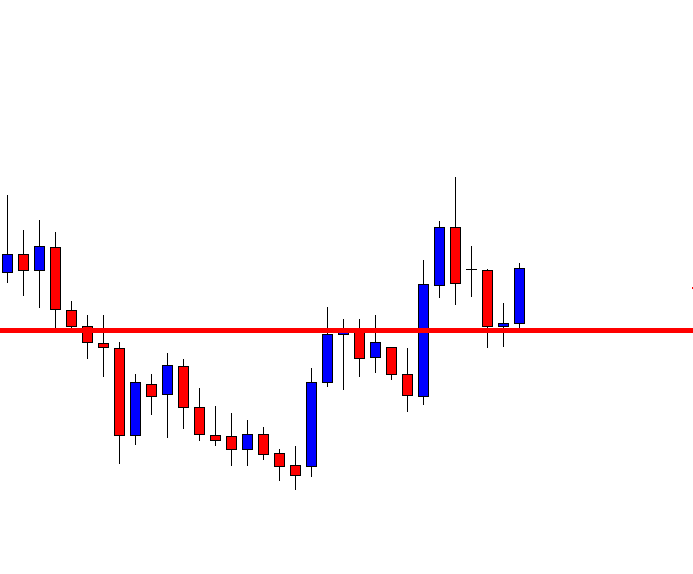
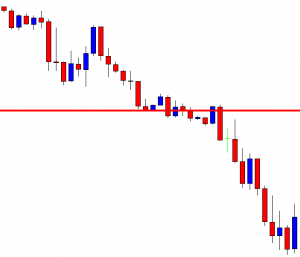
This is an H1 chart. The chart shows that the price makes a bearish move by producing an ABC pattern. The last candle closes the trading session at the lowest low of the day. The next chart shows that the price consolidates around the lowest low of the previous trading day and makes a good bearish move.

The chart suggests that it becomes intraday sellers’ territory. The sellers may look to go short in the pair. The question is how and when. Let us find these two answers.

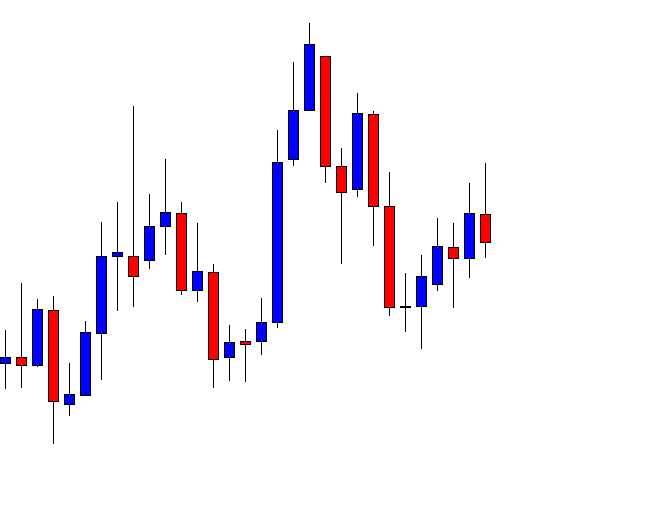
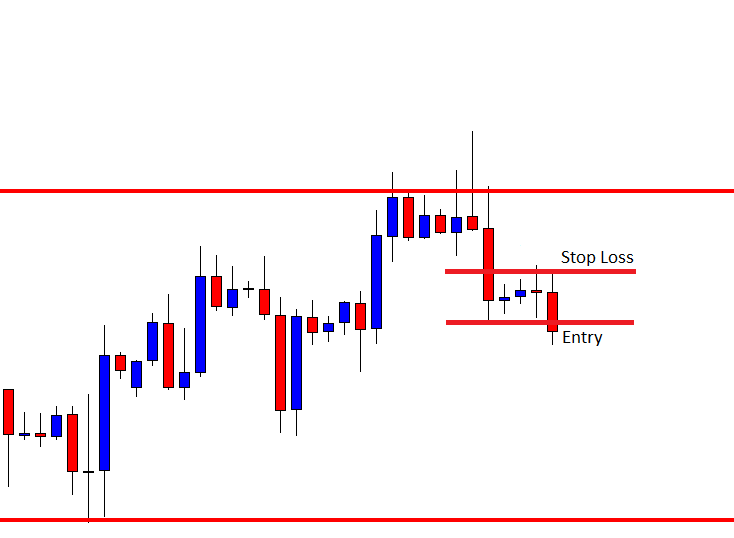
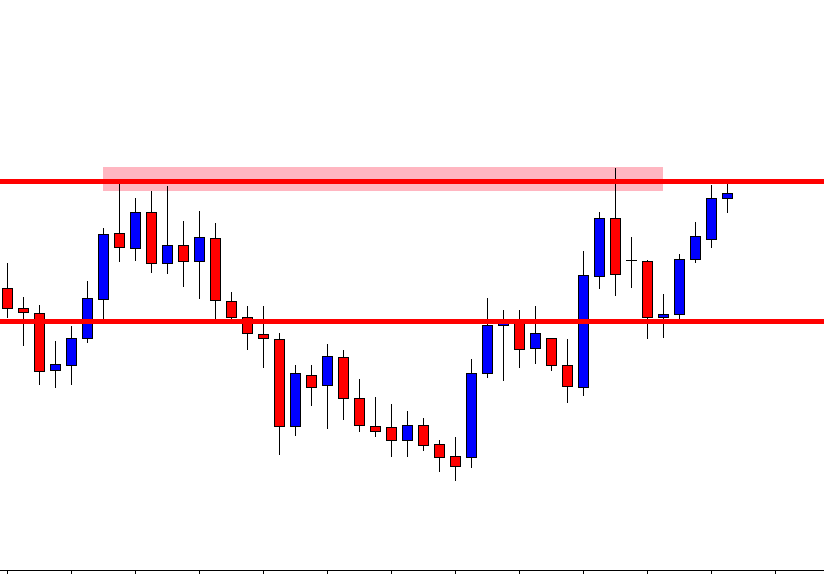
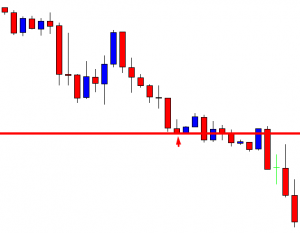
The last candle comes out as a bullish candle. Since the chart has been bearish, the sellers may wait for the chart to produce a bearish reversal candle to go short below consolidation support. Here is another equation that they must consider. We will find that out in a minute.

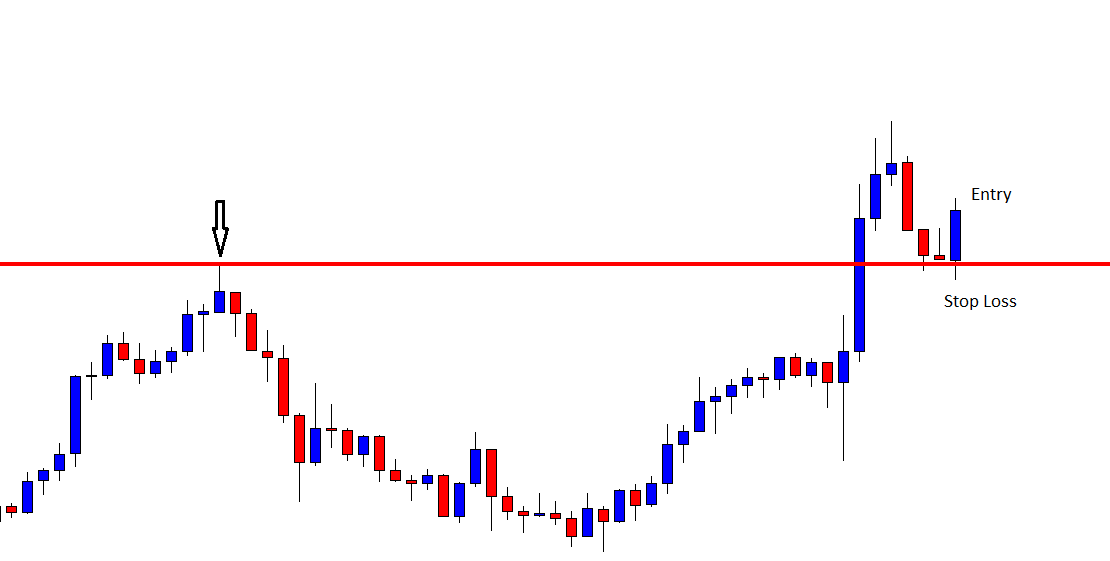
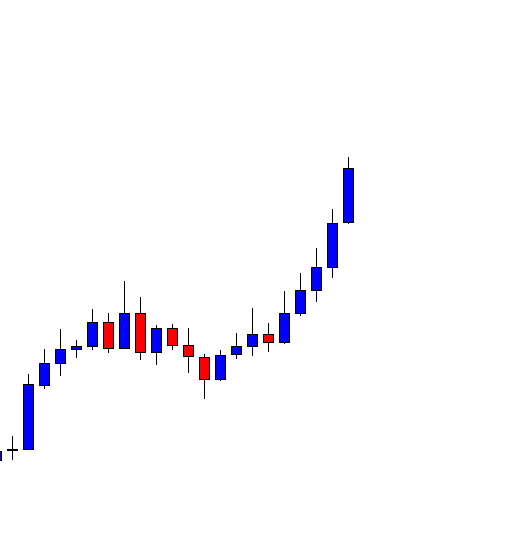
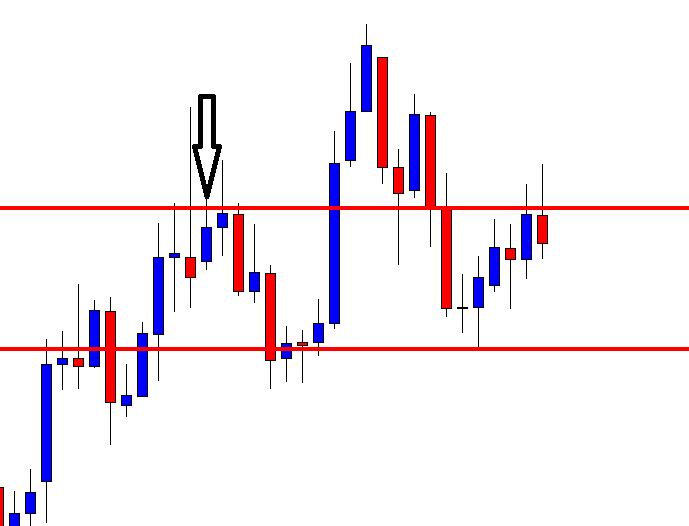
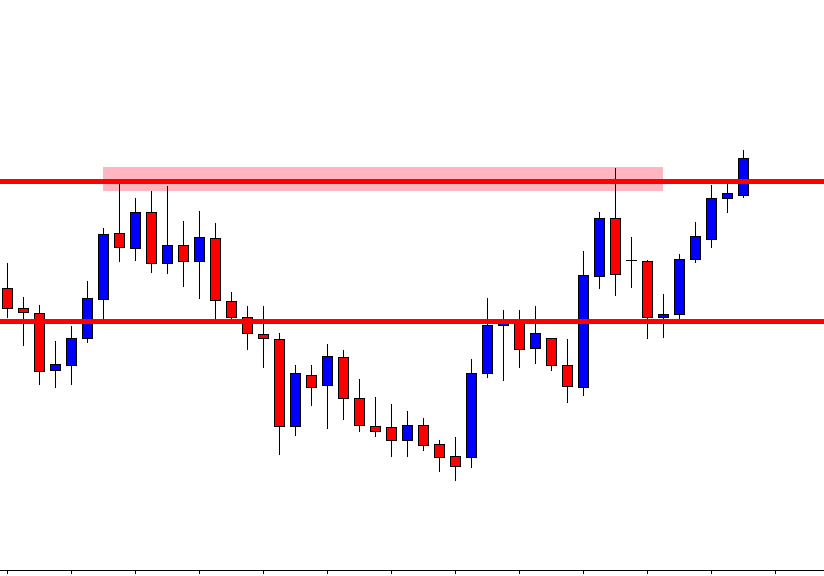
The chart produces a bearish engulfing candle. The sellers may trigger a short entry right after the last candle closes. A question may be raised here that the chart produces a bearish engulfing candle earlier right at the breakout level. We have not concentrated on that to go short from there. However, we have planned to go short right after the last candle closes. What are the reasons behind this? Let us find out how the price reacts after the last candle is produced.

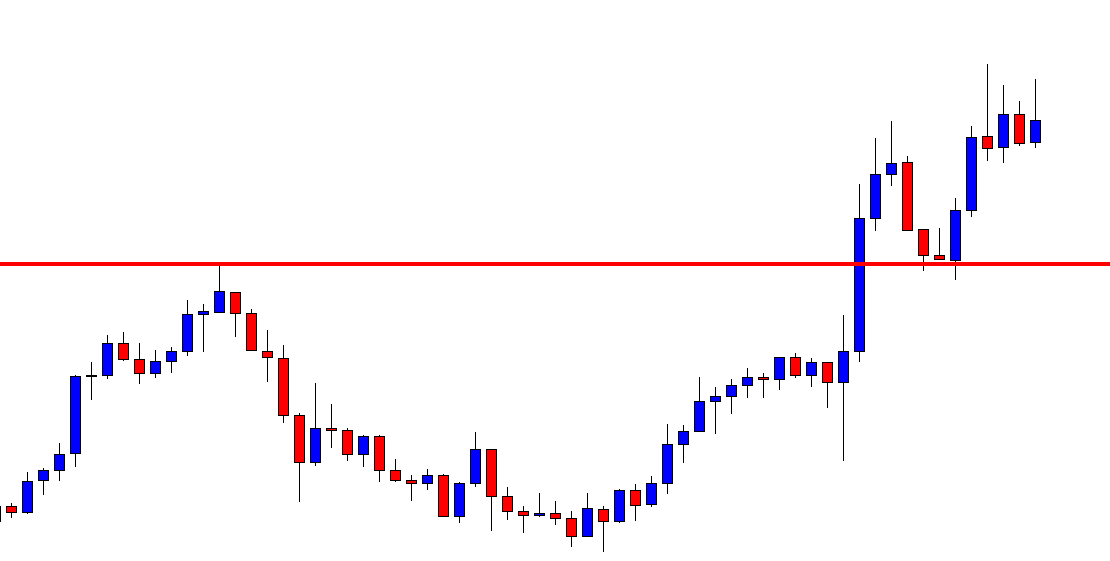
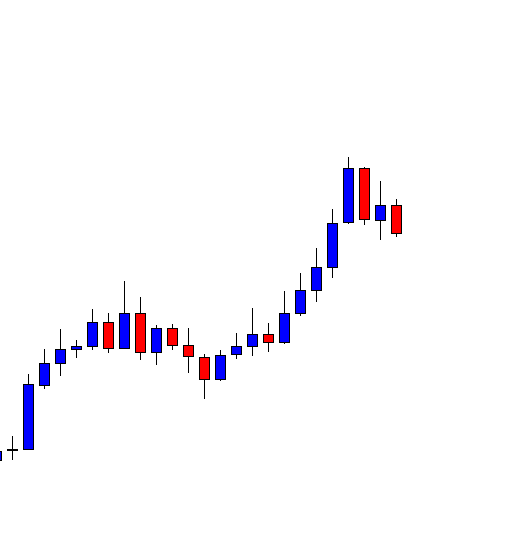
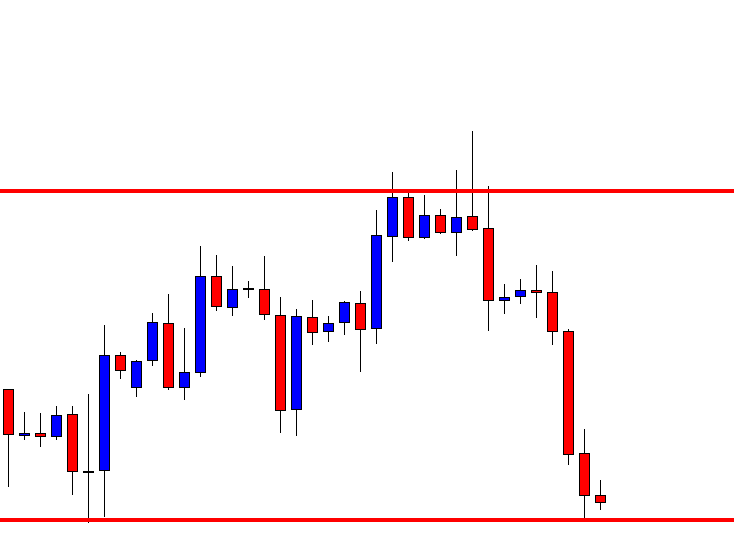
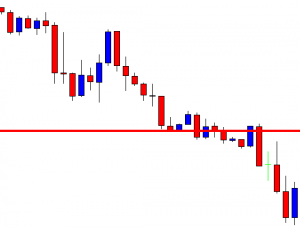
The price heads towards the South with good bearish momentum. The chart produces a bullish reversal candle. It may change its trend or make a bullish correction, at least. For intraday traders, they cannot afford to wait as many pips by waiting to get a bullish reversal candle. They are to close the trade right after the last bearish candle. The question is, how would they know that they should set their take profit at that level?

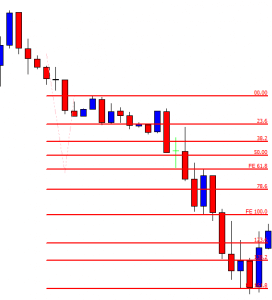
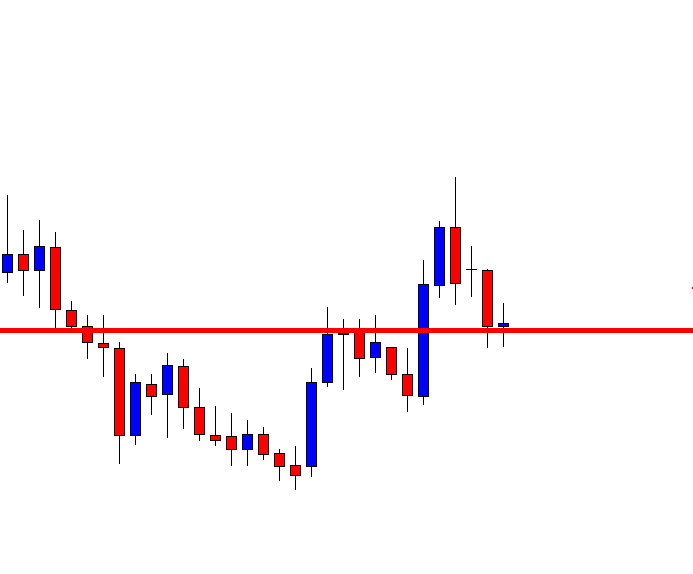
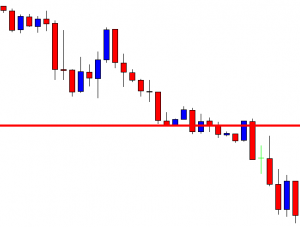
The answer is Fibonacci levels. Do you remember I was talking about the level for the price to resume its bearish move, we find that out by Fibonacci levels as well. See, the chart produces a bearish engulfing candle at the level of 61.8%, and it hits 161.8%. These are two levels intraday traders must count when a pair trades below the previous day’s lowest low or vice versa. Stay tuned for more lessons for intraday trading with Fibonacci levels.

Categories
Forex Daily Topic Forex Price-Action Strategies

ABC Pattern Trading: A Little Adjustment Needed According to the Charts

The ABC pattern is one of the traders’ favorite trading patterns for its lucrative risk-reward. It usually offers at least 1:2 risk-reward. In many cases, it offers even more. However, the price may sometimes find it hard to make a breakout at point B. That is where the ABC pattern traders must be patient and hold their nerves while trading on the minor charts. However, with major charts, it is a bit different. In today’s lesson, we are going to demonstrate an example of the ABC pattern trading on a minor chart.

This is an H1 chart. The price heads towards the North with good bullish momentum after having consolidation for a long time. The ABC pattern traders are to wait for the price to make a downside correction and produce a bullish reversal candle at C point.

The price has been on a downside correction. It produces three consecutive bearish candles. The ABC pattern buyers shall keep their close eyes on the chart to get a bullish reversal candle.

The chart produces a bullish engulfing candle. This is an A+ bullish reversal candle. The ABC pattern traders have some drawing work to do before the price produces a reversal candle. We find this out in a minute. Can you guess where the chart produces the bullish reversal candle? Have a look at the chart below.

Do you notice that the price had a massive rejection at the same level earlier? The chart produces the bullish reversal candle at the flipped support. This is an ideal C point. The buyers may trigger a long entry right after the candle closes by setting stop loss below the signal candle. As mentioned, take profit may be set at least with 1:2 risk-reward.

After triggering the entry, the price heads towards the North with good bullish momentum for three more candles. It then starts having consolidation around the last swing high (at point B). It often happens. The buyers must wait and hold their positions since the trade setup in on the H1 chart. The intraday ABC pattern traders must follow the rule “Set and Forget”. With the H4, the Daily, it is different though. Let us proceed to the next chart.

The chart produces another bullish candle and hits the target. The buyers’ have achieved their 2 R target. We must remember that when we trade on the ABC pattern, we adjust our target according to the chart. Intraday charts (5M, 15M, H1) usually makes a breakout at Point B. Thus, we let the trade run and decide its route. On the other hand, if an entry is taken on the charts such as the H4 and the daily based on the ABC pattern, we may consider taking at least 50% profit at Point B. This is where a little adjustment is needed if we trade based on the ABC pattern.

Categories
Forex Price-Action Strategies

The ABC Pattern’s C Point May Confuse You Time to Time

In today’s lesson, we are going to demonstrate an example of the ABC pattern trading. In this example, the price does not make a full-wave correction to produce C point. However, the signal candle comes out as a strong reversal candle, which drives the price towards the trend’s direction. Let us get started.

The price makes a long bearish move and produces a bullish reversal candle. The price heads towards the last swing high. The buyers are to wait for a breakout at the level of resistance (swing high) first. A correction followed by a bullish engulfing candle at the breakout level would be the signal to go long here.

The chart makes a breakout keeps producing bullish candles. The buyers are to wait for the chart to produce a bearish reversal candle to make a downside correction. Since the chart produces one more bullish candle, it may make a correction soon.

After producing a bearish reversal candle, the price keeps making a correction. Ideally, the buyers would love to see the price come back to the breakout level. However, it is the Forex market. Things do not always go by the book here.

As mentioned, things do not always go by the book. The price does not make a full-wave correction. Nevertheless, look at the bullish reversal candle. The candle closes way above the last swing high. The buyers may trigger a long entry right after the last candle closes. We must remember that this is not an A+ entry as far as the ABC pattern trading is concerned. Let us proceed to the next chart to find out how the trade goes.

The price heads towards the North with good bullish momentum. Typical 1 R is achieved as well. In a word, the long entry gets the profit for the buyers. As mentioned earlier, this is not an A+ entry. The question is, shall we go for such entry?

In most cases, such price action may get us profit. However, if we do not like to take losses, we may skip taking such entry. Especially, in the beginning, traders find it hard to digest losses. Thus, for beginners, it would be best if they skip taking such entry and only go for A+ entry. Traders learn the art of digesting losses with time. Yes, you have read it right. Digesting losses in Forex trading is an art. If you have already learned the art, then you may as well go with an entry like this. In the end, you will be able to come out with a profit.

Categories
Forex Price-Action Strategies

Does the ABC Pattern Give Any Clue about the C Point?

We have learned about the ABC pattern in some of our previous lessons. The C point is the most crucial factor to trade on the ABC pattern. Traders use Fibonacci retracement, flipped support/resistance to spot out the C point. Fibonacci retracement works like magic, which we will learn soon. In today’s article, we will demonstrate an example of an ABC pattern and try to find out whether it gives us any clue about the level before it produces the C point.

This is a daily chart. The price after being very bearish makes a bullish move. The price produces a bearish reversal candle. It is an inside bar not being a strong bearish reversal candle. However, we must notice where it is produced. Let us have a look at the same chart with some horizontal lines.

Look at the chart now. The price reacted at the level earlier. The level worked as a strong level of resistance and drove the price towards the downside. This time, the level produces a bearish reversal candle. The ABC pattern traders usually wait for such price action around such levels. To take an entry, the daily-H4 chart combination traders are to flip over to the H4 chart.

The price produces a reversal candle. It may consolidate now. The sellers are to get a bearish reversal candle and to find out a level of resistance to set their Stop Loss above it. A breakout at the level of support is the signal to trigger a short entry.

The price consolidates. Upon getting its resistance, it makes a breakout. A short entry may be triggered right after the last candle closes. The price may find its next support at the red-marked level (point B). Let us find out how the trade goes.

The trade goes well. The price heads towards the Take Profit with extreme bearish pressure. Since this is an ABC pattern’s daily-H4 chart combination, the price may travel towards the South further. The sellers may consider taking partial profit here. Taking Partial Profit usually increases our chance of getting more pips. When we can find out an ABC pattern, and we are trading on the C point, it often gets us more profit in the end. To be able to spot out the C point, we must practice a lot with Fibonacci retracement, eyeing on flipped levels, and previous levels of support/resistance.

Categories
Forex Price-Action Strategies

Trading the ABC Pattern

In today’s lesson, we are going to demonstrate an example of an ABC pattern trading on a daily chart. The ABC pattern is one of the most consistent trading patterns in the financial market. It offers an excellent risk-reward as well as a high winning percentage. Let us get started.

This is a daily chart. The price after being bullish makes a bearish move. The last candle comes out as a doji candle. This is a bullish reversal candle, which is not a strong one. However, look at the level where the price produces the doji candle.

It is a flipped level of support. Technically, the buyers are to wait for a bullish reversal candle to go long around this level. Since this is not a strong bullish reversal candle, the buyers might as well wait for a bullish engulfing candle to go long from here.

Here it comes. This is a bullish engulfing candle closing above the last bearish candle. This means it produces a morning star. The buyers may trigger a long entry right after the last candle closes. This point is known as point C in the ABC chart pattern. Traders shall set their stop loss below the level of support. With take profit, they are to be tricky. The last swing high (or low) often becomes a big factor. Thus, buyers may consider taking a partial profit. Have a look at the chart below.

The price often roams around and even makes a reversal at this point. This point is known as point B. If we take out the 50% profit around this level and let the rest of it run, we give ourselves a chance to win more pips without any risk. If the price produces an ABC pattern, in 70% cases, it makes a new higher high or lower low. Let us find out what happens here.

The price makes a breakout. We have taken out some of our profits. Now, we may consider using a trailing stop setting below the last candle (breakout candle). We must be patient and hold the trade until the price produces a strong bearish reversal candle.

The price heads towards the North with good bullish momentum, and then it produces a bearish reversal candle. It may still head towards the North if it makes a bullish breakout after consolidation. Meanwhile, we may come out with the rest of the trade.

The price pattern is produced in almost all the pairs and in all time frames. It is one of the most common price patterns, which is favorite among the financial traders. To be able to trade and make money out of it, we need to have a lot of back-testing and practice.