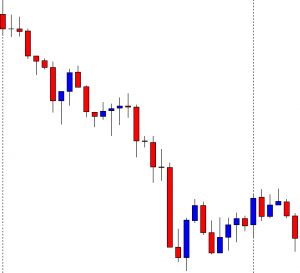
In today’s lesson, we are going to demonstrate an example of an H4 chart that seems promising to make a breakout at the last week’s low. It produces a strong bearish candle as well at last, but the price does not head towards the South. We try to find out the possible reason behind that.

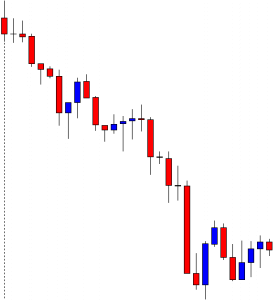
It is an H4 chart. The chart shows that the price heads towards the South with good bearish momentum. The price bounces twice at a level of support. The pair closes its trading week by producing a bearish candle.
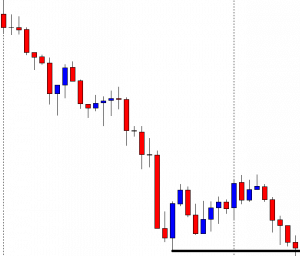
The pair starts its next week by producing a bullish engulfing candle. It means the breakout length gets bigger, which attracts the sellers more. The sellers are to wait for the price to make a bearish reversal candle followed by a breakout at the weekly low.
The price finds its resistance and produces two consecutive bearish candles. The sellers are to keep their eyes on the chart closely. It seems that the Bear is going to make a breakout soon. Let us proceed to the next chart to see what happens next.
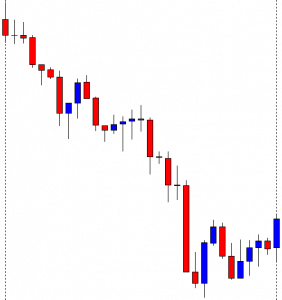
The chart continues to produce bearish candles. However, it has not made a breakout at the weekly low yet. The last candle comes out as a spinning top closing within the weekly low.
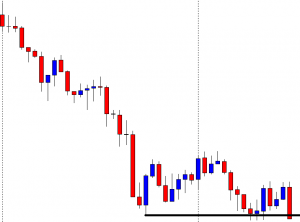
The chart produces a spinning top followed by a bullish engulfing candle. The price then consolidates within the last week’s low and a new resistance. The last candle comes out as a bearish engulfing candle closing just below the weekly low. The question is whether it should be considered as a breakout. It is a breakout, but the H4 traders should skip taking entry on this chart based on a weekly high/low breakout. The reason behind that is the chart takes too long to make the breakout. Once the price starts trending, it must make a breakout without producing any reversal candle. It means if the chart produced the last candle right after the first spinning top; it would be a hunting ground for the sellers. Since it produces four bullish reversal candles before making the breakout, the chart does not belong to the H4 traders based on the weekly low anymore. We must not forget that it must consolidate after a breakout, though. It means it must produce bullish reversal candle/candles in case of a bearish breakout, but it must make a breakout only by producing bearish candles and vice versa.