Categories
Forex Elliott Wave Forex Market Analysis

GBPCAD Advances in a Double-Three Pattern

Overview

The GBPCAD cross advances in a sideways sequence corresponding to an incomplete double-three pattern. The mid-term Elliott Wave view foresees a potential rally that could boost the cross toward last March’s highs.

Market Sentiment

The mid-term market sentiment overview of the GBPCAD cross unfolded by the 90-day high and low range and illustrated in its daily chart, reveals the price action moving in the bearish sentiment zone (SZ).

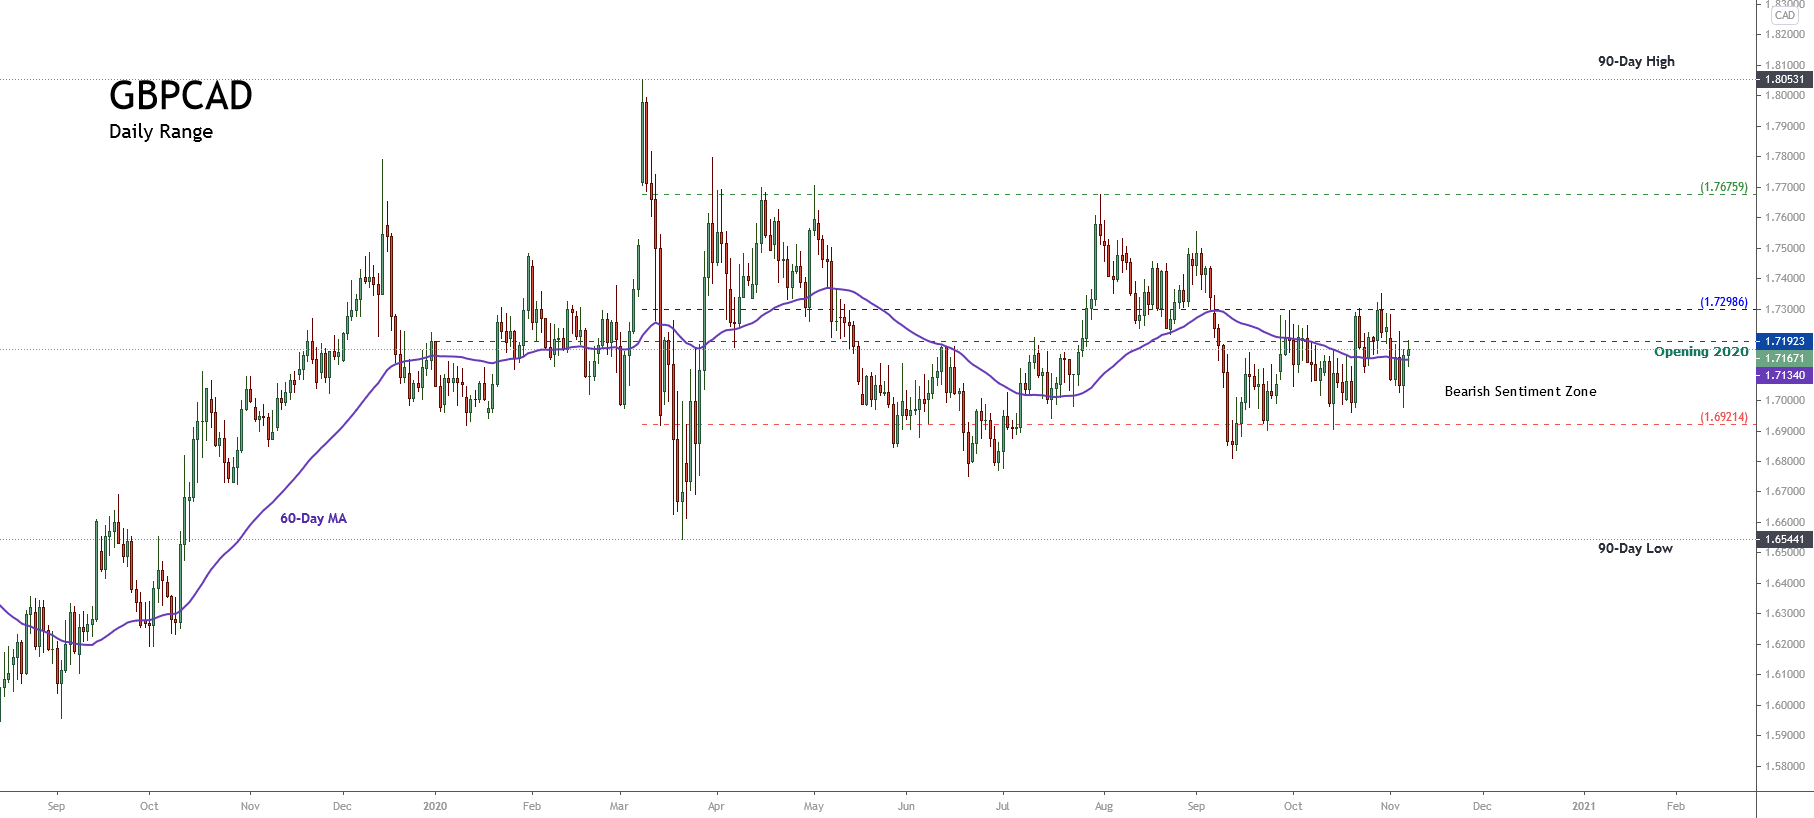
The previous chart reveals the sideways movement bounded between the extreme bullish SZ located at 1.76759 and the extreme bearish SZ at 1.69214. Likewise, the 60-Day moving average looks flat, suggesting the balance between supply and demand, or bull and bear traders, which in turn, is indicative of sideways action.

On the other hand, considering the year’s opening price at 1.71923, we distinguish that the yearly candlestick pattern corresponds to a narrow body candle identified as a doji, revealing the next direction’s market participants’ indecision that the price will take.

In consequence, while the GBPCAD cross remains moving mostly sideways, the primary bias will continue neutral.

Elliott Wave Overview

The long-term Elliott Wave landscape of the GBPCAD cross reveals the price action is developing an incomplete three-wave sequence of Intermediate degree labeled in blue, which currently advances its wave (B). The internal structure unfolds in a double-three pattern as it exposes the next weekly chart on a log scale.

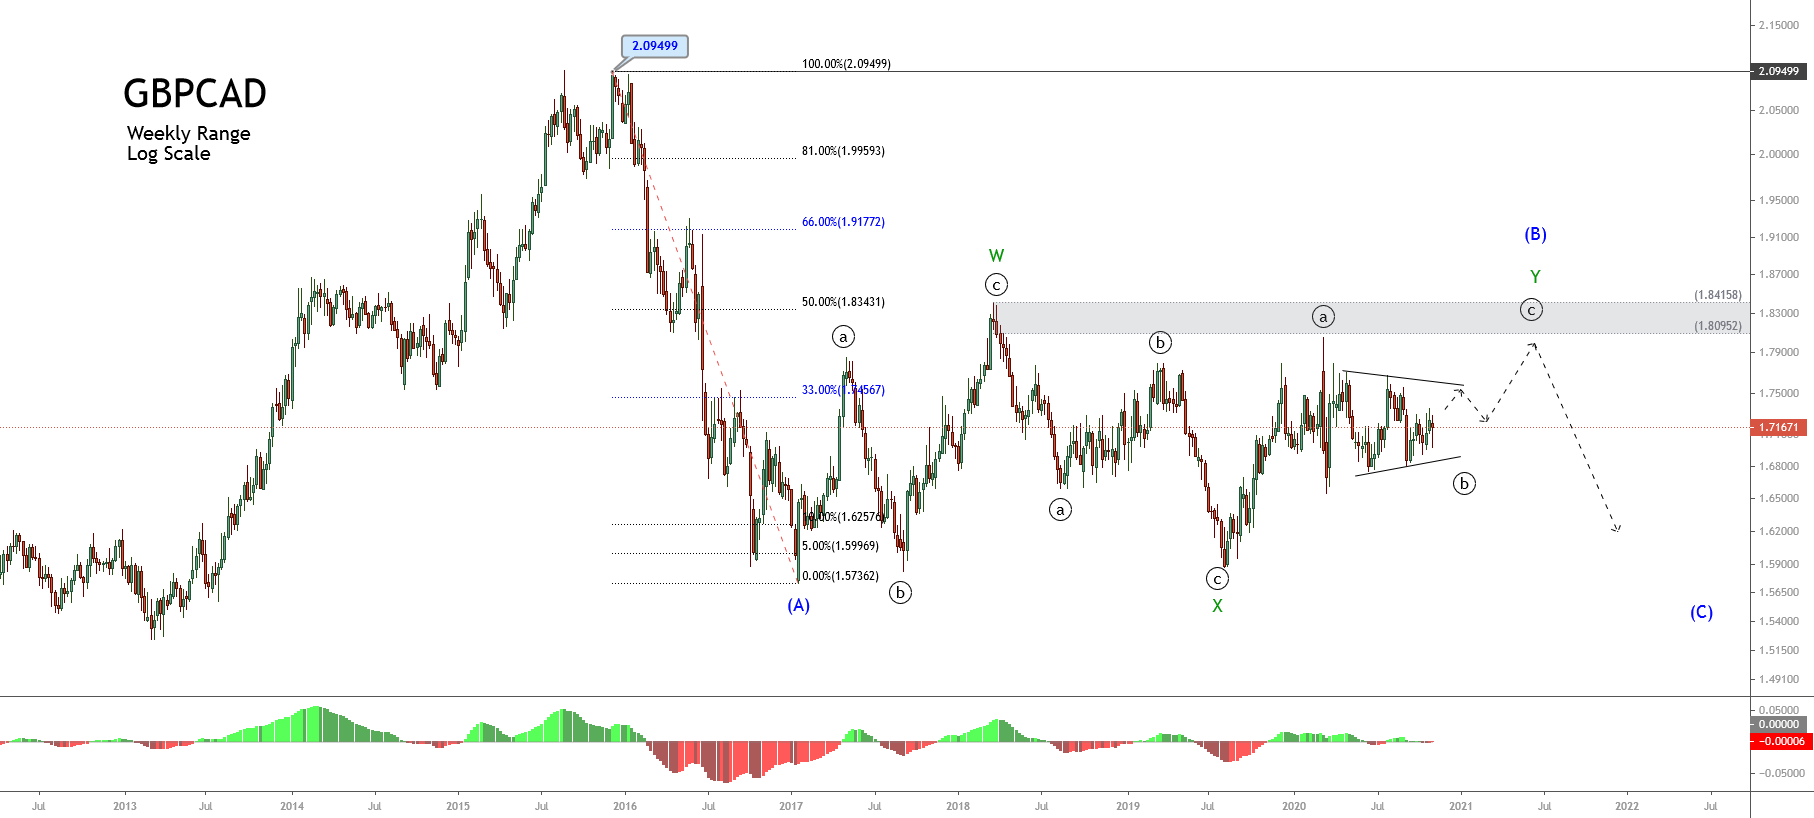
The previous chart reveals that the double-three pattern in progress looks incomplete. According to the Elliott wave theory, this complex formation follows an internal structural series subdivided as 3-3-3. In this context, the GBPCAD cross advances in its last “three” or the third component of the double-three pattern identified as wave Y of Minor degree labeled in green.

The internal structure of wave Y subdivided into another “three” sequence, which advances in its wave ((b)) of Minute degree labeled in black. Likewise, the wave ((b)) follows the arrangement of a triangle pattern. Thus, the GBPCAD cross should develop an upward movement subdivided into five-waves, corresponding to its wave ((c)) of Minute degree identified in black.

Elliott Wave Outlook

Considering the progress of the GBPCAD cross into a triangle pattern, the following 12-hour chart unveils that the price completed its wave ((b)) with the failure of reaching a new lower low at 1.69014, where the cross began to advance in an upward sequence that corresponds to its wave ((c)) of Minute degree identified in black.

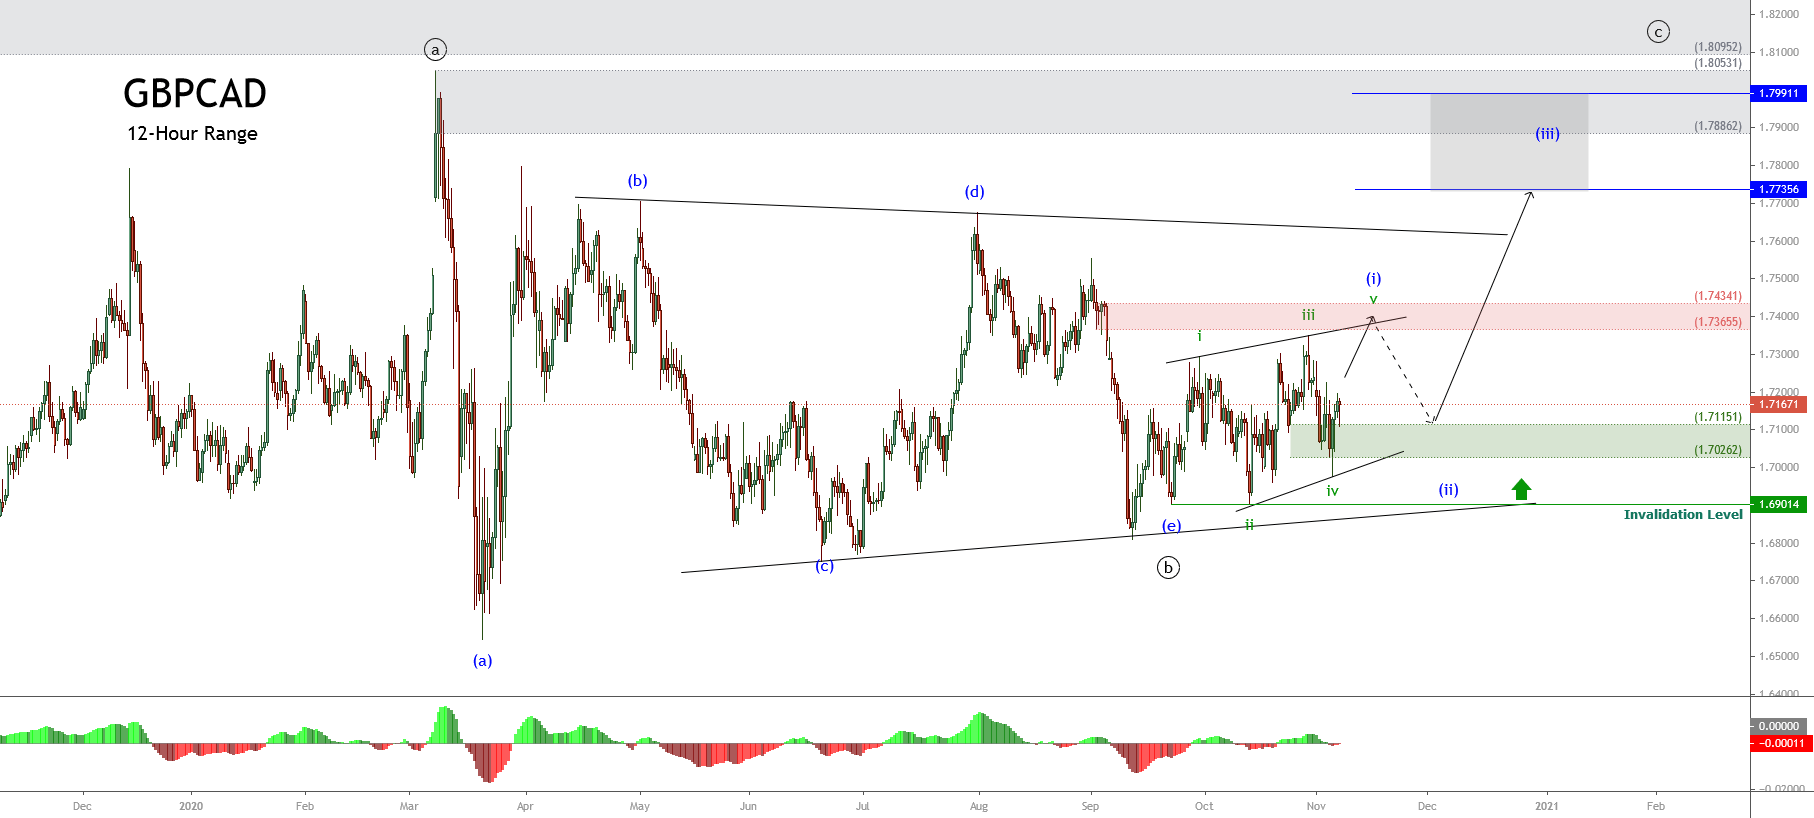
The previous chart illustrates the end of the wave (e) of Minuette degree identified in blue and the upward sequence of a potential leading diagonal pattern, which could follow a 5-3-3-3-3 internal sequence. Simultaneously, the price seems to be advancing in its fifth wave of Subminuette degree labeled in blue, which belongs to the first wave of Minuette degree in blue. 

The first impulsive wave of Minuette degree could find resistance in the supply zone between 1.73665 and 1.74341, from where the cross could start to retrace until the demand zone is located between 1.71151 and 1.70262. Once GBPCAD completes its second wave, the third wave could become the upward cycle’s extended wave. This upward movement could drive the pair toward 1.77356 and continue until 1.79911.

The bullish scenario’s invalidation level locates at 1.69014, which coincides with the wave’s origin ((c)) that remains in progress.

Categories
Forex Basic Strategies

Pairing The ‘Gravestone Doji’ Pattern With Significant Resistance Levels

Introduction

Gravestone Doji is a bearish reversal candlestick pattern that occurs at the top of an uptrend. This pattern helps the traders to visually see where the significant resistance level is located on the price chart. The most important aspect of the Gravestone Doji pattern is its long upper shadow. The candlestick’s open, close, and low are all the same in this pattern.

The psychology behind the long upper shadow is this – In an ongoing uptrend, when the price action hits the significant resistance line, buyers exit their positions, and the price action is smacked down by the sellers. In short, the appearance of this pattern represents the losing momentum of the buyers and essentially indicates a bearish reversal in the market.

Most of the traders place their trades as soon as this pattern appears on the price chart. But that’s definitely not the right approach. Instead, we must wait for the next candle to close for the confirmation and only then take the trades. The opposite of the Gravestone Doji is the Dragonfly Doji, which appears at the bottom of a downtrend or the major support area. The below image represents the Gravestone Doji Pattern.

Trading Strategies – Gravestone Doji Pattern   

The Gravestone Doji pattern indicates that the buying trend is ending, and the market is reversing to the selling side. However, this doesn’t hold true all the time. We will be finding this pattern quite often in all the types of market conditions, and if we start trading every time we find them, we will end up on the losing side. We always need to ask our self the reason why this pattern appears in certain conditions. Is it going to reverse the market or not?

Pairing the pattern with a significant resistance level

If you find this pattern at the bottom of the range, do not trade it. But if the price action prints this pattern at the top of a range, it can be considered a sign for us to go short. Similarly, find the trending markets and look for a major resistance level where the price could possibly react. So when the price action prints a Gravestone Doji at the major resistance level, it’s a strong sign for us to go short.

In the below USD/CHF Forex chart, we can see that the price action has printed the Gravestone Doji pattern at the significant resistance level. We should be going short as soon as the Doji candle closes.

In the below image, we can see that we took a sell entry when the market printed the Gravestone Doji pattern. We have placed the stop-loss just above the resistance level. It is safer to put the stop-loss above the pattern or at the resistance line because if the price goes above the pattern, the pattern gets invalidated. We know that the Gravestone pattern indicates a market reversal, and most of the time, these reversals travel quite far. That is the reason why we go for deeper Take Profits.

In the above chart, we can see that we had exited our full positions when strong buyers showed up. This indicates that the sellers are losing their momentum, and there is no logic to continue holding our positions.

Gravestone Doji + Stochastic Oscillator

The strategy that we shared above is for aggressive traders who like to take risks. However, if you are A type of trader who needs more confirmation to pull the trigger, we suggest you follow this strategy to trade this pattern. Most of the conservative traders do have a fear in their minds that one single candle does not have the potential to reverse the market. And it is completely okay to think like that. The truth is that sometimes even a single candle can move the market, and sometimes it doesn’t. Ultimately it is your money management system that makes all the difference.

But to filter out some poor signals and to get an additional confirmation, it is advisable to use the Stochastic oscillator to confirm the probability of our trading signal. Stochastic is a range-bound indicator that oscillates between the 0 & 100 levels. When the Stochastic goes above the 70 level, it means that the market is in an overbought condition, and we can expect a change in the trend. Likewise, when it goes below the 30 levels, it means that the market is oversold are we can expect a reversal anytime soon.

The Stochastic indicator also shows the bearish and bullish divergence, which helps the traders in trading the upcoming reversals. The divergence is when the market moves in one direction, but the indicator is signaling a different direction. Now we believe that you understand the basics of trading with the Stochastic indicator. Now let’s dive into the strategy.

The strategy here we are using is simple and straight forward. First of all, identify the Gravestone Doji pattern at a significant resistance level in an uptrend. Then, apply the Stochastic indicator to the price chart and check if the indicator is at the overbought area, indicating a downside reversal. If yes, go short and place the Stop-Loss just above the pattern.

The GBP/CAD chart below indicates the appearance of the Gravestone Doji pattern in an uptrend. When the price is approaching the upper resistance level, it got smacked down immediately, and the market ended up printing the pattern. The next six candles tried very hard to break the pattern & resistance line, but nothing worked, and the price ended up rolling down. We can also observe the Stochastic indicator was at the overbought area, which is a confirmation sign for us to go short.

We have entered for a sell when both the conditions are met, and placed the Stop-Loss just above the pattern. For the Take-Profit, we choose to go for deeper targets. When the selling trend started to struggle, the Stochastic indicator was at the oversold selling conditions. At that point, we have closed our full positions for obvious reasons.

Conclusion

The trades taken based on the Gravestone Doji pattern are pretty reliable. But do not make the mistake of identifying the pattern everywhere on the price chart. The psychology behind this pattern says that the bulls drove the price to a peak point, and the sellers are comfortable in reversing the market. For booking profits, you can expect an equal move to that of a previous trend. If you are an intraday trader, make sure to exit your positions at any significant level. Although this pattern appears on all the timeframes, the reliability is higher on higher timeframes to that of lower timeframes.

We hope you find this article informative. Try trading this pattern on a demo account and master it before applying the above-mentioned strategies on the live market. Cheers.